. 2024 Oct 3;13(10):e70011.
doi: 10.1002/cti2.70011. eCollection 2024.

Targeting CD38 with monoclonal antibodies disrupts key survival pathways in paediatric Burkitt's lymphoma malignant B cells

Affiliations

Targeting CD38 with monoclonal antibodies disrupts key survival pathways in paediatric Burkitt's lymphoma malignant B cells

Kathrin Kläsener et al. Clin Transl Immunology. .

Abstract

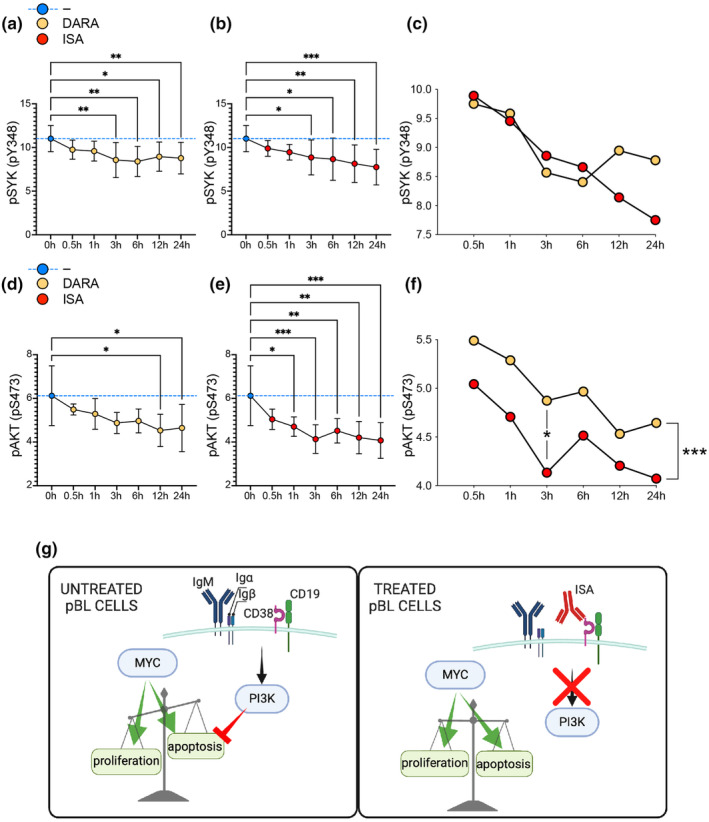
Objectives: Paediatric Burkitt's lymphoma (pBL) is the most common childhood non-Hodgkin B-cell lymphoma. Despite the encouraging survival rates for most children, treating cases with relapse/resistance to current therapies remains challenging. CD38 is a transmembrane protein highly expressed in pBL. This study investigates the effectiveness of CD38-targeting monoclonal antibodies (mAbs), daratumumab and isatuximab, in impairing crucial cellular processes and survival pathways in pBL malignant cells.

Methods: In silico analyses of patient samples, combined with in vitro experiments using the Ramos cell line, were conducted to assess the impact of daratumumab and isatuximab on cellular proliferation, apoptosis and the phosphoinositide 3-kinase (PI3K) pathway.

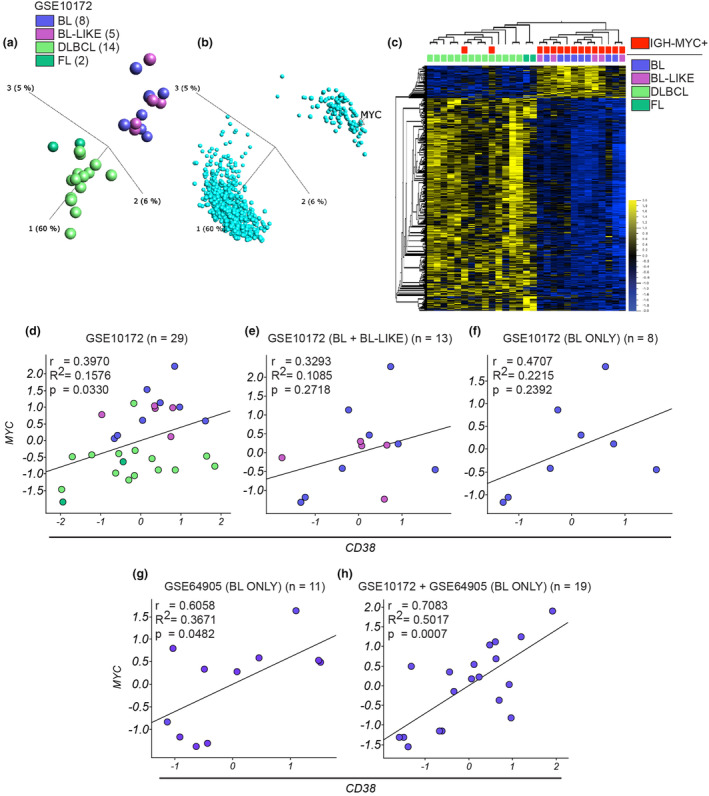
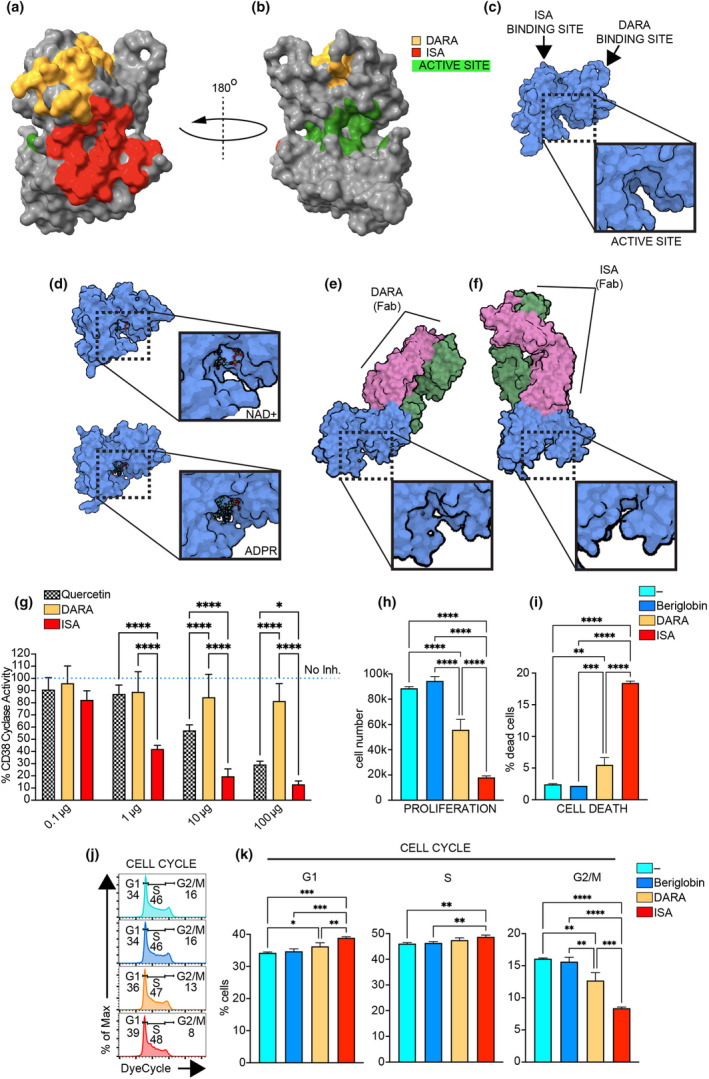
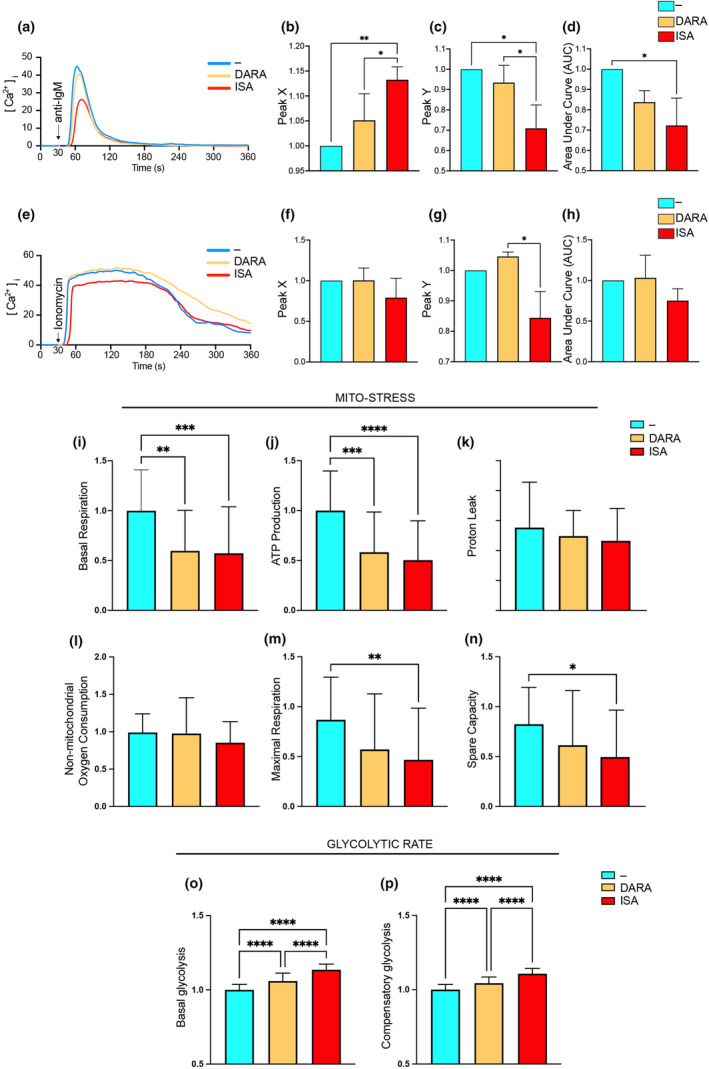
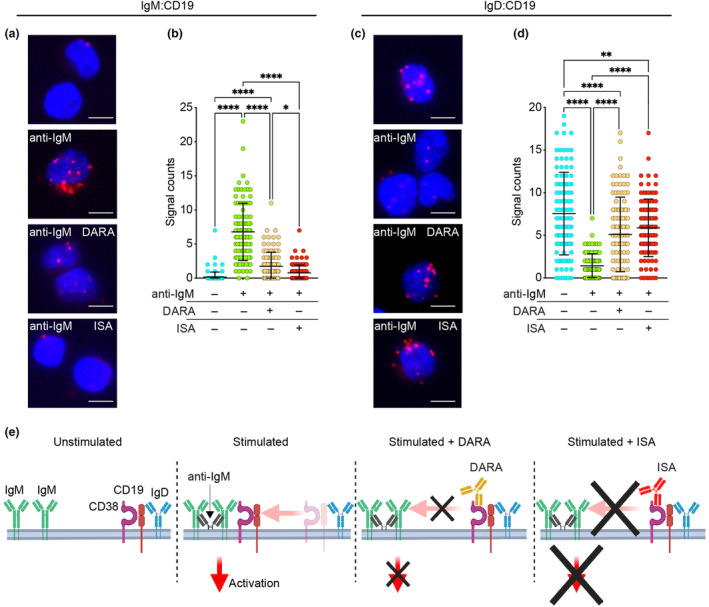
Results: Isatuximab was found to be more effective than daratumumab in disrupting B-cell receptor signalling, reducing cellular proliferation and inducing apoptosis. Additionally, isatuximab caused a significant impairment of the PI3K pathway and induced metabolic reprogramming in pBL cells. The study also revealed a correlation between CD38 and MYC expression levels in pBL patient samples, suggesting CD38 involvement in key oncogenic processes.

Conclusion: The study emphasises the therapeutic potential of CD38-targeting mAbs, particularly isatuximab, in pBL.

Keywords: CD38‐targeting monoclonal antibodies; chemotherapy resistance; daratumumab; immunotherapy; isatuximab; paediatric Burkitt's lymphoma.


Conflict of interest statement

The authors declare that the research was conducted in the absence of any commercial or financial relationships that could be considered as a potential conflict of interest. Cartoon figures were created with Biorender.com.

Figures

Figure 1
Figure 1
Correlation analysis of CD38 and MYC gene expression in pBL patient samples. (a) Unsupervised PCA analysis shows the cluster pattern of the 29 paediatric lymphoma samples (GSE10172) based on significantly differentially expressed genes among these samples (1800 genes, one‐way ANOVA with the post hoc Tukey test P = 0.01); the colour key for disease subtypes in this panel is consistent with those used in the following panels of this figure. (b) PCA chart shows the distribution of the significantly differentially expressed genes that lead to the samples clustering in a. (c) Heatmap shows the 1800 significantly differentially expressed genes and the hierarchical distribution of the samples reflecting the clustering in a. The disease subtype and absence/presence of the IgH‐MYC translocation related to these samples are also reported. Correlation analysis for MYC and CD38 gene expression was performed on the samples contained in the dataset GSE10172 and Pearson's correlation coefficient (r), coefficient of determination (R 2) and P‐value were calculated for (d) the whole 29 samples contained in the data set, (e) only for BL and BL‐like samples, (h) only for BL samples. (g) Same analysis as in (d–f) but on 11 pBL samples contained in the GSE64905 dataset. (h) Same analysis as in (d–g) but on 19 pBL samples contained in GSE10172 and GSE64905 data sets. Here, the data sets were merged and normalised using the Z‐score normalisation method.
Figure 2
Figure 2
DARA and ISA differential interaction with CD38's structure and its cyclase activity and impact on pBL cell proliferation, apoptosis and cell cycle. (a, b) The extracellular domain's structure of CD38 from two perspectives (top and 180° rotated bottom view, respectively), highlighting the epitopes recognised by DARA and ISA and the active site's location. (c) The crystal structure of the unbound CD38 ectodomain (PDB entry: 1YH3), showing the accessible active site. Arrows indicate the predicted binding sites for DARA and ISA. The dashed box indicates active site. A zoomed‐in view of the active site is provided in the adjacent box. (d) The crystal structure of CD38's ectodomain complexed with NAD+ (upper panel) and ADPR (lower panel) in its active site (PDB entries: 3OFS and 8P8C respectively). The dashed box indicates active site, NAD+ and ADPR. A zoomed‐in view of the active site is provided in the adjacent box. (e, f) The conformational changes of CD38 when bound to the Fab region of DARA (PDB entry: 7DHA) and ISA (PDB entry: 4CMH), respectively. Dashed boxes indicate the active site. A zoomed‐in view of the active site is provided in the adjacent boxes. (g) Concentration‐dependent inhibition of CD38 cyclase activity by DARA, ISA and quercetin, a CD38 cyclase inhibitor. The assay was performed on recombinant CD38 protein, with untreated controls (represented by the blue dotted line, No inh.) set as 100%. (h, i) The cell number and % of dead cells (7AAD+) analysis in Ramos cells after a 4‐day culture period, comparing untreated (−) to treated with DARA, ISA or beriglobin control. (j) Cell cycle stages in Ramos cells stained with Vibrant DyeCycle in the same experimental setup as (h, i). (k) % of cells in G1, S and G2/M phase. Statistical significance was calculated with one‐way ANOVA with the post hoc Tukey test and denoted as *P < 0.05; **P < 0.01; ***P < 0.001; ****P < 0.0001. Data are presented as mean ± SD. Non‐significance is not indicated in the figure. Data in (g) are from two independent experiments with n = 3 replicates each, with results normalised and combined. Data in (h–k) are representative of one experiment with n = 3 replicates. Independent experiments were repeated at least twice.
Figure 3
Figure 3
DARA and ISA impact on intracellular Ca2+ signalling and metabolic changes in pBL cells. (a) Transient rise in [Ca2+]i over time in Ramos cells, untreated (−) or treated with DARA or ISA, following stimulation with anti‐IgM, F(ab')2. The curves illustrate the temporal dynamics of [Ca2+]i. (b) Peak X indicates the time (seconds, s) to reach maximum [Ca2+]i, (c) Peak Y the maximum [Ca2+]i achieved and (d) the Area Under Curve (AUC) the total Ca2+ released. (e) Transient rise in [Ca2+]i over time in Ramos cells, untreated (−) or treated with DARA or ISA, following stimulation with ionomycin. The curves illustrate the temporal dynamics of [Ca2+]i. (f) Peak X indicates the time (seconds, s) to reach maximum [Ca2+]i, (g) Peak Y the maximum [Ca2+]i achieved and (h) the Area Under Curve (AUC) the total Ca2+ released. (i–p) Ramos cells, untreated (−) or treated with DARA or ISA for 1 h were assessed for metabolic changes involving mitochondrial respiration (Mito‐stress) and glycolysis (Glycolytic rate). (i) Basal respiration rates and (j) ATP production. (k, l) Proton leak and non‐mitochondrial oxygen consumption, respectively. The maximal respiration rate and spare respiratory capacity were depicted in m and n. Glycolytic function is assessed in (o) and (p) where basal and compensatory glycolysis levels were shown. Statistical significance was calculated with one‐way ANOVA with the post hoc Tukey test and denoted as *P < 0.05; **P < 0.01; ***P < 0.001; ****P < 0.0001. Data are presented as mean ± SD. Non‐significance is not indicated in the figure. (a–n) Data presented are from three independent experiments, with results normalised and combined. (o, p) Data presented are from two independent experiments, with results normalised and combined.
Figure 4
Figure 4
Comparative efficacy of DARA and ISA on modulating IgM:CD19 and IgD:CD19 interactions. (a) Fab‐PLA study of the proximity of IgM to CD19 on Ramos cells unstimulated or 5‐min anti‐IgM–stimulated without and with exposure to DARA or ISA (top to bottom). PLA signals are shown in red and nuclei in blue. Scale bar, 5 μm. (b) Scatter dot plot represents the mean of PLA signals for IgM:CD19 interaction (signal counts). (c) Fab‐PLA study of the proximity of IgD to CD19 on Ramos cells unstimulated or 5‐min anti‐IgM–stimulated without and with exposure to DARA or ISA (top to bottom). PLA signals are shown in red and nuclei in blue. Scale bar, 5 μm. (d) Scatter dot plot represents the mean of PLA signals for IgD:CD19 interaction (signal counts). Shown are representative microscope images (a, c). Statistical significance in this figure was calculated with one‐way ANOVA with the post hoc Tukey test and denoted as *P < 0.05; **P < 0.01; ****P < 0.0001. Non‐significance is not indicated in the figure. Independent experiments were repeated twice. In these graphs, every data point is one cell; error bars show mean ± SD. (e) Schematic representation of IgM and IgD interactions with CD19 and CD38 upon BCR activation, detailing the distinct inhibitory impacts of DARA and ISA.
Figure 5
Figure 5
Anti‐CD38 mAbs impair PI3K pathway signalling in pBL cells. (a, b) Time‐course analysis of SYK phosphorylation levels post anti‐CD38 mAb treatment over 24 h. (c) Comparative kinetic analysis of SYK dephosphorylation between DARA and ISA‐treated cells. (d, e) The phosphorylation status of AKT over a 24‐h period post anti‐CD38 mAb treatment. (f) Differential analysis of pAKT level kinetics between DARA and ISA treatments. Statistical significance was assessed using one‐way ANOVA with the post hoc Tukey test comparing untreated vs treated, indicated by: *P < 0.05; **P < 0.01; ***P < 0.001. In (c) and (f), the statistical significance was assessed using the unpaired t‐test for the comparison between DARA vs ISA in each time point and the paired t‐test for the comparison of the whole kinetic, and indicated by *P < 0.05; ***P < 0.001. Data are presented as mean ± SD. Non‐significance is not denoted. Data are representative of two independent experiments. All results were normalised and merged for consistent interpretation. (g) Schematic representation of the proposed effect of anti‐CD38 mAb (ISA) treatment on MYC/PI3K pathways and consequences on the proliferation/apoptosis balance.

Similar articles

References

    1. Gallamini A, Juweid M. Lymphoma [Internet]. Brisbane (AU): Exon Publications; 2021 Dec 28. PMID: 35226427. - PubMed
    1. López C, Burkhardt B, Chan JKC et al. Burkitt lymphoma. Nat Rev Dis Primers 2022; 8: 78. - PubMed
    1. Küppers R, Dalla‐Favera R. Mechanisms of chromosomal translocations in B cell lymphomas. Oncogene 2001; 20: 5580–5594. - PubMed
    1. Dalla‐Favera R, Bregni M, Erikson J, Patterson D, Gallo RC, Croce CM. Human c‐myc onc gene is located on the region of chromosome 8 that is translocated in Burkitt lymphoma cells. Proc Natl Acad Sci USA 1982; 79: 7824–7827. - PMC - PubMed
    1. Bras AE, Beishuizen A, Langerak AW et al. CD38 expression in paediatric leukaemia and lymphoma: Implications for antibody targeted therapy. Br J Haematol 2018; 180: 292–296. - PubMed

LinkOut - more resources