. 2024 Oct 3;13(10):e70008.
doi: 10.1002/cti2.70008. eCollection 2024.

Humoral and cellular immune responses in vaccinated and unvaccinated children following SARS-CoV-2 Omicron infection

Affiliations

Humoral and cellular immune responses in vaccinated and unvaccinated children following SARS-CoV-2 Omicron infection

Zheng Quan Toh et al. Clin Transl Immunology. .

Abstract

Objectives: The immune response in children elicited by SARS-CoV-2 Omicron infection alone or in combination with COVID-19 vaccination (hybrid immunity) is poorly understood. We examined the humoral and cellular immune response following SARS-CoV-2 Omicron infection in unvaccinated children and children who were previously vaccinated with COVID-19 mRNA vaccine.

Methods: Participants were recruited as part of a household cohort study conducted during the Omicron predominant wave (Jan to July 2022) in Victoria, Australia. Blood samples were collected at 1, 3, 6 and 12 months following COVID-19 diagnosis. Humoral immune responses to SARS-CoV-2 Spike proteins from Wuhan, Omicron BA.1, BA.4/5 and JN.1, as well as cellular immune responses to Wuhan and BA.1 were assessed.

Results: A total of 43 children and 113 samples were included in the analysis. Following Omicron infection, unvaccinated children generated low antibody responses but elicited Spike-specific CD4 and CD8 T-cell responses. In contrast, vaccinated children infected with the Omicron variant mounted robust humoral and cellular immune responses to both ancestral strain and Omicron subvariants. Hybrid immunity persisted for at least 6 months post infection, with cellular immune memory characterised by the generation of Spike-specific polyfunctional CD8 T-cell responses.

Conclusion: SARS-CoV-2 hybrid immunity in children is characterised by persisting SARS-CoV-2 antibodies and robust CD4 and CD8 T-cell activation and polyfunctional responses. Our findings contribute to understanding hybrid immunity in children and may have implications regarding COVID-19 vaccination and SARS-CoV-2 re-infections.

Keywords: SARS‐CoV‐2; cellular immune responses; children; hybrid immunity.


Conflict of interest statement

NWC received funding from the National Institute of Health for influenza and COVID‐19 research. All other authors declare no conflict of interest.

Figures
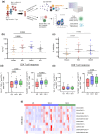
Figure 1
Figure 1
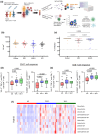
SARS‐CoV‐2 humoral and cellular immune responses in unvaccinated children at 1 month post Omicron infection. (a) Blood samples collected 28 days post infection were used to measure SARS‐CoV‐2 humoral (IgG and surrogate neutralising antibodies; NAb) (N = 17) and cellular immune response (via AIM and ICS expression following stimulation with the overlapping peptide pools of the Wuhan (WA.1) or omicron BA.1 full‐length spike) (N = 16). (b) SARS‐CoV‐2 IgG concentration against WA.1 (orange), omicron BA.1 (red), BA.4/5 (blue) and JN.1 (black) measured by ELISA. (c) SARS‐CoV‐2 neutralising antibody response (% inhibition) against WA.1, omicron BA.1 and BA.4/5 measured by surrogate virus neutralisation test. (d) CD4 and (e) CD8 Spike‐specific T cell response characterised by polyfunctionality (%IL‐2+, TNF‐α+ and IFNγ+) or expression of activation‐induced markers (%CD69+, OX‐40+ and CD137+) following WA.1 or BA.1 stimulation. (f) Heatmap of each activation marker and in combination following WA.1 or BA.1 stimulation. IgG data are presented as assay units (AU mL−1) and surrogate neutralising antibody data are presented as percent inhibition (%inhibition). IgG binding antibody units against WA.1, BA.1 and BA.4/5 are available in Supplementary figure 1. Error bars represent geometric mean concentrations ± 95% CI and median with interquartile range for IgG and surrogate neutralising antibody data, respectively. A Friedman's test was used to compare the different variants. T‐cell data are presented as a boxplot (median, min–max and outliers shown as dots). A Friedman's test with a Benjamini–Hochberg post‐hoc adjustment was used to compare between unstimulated and stimulated conditions. An adjusted P‐value < 0.05 was considered significant.
Figure 2
Figure 2
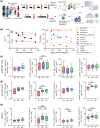
SARS‐CoV‐2 humoral and cellular immune responses in previously vaccinated children at 1 month post Omicron infection. (a) Blood samples collected 28 days post infection were used to measure SARS‐CoV‐2 humoral (IgG and surrogate neutralising antibodies; NAb) (N = 26) and cellular immune response (via AIM and ICS expression following stimulation with the overlapping peptide pools of the Wuhan (WA.1) or omicron BA.1 full‐length spike) (N = 23). (b) SARS‐CoV‐2 IgG concentration against WA.1 (orange), omicron BA.1 (red), BA.4/5 (blue) and JN.1 (black) measured by ELISA. (c) SARS‐CoV‐2 neutralising antibody response (% inhibition) against WA.1, omicron BA.1 and BA.4/5 measured by surrogate virus neutralisation test. (d) CD4 and (e) CD8 Spike‐specific T cell response characterised by polyfunctionality (%IL‐2+, TNF‐α+ and IFNγ+) or expression of activation‐induced markers (%CD69+, OX‐40+ and CD137+) following WA.1 or BA.1 stimulation. (f) Heatmap of each activation marker and in combination following WA.1 or BA.1 stimulation. IgG data are presented as assay units (AU mL−1) and surrogate neutralising antibody data are presented as percent inhibition (%inhibition). IgG binding antibody units against WA.1, BA.1 and BA.4/5 are available in Supplementary figure 1. Error bars represent geometric mean ± 95% CI and median with interquartile range for IgG and surrogate neutralising antibody data, respectively. A Friedman's test was used to compare the antibody response across different variants. T‐cell data are presented as a boxplot (median, min–max and outliers shown as dots). A Friedman's test with a Benjamini–Hochberg post hoc adjustment was used to compare between unstimulated and stimulated conditions. An adjusted P‐value < 0.05 was considered significant.
Figure 3
Figure 3
SARS‐CoV‐2 humoral and cellular immune responses in previously vaccinated children at 1 month post Omicron infection stratified by vaccine doses. Blood samples collected 28 days post infection were used to measure SARS‐CoV‐2 humoral (IgG and surrogate neutralising antibodies; NAb) (N = 26; N = 18 vaccinated with two/three dose and N = 8 vaccinated with one dose) and cellular immune response (via AIM and ICS expression following stimulation with the overlapping peptide pools of the Wuhan (WA.1) or omicron BA.1 full‐length spike) (N = 23; N = 17 vaccinated with two/three dose and N = 6 vaccinated with one dose). (a) SARS‐CoV‐2 IgG concentration and surrogate neutralising antibody response (% inhibition) against WA.1 (orange), omicron BA.1 (red), BA.4/5 (blue) and JN.1 (black) by vaccine doses (N = 18 vaccinated with two/three dose; closed symbols and N = 8 vaccinated with one dose; open symbols) (b) CD4 and (c) CD8 Spike‐specific T‐cell response by vaccine dose, characterised by polyfunctionality (%IL‐2+, TNF‐α+ and IFNγ+) or expression of activation‐induced markers (%CD69+, OX‐40+ and CD137+) following WA.1 or BA.1 stimulation. (d) Heatmap of each activation marker and in combination following WA.1 or BA.1 stimulation by vaccine dose. IgG data are presented as assay units (AU mL−1) and surrogate neutralising antibody data are presented as percent inhibition (%inhibition). Error bars represent geometric mean ± 95% CI and median with interquartile range for IgG and neutralising antibody data, respectively. A Mann–Whitney U‐test was used to compare antibody response between one‐dose and two‐/three‐dose group. T‐cell data are presented as a boxplot (median, min–max and outliers shown as dots). A Friedman's test with a Benjamini–Hochberg post hoc adjustment was used to compare between unstimulated and stimulated conditions. An adjusted P‐value < 0.05 was considered significant.
Figure 4
Figure 4
Persistence of immunity in vaccinated children with or without Omicron infection, and unvaccinated children with Omicron infection. (a) Children were followed up for 12 months with humoral responses measured at 1 month (Hybrid: N = 18; Infection only: N = 17), 3 months (Hybrid: N = 12; Infection only: N = 12), 6 months (Hybrid: N = 13; Infection only: N = 9) and 12 months (Hybrid: N = 3; Infection only: N = 3) post‐infection, while cellular immune response was measured at 1 month (Hybrid: N = 17; Infection only: N = 16) and 6 months post infection (Hybrid: N = 17; Infection only: N = 9) where samples were available. Vaccine‐only children had samples taken at 4 months post vaccination (N = 7 and N = 5 for humoral and cellular immune response, respectively) and was followed up for a further 6 months (N = 4). (b) SARS‐CoV‐2 IgG kinetics and surrogate neutralising antibody kinetics measured against ancestral (WA.1) (closed circle), omicron BA.1 (open triangle), BA.4/5 (half‐closed square) and JN.1 (open diamond; *IgG only); Blue symbols and lines: children vaccinated with two/three doses with omicron infection; red symbols and lines: unvaccinated children with Omicron infection; black symbols and lines: vaccinated children. Data points are presented as medians. (%IL‐2+, TNF‐α+ and IFNγ+) or expression of activation‐induced markers (%CD69+, OX‐40+ and CD137+) following WA.1 or BA.1 stimulation among (c) infection only group, (d) Vaccine‐only group and (e) Hybrid group. T cell data are presented as a boxplot (median, min–max and outliers shown as dots). A Friedman's test with a Benjamini–Hochberg post hoc adjustment was used to compare between unstimulated and stimulated conditions. An adjusted P‐value < 0.05 was considered significant.

Similar articles

Cited by

References

    1. Alteri C, Scutari R, Costabile V et al. Epidemiological characterization of SARS‐CoV‐2 variants in children over the four COVID‐19 waves and correlation with clinical presentation. Sci Rep 2022; 12: 10194. - PMC - PubMed
    1. Nathanielsz J, Toh ZQ, Do LAH, Mulholland K, Licciardi PV. SARS‐CoV‐2 infection in children and implications for vaccination. Pediatr Res 2023; 93: 1177–1187. - PMC - PubMed
    1. Zimmermann P, Curtis N. Why does the severity of COVID‐19 differ with age?: Understanding the mechanisms underlying the age gradient in outcome following SARS‐CoV‐2 infection. Pediatr Infect Dis J 2022; 41: e36–e45. - PMC - PubMed
    1. Ahmed M, Advani S, Moreira A et al. Multisystem inflammatory syndrome in children: A systematic review. EClinicalMedicine 2020; 26: 100527. - PMC - PubMed
    1. Ward JL, Harwood R, Kenny S et al. Pediatric hospitalizations and ICU admissions due to COVID‐19 and pediatric inflammatory multisystem syndrome temporally associated with SARS‐CoV‐2 in England. JAMA Pediatr 2023; 177: 947–955. - PMC - PubMed

LinkOut - more resources