. 2024 Sep 19:15:1448752.
doi: 10.3389/fimmu.2024.1448752. eCollection 2024.

High specificity of engineered T cells with third generation CAR (CD28-4-1BB-CD3-ζ) based on biotin-bound monomeric streptavidin for potential tumor immunotherapy

Affiliations

High specificity of engineered T cells with third generation CAR (CD28-4-1BB-CD3-ζ) based on biotin-bound monomeric streptavidin for potential tumor immunotherapy

Jorge Gallego-Valle et al. Front Immunol. .

Abstract

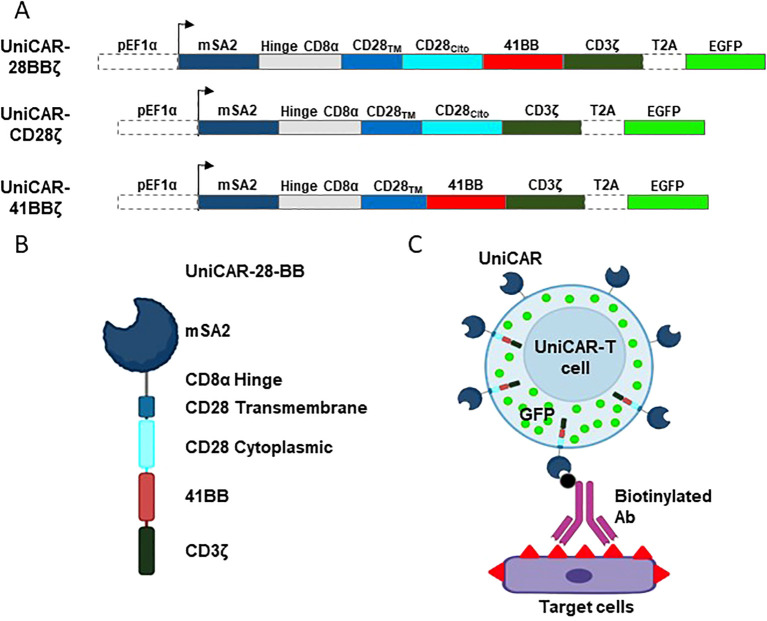
Introduction: Immunotherapy has revolutionized cancer treatment, and Chimeric Antigen Receptor T cell therapy (CAR-T) is a groundbreaking approach. Traditional second-generation CAR-T therapies have achieved remarkable success in hematological malignancies, but there is still room for improvement, particularly in developing new targeting strategies. To address this limitation, engineering T cells with multi-target universal CARs (UniCARs) based on monomeric streptavidin has emerged as a versatile approach in the field of anti-tumor immunotherapy. However, no studies have been conducted on the importance of the intracellular signaling domains of such CARs and their impact on efficiency and specificity.

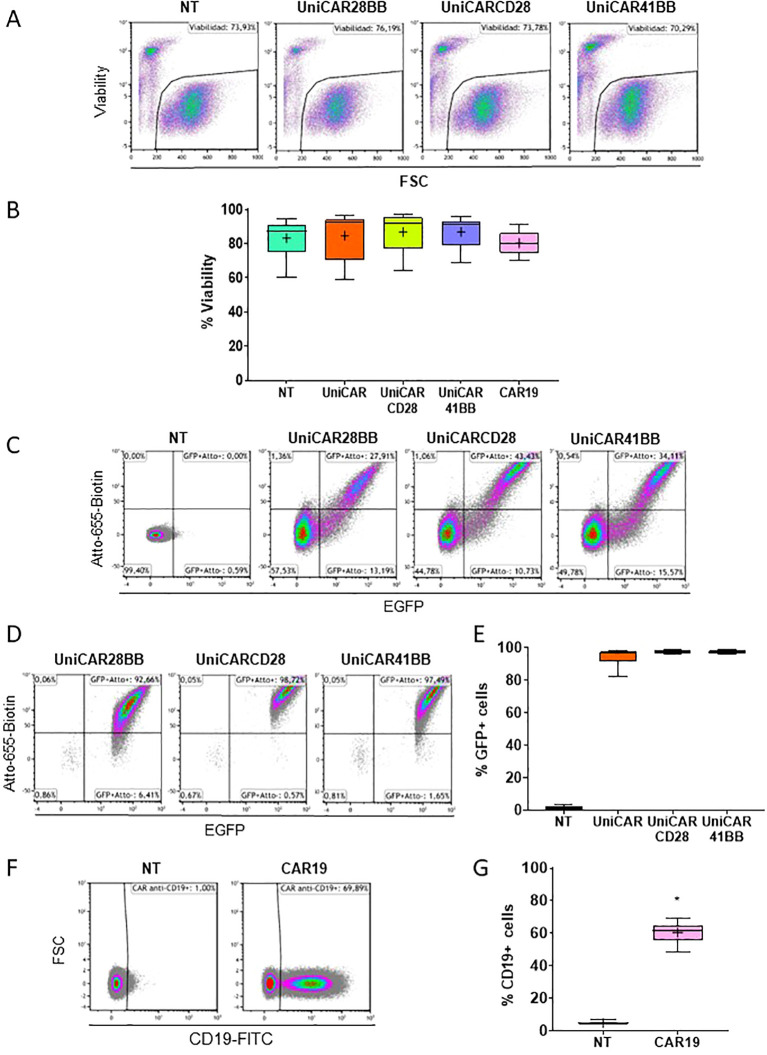
Method: Here, we developed second-generation and third-generation UniCARs based on an extracellular domain comprising an affinity-enhanced monomeric streptavidin, in addition to CD28 and 4-1BB co-stimulatory intracellular domains. These UniCAR structures rely on a biotinylated intermediary, such as an antibody, for recognizing target antigens. In co-culture assays, we performed a functional comparison between the third-generation UniCAR construct and two second-generation UniCAR variants, each incorporating either the CD28 or 4-1BB as co-stimulatory domain.

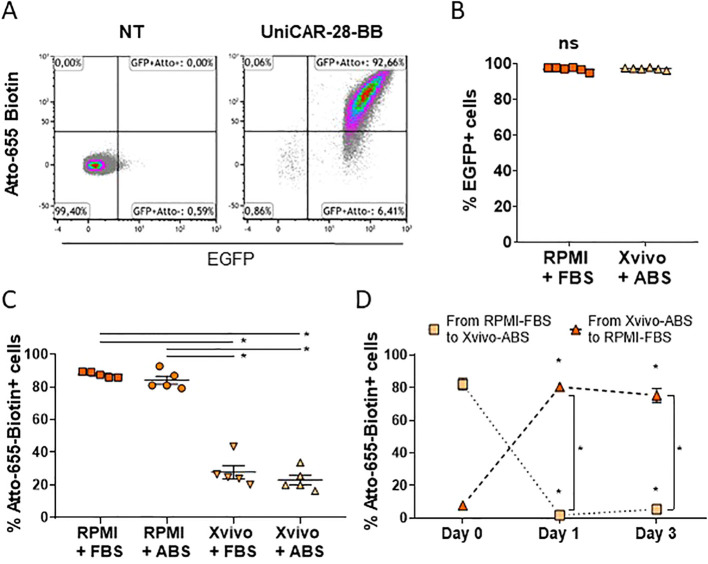
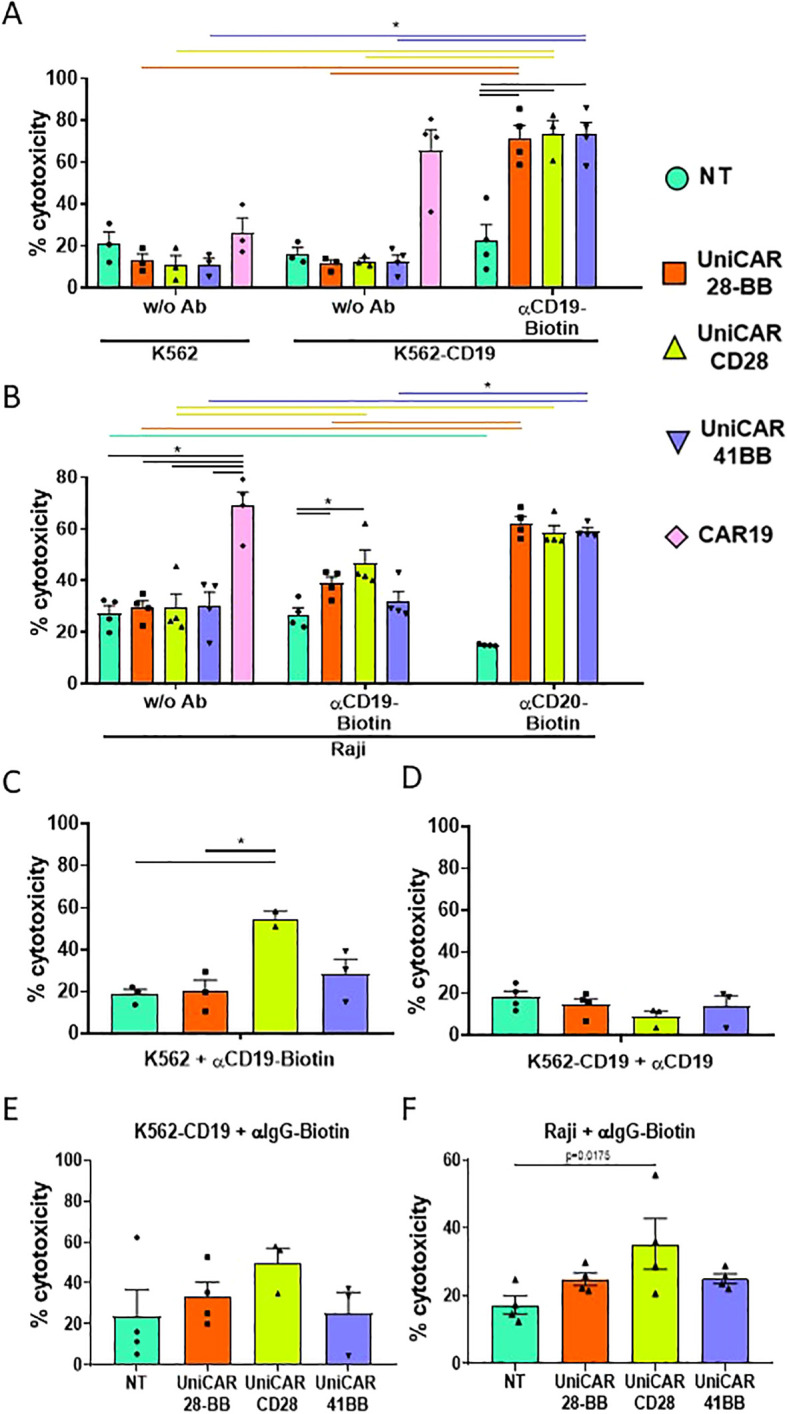
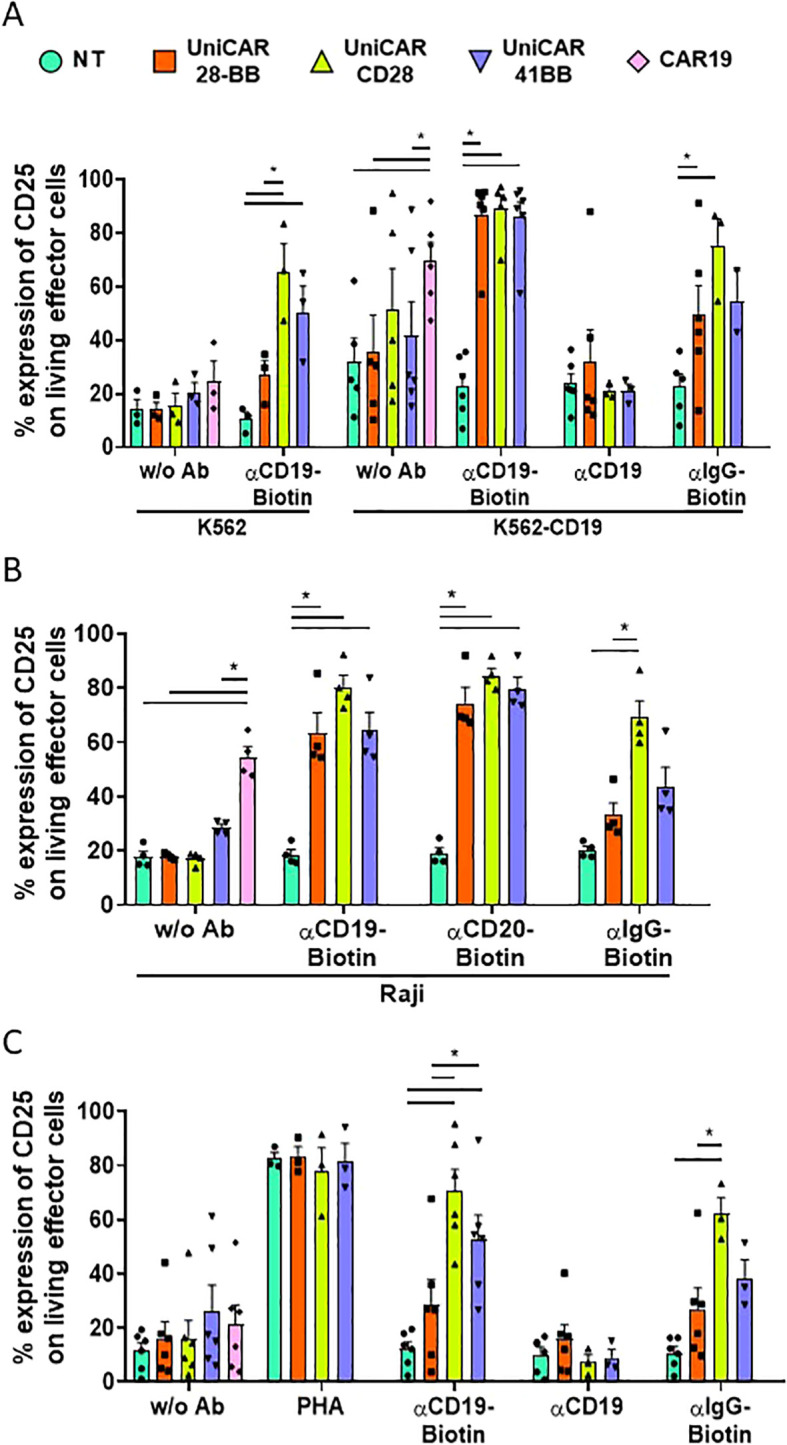
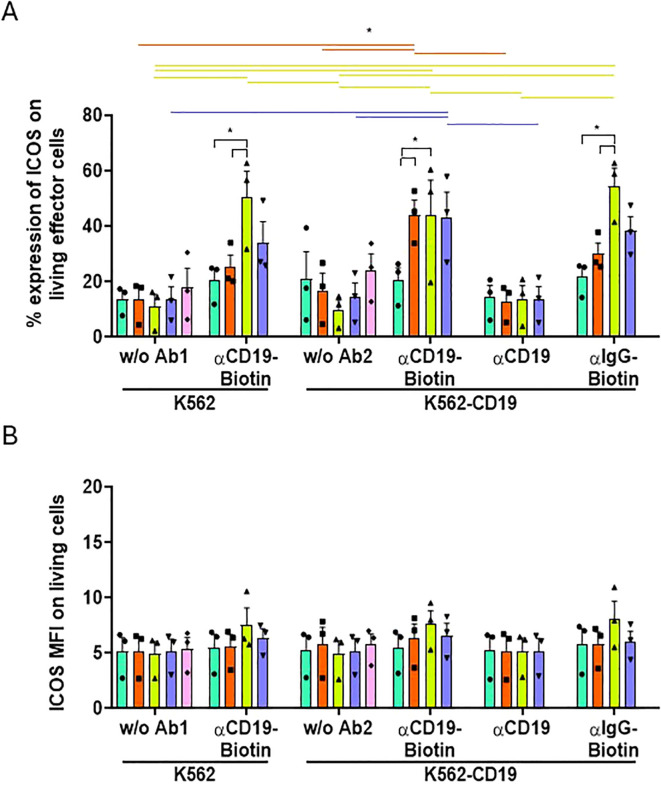
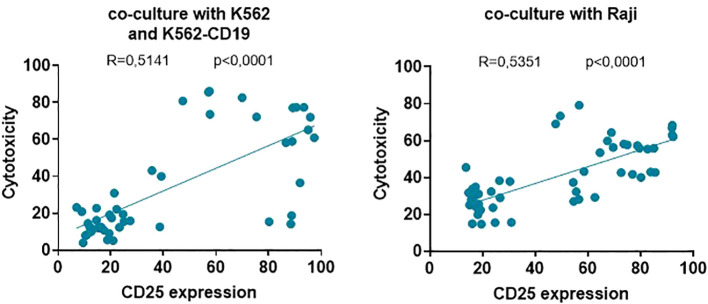
Results: We observed that components in culture media could inhibit the binding of biotinylated antibodies to monomeric streptavidin-CARs, potentially compromising their efficacy. Furthermore, third-generation UniCAR-T cells showed robust cytolytic activity against cancer cell lines upon exposure to specific biotinylated antibodies like anti-CD19 and anti-CD20, underscoring their capability for multi-targeting. Importantly, when assessing engineered UniCAR-T cell activation upon encountering their target cells, third-generation UniCAR-T cells exhibited significantly enhanced specificity compared to second-generation CAR-T cells.

Discussion: First, optimizing culture conditions would be essential before deploying UniCAR-T cells clinically. Moreover, we propose that third-generation UniCAR-T cells are excellent candidates for preclinical research due to their high specificity and multi-target anti-tumor cytotoxicity.

Keywords: Chimeric Antigen Receptor; Treg; engineered cells; immunosuppression; streptavidin-based CAR.


Conflict of interest statement

The authors declare that the research was conducted in the absence of any commercial or financial relationships that could be construed as a potential conflict of interest. The author(s) declared that they were an editorial board member of Frontiers, at the time of submission. This had no impact on the peer review process and the final decision.

Figures

Figure 1
Figure 1
Schematic design of the vectors, UniCARs and their recognition system. (A) Design of the lentiviral expression construct encoding the 3rd generation UniCAR-28-BB, both 2nd generation UniCARCD28 and UniCAR41BB, and the eGFP. (B) Representation of the extracellular, transmembrane and intracellular elements that compose the 3rd generation UniCAR-28-BB. (C) Representation of a transduced cell expressing eGFP (green dots) and 3rd generation UniCAR-28-BB, which is able to recognize and bind to a biotinylated intermediate, such as a biotinylated monoclonal antibody. The biotinylated intermediate recognizes the antigens at the surface of the target cell. Figure created with BioRender.
Figure 2
Figure 2
Components of culture media can neutralize the binding capacity of UniCAR to biotin. (A) Flow cytometry dot plots depicting non-transduced (NT) and transduced Jurkat cells with lentivectors encoding 3rd generation UniCAR-28-BB. Cells cultured in RPMI 1640 + 10% FBS were labeled with Atto-655 and followed by eGFP expression. These dot plots serve as a representative example from n=11. (B) Graph illustrating eGFP expression in UniCAR-28-BB Jurkat cells cultured in RPMI 1640 + 10% FBS and in Xvivo15 + 5% ABS, along with their mean + SEM. Ns= non-significant difference as determined by the Mann-Whitney comparison test. (C) Graph depicting the frequencies of Atto-655-Biotin-labeled UniCAR-28-BB-Jurkat cells when cultured in RPMI 1640 + 10% FBS or + 5% ABS and in Xvivo15 + 10% FBS or + 5% ABS, with their mean ± SEM. *Significant difference between conditions with p<0.05, as determined by the one-factor ANOVA multiple comparisons test. (D) Graph depicting the change in frequencies of Atto-655-Biotin-labeled UniCAR-28-BB Jurkat cells which had been cultured in RPMI 1640 + 10% FBS and moved to Xvivo15 + 10% FBS or had been cultured in Xvivo15 + 10% FBS and moved to RPMI 1640 + 10% FBS, with their mean ± SEM. *Significant difference between conditions with p<0.05, as determined by the 2way ANOVA multiple comparisons test.
Figure 3
Figure 3
Viability and frequency of effector T cell transduction. (A) Flow cytometry dot plots representing the viability (visualized by the 7AAD negative signal) of Non-transduced (NT), UniCAR-28-BB, UniCARCD28, UniCAR41BB and CAR19 transduced T cells. These dot plots are a representative example of n=6. (B) Box and whiskers representing the frequency of viability of NT, UniCAR-28-BB, UniCARCD28, UniCAR41BB and CAR19 T cells, n=6. (C) Flow cytometry dot plots representing the frequencies of the eGFP and Atto-655 detection of NT, UniCAR-28-BB, UniCARCD28, and UniCAR41BB T cells before sorting. (D) Flow cytometry dot plots representing the frequencies of the eGFP and Atto-655 detection on NT, UniCAR-28-BB, UniCARCD28, and UniCAR41BB T cells after sorting. These dot plots are a representative example of n=6. (E) Box and whiskers representing the frequency of eGFP expression on NT, UniCAR-28-BB, UniCARCD28, and UniCAR41BB T cells, n=6. (F) Flow cytometry dot plots representing the frequency of CD19-FITC expression on NT and CAR19 T cells. These dot plots are a representative example of n=6. (G) Box and whiskers (10-90 percentile, the + symbol is the mean) representing the frequency expression of CD19-FITC on NT and CAR19 T cells, n=6.
Figure 4
Figure 4
Cytotoxicity assay on target cell lines. (A) Histogram representing the frequencies of cell death (referred to as cytotoxicity, mean ± SEM) of CTVio+ K562 and K562-CD19 cells after 72 h of co-culture with Non-transduced T (NT), UniCAR-28-BB, UniCARCD28, UniCAR41BB and CAR19 T cells, both in the absence of intermediate antibody (w/o Ab) or with biotinylated αCD19 Ab. Significant differences were determined using a 2way ANOVA multiple comparisons, corrected with the Tukey’s test. (B) Histogram representing the cytotoxicity of CTVio+ Raji cells after 72 h of co-culture with NT, UniCAR-28-BB, UniCARCD28, UniCAR41BB and CAR19 T cells, in absence of intermediate antibody, with biotinylated αCD19 Ab, or with biotinylated αCD20 Ab (mean ± SEM). Significant differences were determined using a 2way ANOVA multiple comparisons, corrected with the Dunn’s test. (C) Histogram representing the frequencies of cell death (mean ± SEM) of CTVio+ K562 cells (which do not express CD19) after 72 h of co-culture with NT, UniCAR-28-BB, UniCARCD28, UniCAR41BB and CAR19 T cells, stimulated with biotinylated αCD19 Ab. Significant differences were determined using a 1way ANOVA multiple comparisons (Kruskal-Wallis’s test). (D) Histogram representing the frequencies of cell death (mean ± SEM) of CTVio+ K562-CD19 cells after 72 h of co-culture with NT, UniCAR-28-BB, UniCARCD28, UniCAR41BB and CAR19 T cells, stimulated with the non-biotinylated αCD19 Ab. Significant differences were determined using a 1way ANOVA multiple comparisons (Kruskal-Wallis’s test). (E) Histogram representing the frequencies of cell death (mean ± SEM) of CTVio+ K562-CD19 cells after 72 h of co-culture with NT, UniCAR-28-BB, UniCARCD28, UniCAR41BB and CAR19 T cells, stimulated with the non-specific biotinylated αIgG Ab. Significant differences were determined using a 1way ANOVA multiple comparisons (Kruskal-Wallis’s test). (F) Histogram representing the frequencies of cell death (mean ± SEM) of CTVio+ Raji cells after 72 h of co-culture with NT, UniCAR-28-BB, UniCARCD28, UniCAR41BB and CAR19 T cells, stimulated with the non-specific biotinylated αIgG Ab. Significant differences were determined using a 1way ANOVA multiple comparisons (Kruskal-Wallis’s test). All co-culture conditions were performed with a ratio 1:1 (effector T cell: Target cell). Each data point represents one experiment. *: Significant differences between indicated conditions are depicted by black lines, and significant differences inter-conditions are indicated by colored lines which correspond to the histogram’s color code. Inter-conditions statistics for (C–F) were depicted on Supplementary Figure S4 . Significant differences when p<0.05.
Figure 5
Figure 5
Activation of effector T cell subsets measured by CD25 expression. (A) Histogram representing the frequencies of CD25+ cells on NT, UniCAR-28-BB, UniCARCD28, UniCAR41BB and CAR19 T cells (gated on living cells, mean ± SEM) after 72 h of co-culture with CTVio+ K562 and CTVio+ K562-CD19 cells, in the absence of antibody intermediate, or with biotinylated αCD19 Ab, non-biotinylated αCD19 Ab or with biotinylated IgG. *Significant differences between indicated conditions. Inter-conditions statistics for (A) were depicted on Supplementary Figure S6A . (B) Histogram representing the frequencies of CD25+ cells on NT, UniCAR-28-BB, UniCARCD28, UniCAR41BB and CAR19 T cells (gated on living cells, mean ± SEM) after 72 h of co-culture with CTVio+ Raji cells, in the absence of intermediate antibody, or with biotinylated αCD19 Ab, biotinylated αCD20 Ab or with biotinylated IgG. *Significant differences between indicated conditions. Inter-conditions statistics for (B) were depicted on Supplementary Figure S6B . (C) Histogram representing the frequencies of CD25+ cells on NT, UniCAR-28-BB, UniCARCD28, UniCAR41BB and CAR19 T cells (gated on living cells, mean ± SEM) after 72 h of culture alone in the absence of intermediate antibody, or with PHA, biotinylated αCD19 Ab, biotinylated αCD20 Ab or biotinylated IgG. *Significant differences between indicated conditions. Inter-conditions statistics for (C) were depicted on Supplementary Figure S6C . Significant differences when p<0.05, as determined by the by 2way ANOVA multiple comparisons test, corrected with the Tukey’s test. All co-culture conditions were performed with a ratio 1:1 (effector T cell: Target cell). Each data point represents one experiment.
Figure 6
Figure 6
Activation of effector T cell subsets measured by ICOS expression. (A) Histogram representing the frequencies of ICOS+ cells on NT, UniCAR-28-BB, UniCARCD28, UniCAR41BB and CAR19 T cells (gated on living cells, mean ± SEM) after 72 h of co-culture with CTVio+ K562 and CTVio+ K562-CD19 cells, in the absence of antibody intermediate, or with biotinylated αCD19 Ab, non-biotinylated αCD19 Ab or with biotinylated IgG. *: Significant differences between indicated conditions are depicted by black brackets, and significant differences inter-conditions are indicated by colored lines which correspond to the histogram’s color code. (B) Histogram representing the Mean of Fluorescent Intensity (MFI) of ICOS+ cells on NT, UniCAR-28-BB, UniCARCD28, UniCAR41BB and CAR19 T cells (gated on living cells, mean ± SEM) after 72 h of co-culture with CTVio+ K562 and CTVio+ K562-CD19 cells, in the absence of antibody intermediate, or with biotinylated αCD19 Ab, non-biotinylated αCD19 Ab or with biotinylated IgG. Significant differences when p<0.05, as determined by the by 2way ANOVA multiple comparisons test, corrected with the Tukey’s test. All co-culture conditions were performed with a ratio 1:1 (effector T cell: Target cell). Each data point represents one experiment.
Figure 7
Figure 7
Correlations between effector T cell activation and cytotoxicity of target cell lines. Correlations and linear regression between the frequency of effector T cells positive for the CD25 marker and the percentage of cytotoxicity of K562 and K562-CD19 cells (left) and Raji cells (right). Correlations were determined by Pearson’s rank correlation and considered statistically significant when p < 0.05. Each symbol corresponds to one culture condition.

Similar articles

References

    1. Keshavarz A, Salehi A, Khosravi S, Shariati Y, Nasrabadi N, Kahrizi MS, et al. . Recent findings on chimeric antigen receptor (CAR)-engineered immune cell therapy in solid tumors and hematological Malignancies. Stem Cell Res Ther. (2022) 13:482. doi: 10.1186/s13287-022-03163-w - DOI - PMC - PubMed
    1. Khan AN, Chowdhury A, Karulkar A, Jaiswal AK, Banik A, Asija S, et al. . Immunogenicity of CAR-T cell therapeutics: evidence, mechanism and mitigation. Front Immunol. (2022) 13:886546. doi: 10.3389/fimmu.2022.886546 - DOI - PMC - PubMed
    1. Terwilliger T, Abdul-Hay M. Acute lymphoblastic leukemia: a comprehensive review and 2017 update. Blood Cancer J. (2017) 7:e577. doi: 10.1038/bcj.2017.53 - DOI - PMC - PubMed
    1. Frey NV. Chimeric antigen receptor T cells for acute lymphoblastic leukemia. Am J Hematol. (2019) 94:S24–S7. doi: 10.1002/ajh.25442 - DOI - PubMed
    1. Boucher JC, Davila ML. Chimeric antigen receptor design today and tomorrow. Cancer J. (2021) 27:92–7. doi: 10.1097/PPO.0000000000000514 - DOI - PubMed

LinkOut - more resources