. 2024 Dec;11(45):e2404224.
doi: 10.1002/advs.202404224. Epub 2024 Oct 4.

Genome-Wide Profiling of H3K27ac Identifies TDO2 as a Pivotal Therapeutic Target in Metabolic Associated Steatohepatitis Liver Disease

Affiliations

Genome-Wide Profiling of H3K27ac Identifies TDO2 as a Pivotal Therapeutic Target in Metabolic Associated Steatohepatitis Liver Disease

Yaling Zhu et al. Adv Sci (Weinh). 2024 Dec.

Abstract

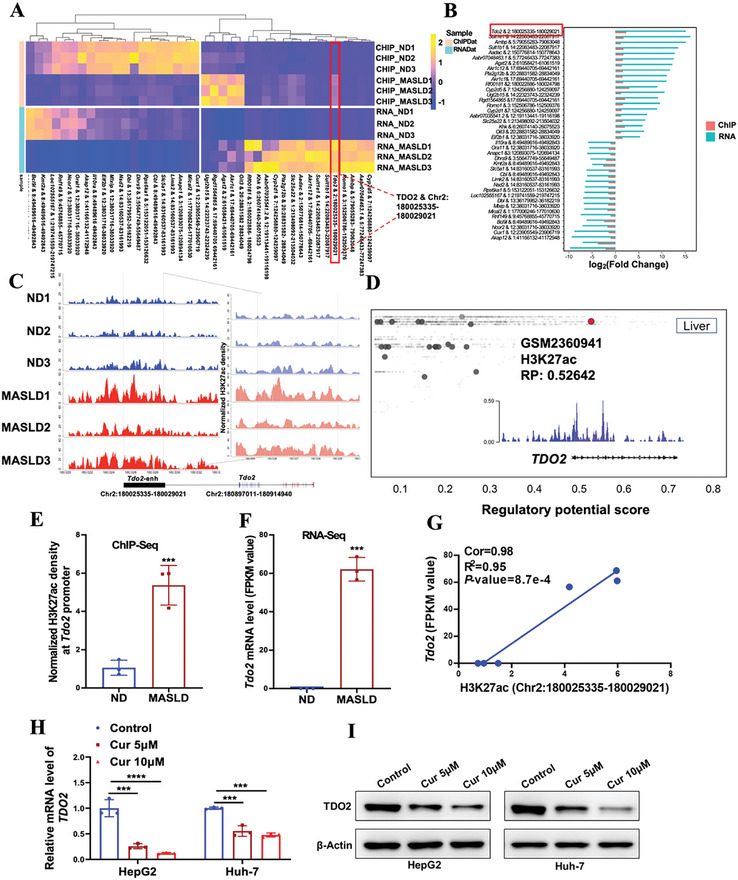
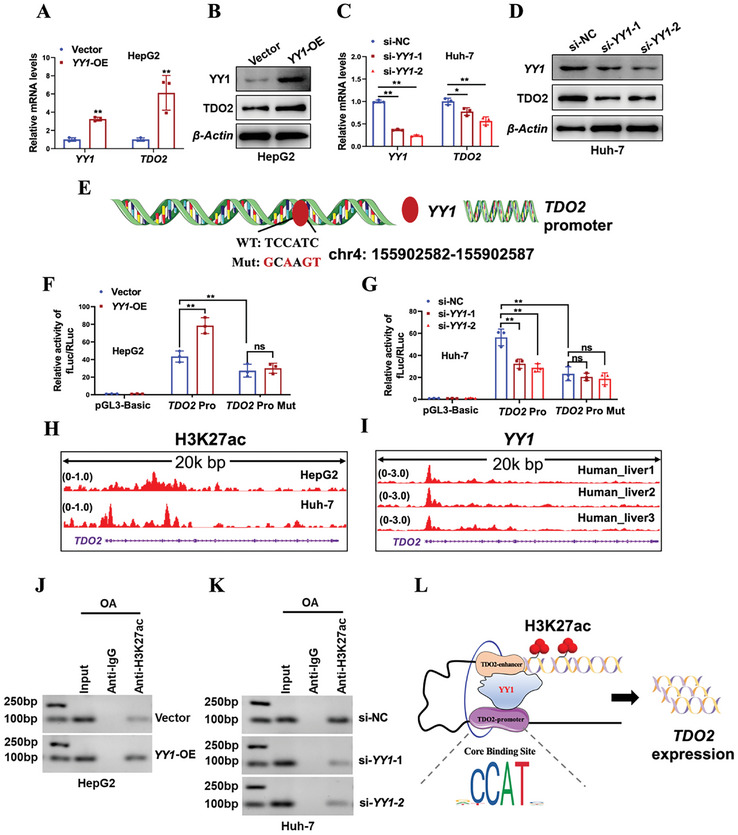
H3K27ac has been widely recognized as a representative epigenetic marker of active enhancer, while its regulatory mechanisms in pathogenesis of metabolic dysfunction-associated steatotic liver disease (MASLD) remain elusive. Here, a genome-wide comparative study on H3K27ac activities and transcriptome profiling in high fat diet (HFD)-induced MASLD model is performed. A significantly enhanced H3K27ac density with abundant alterations of regulatory transcriptome is observed in MASLD rats. Based on integrative analysis of ChIP-Seq and RNA-Seq, TDO2 is identified as a critical contributor for abnormal lipid accumulation, transcriptionally activated by YY1-promoted H3K27ac. Furthermore, TDO2 depletion effectively protects against hepatic steatosis. In terms of mechanisms, TDO2 activates NF-κB pathway to promote macrophages M1 polarization, representing a crucial event in MASLD progression. A bovine serum albumin nanoparticle is fabricated to provide sustained release of Allopurinol (NPs-Allo) for TDO2 inhibition, possessing excellent biocompatibility and desired targeting capacity. Venous injection of NPs-Allo robustly alleviates HFD-induced metabolic disorders. This study reveals the pivotal role of TDO2 and its underlying mechanisms in pathogenesis of MASLD epigenetically and genetically. Targeting H3K27ac-TDO2-NF-κB axis may provide new insights into the pathogenesis of abnormal lipid accumulation and pave the way for developing novel strategies for MASLD prevention and treatment.

Keywords: H3K27ac; M1 polarization; MASLD; TDO2; YY1.


Conflict of interest statement

The authors declare no conflict of interest.

Figures

Figure 1
Figure 1
HFD induced robust H3K27ac‐marked enhancer aberrations in lipid metabolism genes. A) Schematic diagram of the strategy to identify core epigenetic and genetic biomarkers in MASLD progression. B) Genome‐wide “four‐way” plot showed the genes with a threshold of log2foldchange (|ChIP| >1 and |RNA| >5), which were generated by integrated analysis of ChIP‐Seq and RNA‐Seq between ND and MASLD groups. PP peak‐genes with positive upregulation between H3K27ac peaks and genes, which were colored red (log2foldchange (ChIP > 1 and RNA > 5), NN peak‐genes with downregulation between H3K27ac peaks and genes, which were colored blue (log2foldchange (ChIP < −1 and RNA < −5), PN peak‐genes with positive regulation but negative expression, which were colored pink (log2foldchange (ChIP > 1 and RNA < −5), NP peak‐genes with negative regulation but positive expression, which were colored green. C) The positive correlation of H3K27ac peaks of ChIP‐Seq and gene expression of RNA‐Seq in ND group. D) The positive correlation of H3K27ac peaks of ChIP‐Seq and gene expression of RNA‐Seq in MASLD group. E) Over‐representative of biological processes of putative peak target‐genes of PP and NN. F) Top KEGG pathways of putative target‐genes of PP and NN by adopting DAVID (https://david‐d.ncifcrf.gov/). ND: Normal Diet; MASLD: Metabolic Associated Steatohepatitis Liver Disease. The correlation coefficients (R values) and p‐values were calculated by Spearman analysis.
Figure 2
Figure 2
Tdo2 is a pivotal factor epigenetically activated by H3K27ac in MASLD. A) Heatmap of ChIP‐Seq and RNA‐Seq data showing differential H3K27ac enrichment and transcriptional level between ND and MASLD group, of which Tdo2 & Chr2: 180025335‐180029021 was significantly over‐represented. B) The barplot of differential fold change of top 20 H3K27ac peak‐genes in ChIP‐Seq and RNA‐Seq. C) The differential density of H3K27 acetylation on Tdo2 between ND and MASLD rats (Rat: Rnor_6.0_ensembl_104). D) H3K27ac was a histone modification marker of TDO2 gene in the liver according to the Cistrome database (accession number: GSM2360941). All Cistrome data have been carefully curated and processed with a streamlined analysis pipeline and evaluated with comprehensive quality control metrics. E) The H3K27ac density of Tdo2 gene in MASLD rats compared with ND rats using ChIP‐Seq data (n = 3 per group; unpaired two‐sided Student t‐test). F) The mRNA expression level of Tdo2 in MASLD rats relative to ND individuals (n = 3 per group; unpaired two‐sided Student t‐test). G) Correlation between Tdo2 expression level and H3K27ac peak (chr2:180025335‐180029021) density (n = 6, Cor = 0.98, R2 = 0.95). H,I) The mRNA and protein levels of TDO2 in HepG2 and Huh‐7 cells treated with indicated concentrations of Curcumin (Cur) were determined by qRT‐PCR and Western blotting, respectively. P‐values were calculated with one‐way ANOVA test (n = 3 per group). Results were shown as mean ± SD. P‐values are indicated by * < 0.05; ** < 0.01; *** < 0.001; **** < 0.0001.
Figure 3
Figure 3
YY1 induced TDO2 upregulation via modulating H3K27ac. A,B) The mRNA and protein levels of YY1 and TDO2 in OA (0.6 × 10−3 m)‐induced HepG2 cells transfected with YY1 overexpression plasmid (YY1‐OE) or empty vector (Vector) were examined by qRT‐PCR and Western blotting, respectively. P‐values were calculated with unpaired two‐sided Student t‐test (n = 3 per group). C,D) The mRNA and protein levels of YY1 and TDO2 in OA (0.6 × 10−3 m)‐induced Huh‐7 cells transfected with siRNAs against YY1 (si‐YY1‐1 and si‐YY1‐2) or negative control siRNA (si‐NC) were determined by qRT‐PCR and Western blotting, respectively. P‐values were calculated with one‐way ANOVA test (n = 3 per group). E) Schematic representation of the predicted wild‐type and mutant YY1 binding sites in the DNA promoter region of TDO2 based on Jaspar (https://jaspar.genereg.net/). F,G) Regulation of wild‐type or mutant TDO2 promoter activities by YY1 was determined by luciferase reporter assay. Renilla luciferase activity as input control (n = 3 per group, unpaired two‐sided Student t‐test in (F) and one‐way ANOVA test in (G). H) ChIP‐Seq data shows the enrichments of H3K27ac around the promoter region of TDO2 in HepG2 and Huh‐7 cells according to the Cistrome database (accession number: GSM1670897, GSM2360939). I) ChIP‐Seq data shows the enrichments of YY1 around the promoter region of TDO2 in human liver according to the Cistrome database (accession number: ENCSR382MOM_1, ENCSR994YLZ_2, ENCSR994YLZ_1). J,K) Regulation of enrichments of H3K27ac around the promoter region of TDO2 in HepG2 and Huh‐7 cells by YY1 was determined by ChIP assay. L) Schematic diagram shows an interactive model that YY1 transcriptionally activated TDO2 expression. Results were shown as mean ± SD. P‐values are indicated by * < 0.05; ** < 0.01; *** < 0.001; ns: not significant.
Figure 4
Figure 4
TDO2 expression was increased in hepatic steatosis patients and models. A,B) TDO2 mRNA expression in the liver of MASLD and health patients from GSE63067 (Healthy subjects n = 7, MASLD n = 9, unpaired two‐sided Student t‐test) and GSE126848 (Control n = 14, MASLD n = 15, unpaired two‐sided Student t‐test). C) The mRNA level of Tdo2 in the liver of mice with low serum TG and high serum TG from GSE34637 (n = 8 per group, unpaired two‐sided Student t‐test). D–G) The mRNA and protein level of TDO2 in HepG2 and Huh‐7 cells treated with indicated dose of OA for 48 h were examined by qRT‐PCR and Western blotting, respectively. P‐values were calculated using one‐way ANOVA test (n = 3 per group). H) Protein level of TDO2 in the liver tissues of rats fed with HFD for indicated weeks was evaluated by Western blotting (n = 3 per group). I,J) Representative immunofluorescence staining and quantification of TDO2 expression in liver tissue sections of rats fed with ND or HFD (n = 3 per group, unpaired two‐sided Student t‐test). Scale bar, 100 µm. Results in (D) and (F) are shown as mean ± SD. P‐values are indicated by * < 0.05; ** < 0.01; *** < 0.001; **** < 0.0001.
Figure 5
Figure 5
Ablation of Tdo2 ameliorated HFD‐induced hepatic steatosis in rats. Rats were infected with lentivirus particles of shNC or shTdo2 through tail‐vein injection and fed with ND or HFD. A) Representative captured liver tissues (n = 3 per group). scale bar, 1 cm. B,C) H&E and Oil Red O staining of liver tissue sections (n = 3 per group). Scale bar, 50 µm. D) The ultrastructure of transmission electron microscope of liver tissue sections at 3600× (left, scale bar, 2 µm) and 8500× (right, scale bar, 1 µm) magnification (n = 3 per group). E) Body weight was measured every week from 0 to 8 weeks (n = 5 per group). F) Liver index was measured after sacrifice of rats in each group (n = 5 per group). G–L) Serum levels of a ALT, AST, TC, TG, LDL‐C, and HDL‐C of rats in each group (n = 5 per group). Results are shown as mean ± SD. P‐values are indicated by * < 0.05; ** < 0.01; *** < 0.001; **** < 0.0001 (two‐way ANOVA test in (E), others with one‐way ANOVA test). Blue: ND+shNC; Dark red: HFD+shNC; Red: HFD+shTdo2. ALT: Alanine aminotransferase; AST: Aspartate aminotransferase; TC: Total cholesterol; TG: Total triglycerides; LDL‐C: Low‐density lipoprotein cholesterol; HDL‐C: High‐density lipoprotein cholesterol.
Figure 6
Figure 6
TDO2 contributed to M1 polarization of macrophages in hepatic steatosis models. A) Schematic diagram depicts the co‐culture system. OA‐induced HepG2/Huh‐7 cells transfected with TDO2 over‐expression/siRNAs or their respective negative control were seeded into the upper chamber of a transwell, THP‐1‐derived macrophages were seeded into the bottom chamber. B,C) The mRNA levels of M1 markers (HLA‐DR and TNF‐α) in macrophages co‐cultured with TDO2‐overexpressing HepG2 and TDO2‐depleting Huh‐7 cells with OA treatment (0.6 × 10−3 m) were determined by qRT‐PCR (n = 3 per group, unpaired two‐sided Student t‐test in (B) and one‐way ANOVA test in (C)). D–G) Representative immunofluorescence staining and quantification of iNOS expression in macrophages co‐cultured with TDO2‐overexpressing HepG2 and TDO2‐depleting Huh‐7 cells with OA treatment (0.6 × 10−3 m, scale bar, 100 µm). P‐values were calculated with one‐way ANOVA test (n = 3 per group). H–K) The percentage of M1 (CD86+) macrophages in THP‐1‐derived macrophages co‐cultured with TDO2‐overexpressing HepG2 and TDO2‐depleting Huh‐7 cells with OA treatment (0.6 × 10−3 m) was measured by flow cytometry. P‐values were calculated with one‐way ANOVA test (n = 3 per group). L,M) Representative immunofluorescence staining and quantification of iNOS expression in liver tissue sections of rats infected with lentivirus particles of shNC or shTdo2 through tail‐vein injection and fed with ND or HFD (n = 3 per group, one‐way ANOVA test). Scale bar, 100 µm. Results were shown as mean ± SD. P‐values are indicated by * < 0.05; ** < 0.01; *** < 0.001; **** < 0.0001 (unpaired two‐tailed Student t‐test).
Figure 7
Figure 7
TDO2 promotes M1 polarization of macrophages by activating the NF‐κB pathway. A) Volcano plot of remarkable differentially expressed genes between siTDO2 and siNC groups. B) Transcription profiles of differentially expressed genes between siTDO2 and siNC groups. C) Inflammatory response network of over‐representative GO terms of DEGs. The size and color of node represented gene number and p‐value, respectively. D–F) Gene Set Enrichment Analysis (GSEA) of differential expressing genes in TDO2‐depleted Huh‐7 cells in the co‐culture system. G) Dot plot of enriched KEGG terms. H) Sankey plot showing top three pathways enriched by significantly downregulated genes in siTDO2 group. Left column shows the p value of enriched pathway, where circle size represents the log2Foldchange value, and right column indicates the number of gene counts enriched in the pathway. I,J) Protein levels of TDO2, p‐NF‐κB, NF‐κB p‐iκBa, and iκBa in TDO2‐depleting Huh‐7 and TDO2‐overexpressing HepG2 cells with OA treatment (0.6 × 10−3 m) in the co‐culture system were examined by Western blotting.
Figure 8
Figure 8
Characterizations of TDO2 inhibitor‐loaded BSA nanoparticles (NPs‐Allo). A) Schematic illustration of synthesis of NPs‐Allo. B) Schematic diagram of animal experiments design. In total 20 male rats of six weeks old were randomly divided into ND (n = 5) and HFD (n = 15) groups, which fed with standard‐diet or high‐fat diet for eight weeks, respectively. Rats were injected with free Allopurinol, NPs‐Allo or negative control via the tail vein as follows: normal diet with negative control (ND+Ctrl, n = 5), high fat diet with negative control (HFD+Ctrl, n = 5), high fat diet with positive control (HFD+Ator, n = 5), high fat diet with Allopurinol (HFD+Allo, n = 5), high fat diet with TDO2 inhibitor‐loaded BSA nanoparticles (HFD+ NPs‐Allo, n = 5). The rats were humanely sacrificed at the end of eight weeks for further effects evaluation. C) FTIR spectrum of NPs‐Allo, Allo, and BSA. D) TEM images of NPs‐Allo. Scale bars, 200 and 500 nm. E) The size distribution of NPs‐Allo. F) Release profiles of Allopurinol from NPs‐Allo.
Figure 9
Figure 9
Effects of free Allopurinol and NPs‐Allo on liver lipid metabolism disorder in HFD‐fed rats. A) Representative liver morphology of ND+Ctrl, HFD+Ctrl, HFD+Ator, HFD+Allo, and HFD+NPs‐Allo rats (n = 3 per group). Scale bar, 1 cm. B) H&E staining showed that NPs‐Allo promoted the reduction of steatosis after Allopurinol treatment (n = 3 per group). Scale bar, 50 µm. C) Oil red O (ORO) staining showed that NPs‐Allo promoted the reduction of lipid deposition after Allopurinol treatment (n = 3 per group). Scale bar, 50 µm. D) The ultrastructure of rat hepatocytes in ND+Ctrl, HFD+Ctrl, HFD+Ator, HFD+Allo, and HFD+NPs‐Allo groups at 3600× (left, scale bar, 2 µm) and 8500× (right, scale bar, 1 µm) magnification (n = 3 per group). E) Body weight of rats in ND+Ctrl, HFD+Ctrl, HFD+Ator, HFD+Allo, and HFD+NPs‐Allo groups (n = 5 per group). F) Liver index of rats ND+Ctrl, HFD+Ctrl, HFD+Ator, HFD+Allo, and HFD+NPs‐Allo groups (n = 5 per group)). G–L) The content of serum ALT, AST, TC, TG, LDL‐C, and HDL‐C in the indicated groups (n = 5 per group). Results were shown as mean ± SD. P‐values are indicated by * < 0.05; ** < 0.01; *** < 0.001; **** < 0.0001 (n = 5 per group, two‐way ANOVA test in (E), others with one‐way ANOVA test). Blue: ND+Ctrl; Dark red: HFD+Ctrl; Red: HFD+Allo; Green: HFD+NPs‐Allo; Purple: HFD+Ator. ALT: Alanine aminotransferase; AST: Aspartate aminotransferase; TC: Total cholesterol; TG: Total triglycerides; LDL‐C: Low‐density lipoprotein cholesterol; HDL‐C: High‐density lipoprotein cholesterol.
Figure 10
Figure 10
A hypothetical mechanism for epigenetic regulation of H3K27ac leading to the development of MASLD in rats and potential therapeutic mechanisms. A proposed model suggests that HFD induced a significantly increase in histone H3K27 acetylation, which resulting in the remodeling of chromatin structure. Then, the enhancer was recruited by transcription factors YY1, promoting the expression of gene TDO2, which promoted macrophages M1 polarization by activating NF‐κB pathway to facilitate occurrence and development of MASLD. Based on this, we proposed a potential treatment approach for MASLD: a TDO2 inhibitor (Allopurinol)‐loaded BSA nanoparticle was designed to inhibit TDO2 activity, further inhibit M1 polarization of macrophages and mitigate MASLD progression.

Similar articles

Cited by

  • Epigenetic Regulation of Aging and its Rejuvenation.
    An Y, Wang Q, Gao K, Zhang C, Ouyang Y, Li R, Ma Z, Wu T, Zhou L, Xie Z, Zhang R, Wu G. An Y, et al. MedComm (2020). 2025 Sep 1;6(9):e70369. doi: 10.1002/mco2.70369. eCollection 2025 Sep. MedComm (2020). 2025. PMID: 40904701 Free PMC article. Review.

References

    1. Diehl A. M., Day C., N. Engl. J. Med. 2017, 377, 2063. - PubMed
    1. Heymann F., Tacke F., Nat. Rev. Gastroenterol. Hepatol. 2016, 13, 88. - PubMed
    1. Loomba R., Friedman S. L., Shulman G. I., Cell 2021, 184, 2537. - PubMed
    1. a) Arrese M., Cabrera D., Kalergis A. M., Feldstein A. E., Dig. Dis. Sci. 2016, 61, 1294. - PMC - PubMed
    2. b) Tacke F., J. Hepatol. 2017, 66, 1300. - PubMed
    3. c) Wu R., Nakatsu G., Zhang X., Yu J., Expert Opin. Ther. Targets 2016, 20, 615. - PubMed
    1. a) Berardis S., Sokal E., Eur. J. Pediatr. 2014, 173, 131. - PMC - PubMed
    2. b) Ayonrinde O. T., Olynyk J. K., Marsh J. A., Beilin L. J., Mori T. A., Oddy W. H., Adams L. A., J. Gastroenterol. Hepatol. 2015, 30, 163. - PubMed

LinkOut - more resources