. 2024 Dec;11(45):e2404661.
doi: 10.1002/advs.202404661. Epub 2024 Oct 4.

The eATP/P2×7R Axis Drives Quantum Dot-Nanoparticle Induced Neutrophil Recruitment in the Pulmonary Microcirculation

Affiliations

The eATP/P2×7R Axis Drives Quantum Dot-Nanoparticle Induced Neutrophil Recruitment in the Pulmonary Microcirculation

Chenxi Li et al. Adv Sci (Weinh). 2024 Dec.

Abstract

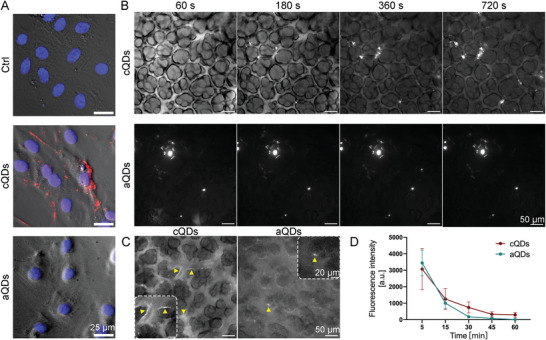
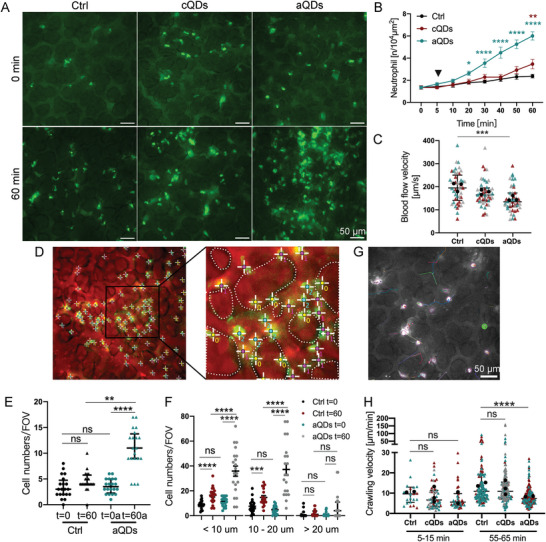
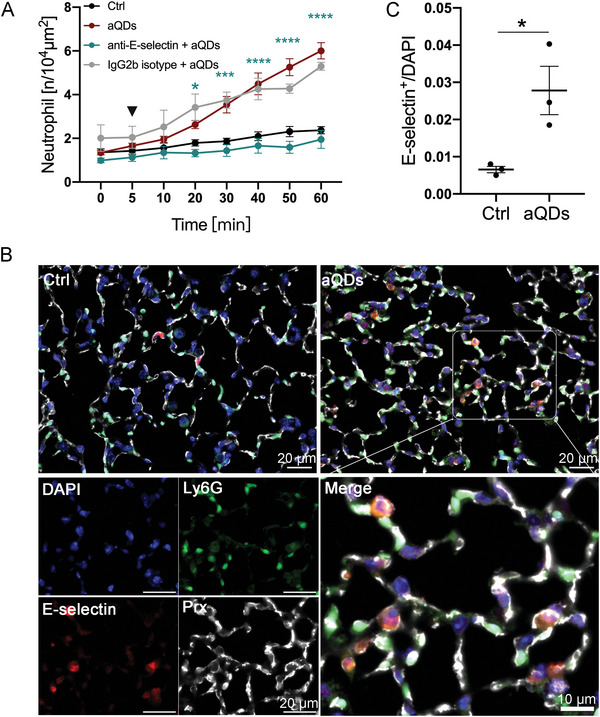
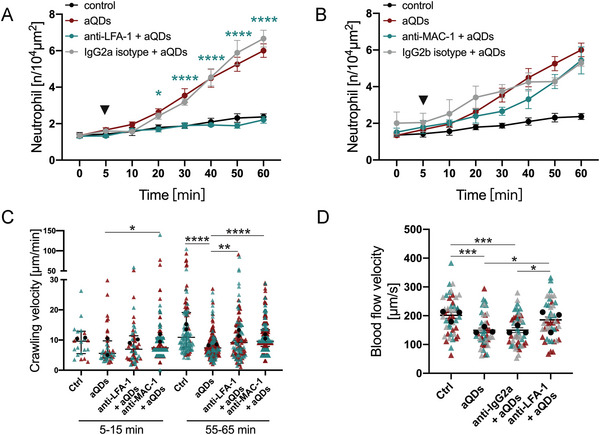
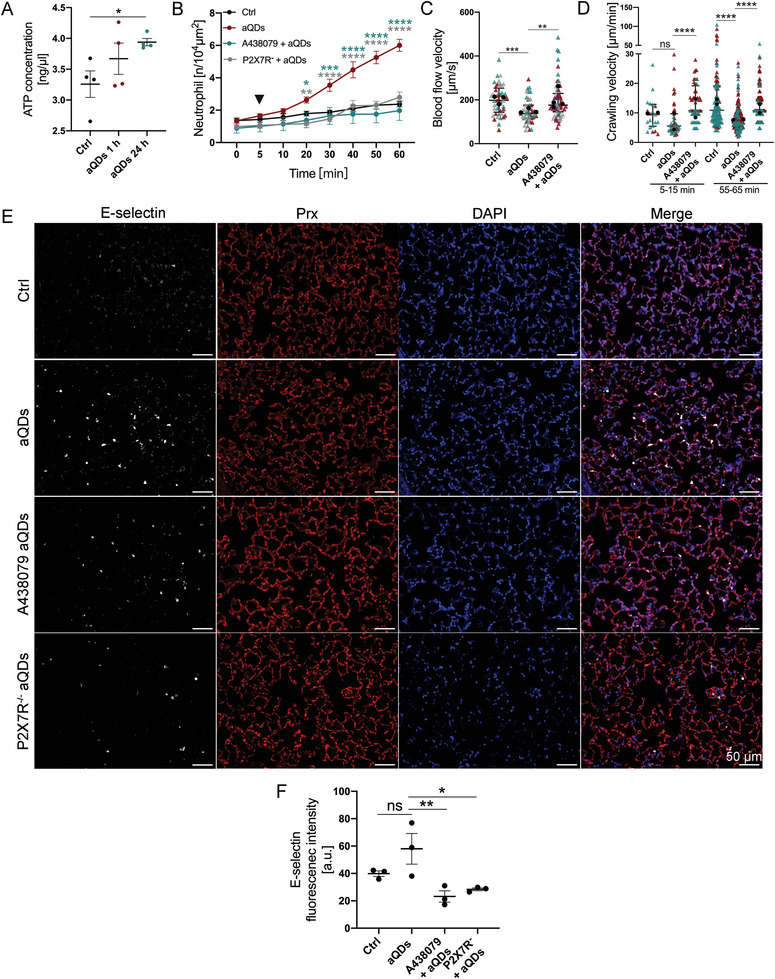
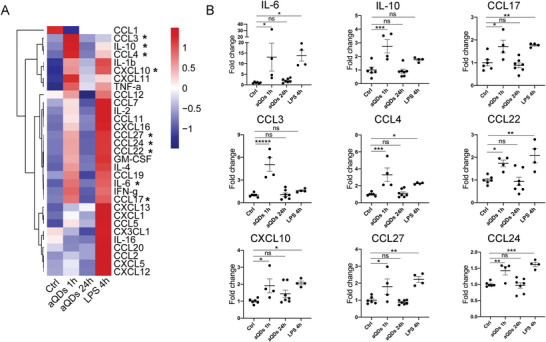
Exposure to nanoparticles (NPs) is frequently associated with adverse cardiovascular effects. In contrast, NPs in nanomedicine hold great promise for precise lung-specific drug delivery, especially considering the extensive pulmonary capillary network that facilitates interactions with bloodstream-suspended particles. Therefore, exact knowledge about effects of engineered NPs within the pulmonary microcirculation are instrumental for future application of this technology in patients. To unravel the real-time dynamics of intravenously delivered NPs and their effects in the pulmonary microvasculature, we employed intravital microscopy of the mouse lung. Only PEG-amine-QDs, but not carboxyl-QDs triggered rapid neutrophil recruitment in microvessels and their subsequent recruitment to the alveolar space and was linked to cellular degranulation, TNF-α, and DAMP release into the circulation, particularly eATP. Stimulation of the ATP-gated receptor P2X7R induced expression of E-selectin on microvascular endothelium thereby mediating the neutrophilic immune response. Leukocyte integrins LFA-1 and MAC-1 facilitated adhesion and decelerated neutrophil crawling on the vascular surface. In summary, this study unravels the complex cascade of neutrophil recruitment during NP-induced sterile inflammation. Thereby we demonstrate novel adverse effects for NPs in the pulmonary microcirculation and provide critical insights for optimizing NP-based drug delivery and therapeutic intervention strategies, to ensure their efficacy and safety in clinical applications.

Keywords: eATP P2X7 axis; innate immune response; intravital microscopy; lung; nanoparticles.


Conflict of interest statement

The authors declare no conflict of interest.

Figures

Figure 1
Figure 1
QDs dynamics and localization in vitro and in vivo. A) Interactions of QDs with, and their cellular uptake by endothelial cells in vitro. HUVECs were incubated with cQDs and aQDs for 1 h in vitro, followed by fixation with 4% PFA for IF staining. Phase‐contrast images of HUVECs, displayed in gray, show accumulation of cQDs (red), with DAPI‐stained nuclei appearing in blue. (Scale bar: 25 µm). B) Time‐lapse imaging reveals the interaction of cQDs with blood vessel walls and the clustering of cQDs and aQDs within pulmonary microvessels via L‐IVM. Fluorescence signal (white) solely results from QDs fluorescence, outlining blood vessels and alveolar space. Image brightness in the middle panel was adjusted to display the very bright aQD clusters. C) Representative images illustrate the pulmonary endothelial uptake of cQDs after 60 min whereas only few aQDs spots are present at microvessel walls (both indicated by yellow arrowheads), (Scale bar: 50 µm). D) Measurement of QD fluorescence intensities in microvessels. Data is shown as mean ± SEM, n = 4 mice per group. Two‐way ANOVA test.
Figure 2
Figure 2
The effect of QDs on neutrophil responses within the pulmonary microcirculation. A) Representative images depict neutrophils in pulmonary microvessels at 0 and 60 min after intravenous administration of vehicle (Ctrl), cQDs, and aQDs (1 pmol g−1 of BW). Neutrophils were directly labeled in vivo by i.v. application of Alexa488‐conjugated anti‐Ly6G Abs, depicted in bright green points. Autofluorescence outlines alveolar and vascular structures. (Scale bar, 50 µm.) B) Changes in neutrophil numbers during a 60 min period in mice undergoing QDs application. Data is shown as mean ± SEM, n = 4 mice per group, Two‐way ANOVA test, green * indicate significances between aQDs and Ctrl group, red * indicate cQDs and Ctrl group. C) Blood flow velocity after 60 min in mice undergoing QDs application. Blood velocity was measured by tracking iv. applied fluorescent tracer beads. Data is shown as median (interquartile range, IQR), each measurement is represented by a colored triangle, n = 45 measurements from 3 mice per group, Kruskal‐Wallis test. The mean values of the individual mice are shown as black dots. D) Localization of neutrophils in the alveolar space or microvessels. “0” indicates neutrophils localized in the alveolar space; “1”: neutrophils in vessels smaller than 10 µm; “2”: neutrophils in vessels ranging from 10–20 µm; and “3”: neutrophils in vessels larger than 20 µm. Dotted lines represent alveolar boundaries. Quantification of neutrophils localized in the pulmonary alveolar space E) and in various‐sized microvessels F). Data is shown as median (IQR) or mean ± SEM, n = 20 field of views (FOV) from 4 mice per group, Kruskal‐Wallis test or One‐way ANOVA test. G) Representative neutrophil movements over a period of 10 min. Neutrophil movements were recorded at 5 s intervals for 10 min using L‐IVM. The image displays neutrophil trajectories recorded between minutes 55 and 65 under control conditions, with each color representing the track of an individual neutrophil. (Scale bar: 50 µm). H) Neutrophil crawling velocities under various applications and time points. Quantification of neutrophil crawling velocities at 5–15 and 55–65 min after vehicle (Ctrl.), aQDs, and cQDs application. Data is shown as median (IQR), each measurement is represented by a colored triangle, n = 22–174 neutrophils analyzed in 2–3 mice per group, Kruskal‐Wallis test. The mean values of the individual mice are shown as black dots. * indicates P ≤ 0.05, ** indicates P ≤ 0.01, *** indicates P ≤ 0.001, and **** indicates P ≤ 0.0001.
Figure 3
Figure 3
Suppression of aQDs‐induced neutrophil recruitment by Cromolyn or TNF‐α neutralization in the pulmonary microcirculation. A) Neutrophil recruitment induced by aQDs was inhibited by Cromolyn. Cromolyn (0.2 mg kg−1 of BW) was intravenously applied at 30 min prior to L‐IVM and aQDs or vehicle were injected at 5 min (arrowhead). Data is shown as mean ± SEM, n = 4 mice per group, Two‐way ANOVA test, green stars indicate significances between the cromolyn + aQDs and aQDs groups. B) anti‐TNF‐α mAbs diminished neutrophil recruitment induced by aQDs. Anti‐TNF‐α mAbs (30 µg per mouse) were intravenously applied at 30 min prior to L‐IVM. Data is shown as mean ± SEM, n = 4 mice per group, control and aQD neutrophil counts same data as in Figure 2B, Student's t‐test, black stars indicate significances between anti‐TNF‐α mAbs + aQDs and Ctrl group; Two‐way ANOVA test, green stars indicate significances between anti‐TNF‐α mAbs + aQDs and aQDs group, grey stars indicate anti‐IgG1 mAbs + aQDs and aQDs group. C) Reduced blood flow velocity after aQDs injection was recovered after pretreatment with cromolyn or anti‐TNF‐α mAbs. Data is shown as median (IQR), each measurement is represented by a colored triangle, n = 45–60 measurements from 3–4 mice per group, Kruskal‐Wallis test. The mean values of the individual mice are shown as black dots. D) Quantification of Ly6G+ neutrophils immune‐stained tissue samples. Data is shown as mean ± SEM, n = 3 mice (6 FOV) /group, One‐way ANOVA test. * indicates P ≤ 0.05, ** indicates P ≤ 0.01, *** indicates P ≤ 0.001, and **** indicates P ≤ 0.0001.
Figure 4
Figure 4
aQDs‐induced neutrophil recruitment is mediated by E‐selectin. A) Quantification of recruited neutrophil numbers over time. The mice were pre‐treated intravenously with anti‐E‐selectin mAb 9A9 (20 µg per mouse) for 30 min followed by application of aQDs (arrowhead) compared to aQDs only application and vehicle controls. Data is shown as mean ± SEM, n = 4–5 mice per group, control and aQD neutrophil counts same data as in Figure 2B, Two‐way ANOVA test, green stars indicate significances between anti‐E‐selectin mAb + aQDs and aQDs group. B) Analysis of E‐selectin expression. Representative lung slices from control and aQDs‐treated mice after 1 h, stained with rat anti‐E‐selectin antibody (red), Alexa488‐labeled anti‐Ly6G antibody (green), rabbit Anti‐PRX antibody (white), and DAPI (blue). (Scale bar: 10/20 µm). C) Quantification of E‐selectin positive microvessels from immunostainings. Data is shown as mean ± SEM. n = 3 mice (6 FOV) /group, Student's t‐test. * indicates P ≤ 0.05, ** indicates P ≤ 0.01, *** indicates P ≤ 0.001, and **** indicates P ≤ 0.0001.
Figure 5
Figure 5
LFA‐1 and MAC‐1 contribute to aQD induced neutrophil recruitment. Quantification of recruited neutrophils over time in mice pre‐treated intravenously with A) anti‐LFA‐1 mAbs or B) anti‐MAC‐1 mAbs or isotype control Abs (30 µg per mouse) 30 min prior to L‐IVM followed by aQDs application at 5 min (arrowhead). Data is shown as mean ± SEM, n = 3–4 mice per group, control and aQD neutrophil counts same data as in Figure 2B, Two‐way ANOVA test, green stars indicate significances between anti‐LFA‐1/anti‐MAC‐1 mAbs + aQDs and aQDs group. C) Velocity of crawling neutrophils under different conditions at 5–15 and 55–65 min. Data is shown as median (IQR) and each measurement is represented by a colored triangle, n = 22–365 crawling neutrophils over 10 min from 2 mice per group, Kruskal‐Wallis test. Mean values of the individual mice are shown as black dots. D) Quantification of blood flow velocities in the different experimental groups at 1 h. Data is shown as mean ± SEM, each measurement is represented by a colored triangle, n = 45 measurements from 3 mice per group, One‐way ANOVA test. Mean values of the individual mice are shown as black dots. * indicates P ≤ 0.05, ** indicates P ≤ 0.01, *** indicates P ≤ 0.001, and **** indicates P ≤ 0.0001.
Figure 6
Figure 6
eATP/P2×7R axis is involved in aQDs‐induced neutrophil recruitment. A) Quantification of eATP concentrations in plasma samples after different treatments. Data is shown as mean ± SEM, n = 4 mice/group, Student's t‐test. B) Quantification of recruited neutrophils over time after aQDs application (arrowhead) in mice with and without pre‐treatment by intravenous injection of P2×7R antagonist (A438079, 30 µg per mouse) 30 min prior to L‐IVM and in P2 × 7R knockout. Data is shown as mean ± SEM, n = 4–6 mice per group, control and aQD neutrophil counts same data as in Figure 2B, Two‐way ANOVA test, green stars indicate significances between P2 × 7R antagonist + aQDs and aQDs groups, grey stars indicate significances between P2 × 7R knockout mice + aQDs and WT mice + aQDs groups. (C) Quantification of blood flow velocity after 1 h of L‐IVM. Data is shown as median (IQR) and each measurement is represented by a colored triangle, n = 4 5–60 measurements from 3 mice/group, Kruskal‐Wallis test. Mean values of the individual mice are shown as black dots. D) Crawling velocities of neutrophils upon P2×7R antagonist pretreatment and aQDs application. Data is shown as median (IQR) and each measurement is represented by a colored triangle, n = 22–247 neutrophils from 2 mice per group, Kruskal‐Wallis test. Mean values of the individual mice are shown as black dots. E) Histology of E‐selectin in lung slices from control mice, aQDs‐treated mice, A438079 pretreatment mice receiving aQDs, and P2×7R knockout mice with aQDs application for 1 h. Rat anti‐E‐selectin antibody (red), rabbit Anti‐PRX antibody (white), and DAPI (blue) were used. (Scale bar: 50 µm). F) Expression of E‐selectin quantified by relative fluorescence intensity from these immunostainings. Relative fluorescent intensities for E‐selectin were corrected against the background of lung tissue. Data is shown as mean ± SEM (round dots), each measurement is represented by a colored triangle, n = 3 mice (6 FOV) /group, One‐way ANOVA test. * indicates P ≤ 0.05, ** indicates P ≤ 0.01, *** indicates P ≤ 0.001, and **** indicates P ≤ 0.0001.
Figure 7
Figure 7
QD application induces cytokine secretion. A) Heatmap of cytokine changes. B) Individual alterations of cytokines. Cytokine concentrations were detected in mouse serum samples upon i.v. application of aQDs for 1 and 24 h, and LPS for 4 h as well as under control conditions. To combine two separate experimental rounds, the values were processed based on the mean of controls scaled to one. Data is shown as mean ± SEM, n = 4–7 mice per group, Student's t‐test, * indicates P ≤ 0.05, ** indicates P ≤ 0.01, *** indicates P ≤ 0.001, and **** indicates P ≤ 0.0001.

Similar articles

References

    1. Mitchell M. J., Billingsley M. M., Haley R. M., Wechsler M. E., Peppas N. A., Langer R., Nat. Rev. Drug Discovery 2021, 20, 101. - PMC - PubMed
    1. Buzea C., Pacheco I. I., Robbie K., Biointerphases 2007, 2, MR17. - PubMed
    1. Heires M., New Polit. Econ. 2008, 13, 357.
    1. European Commission , https://eur‐lex.europa.eu/legal‐content/EN/TXT/?uri=CELEX%3A32022H0614%2... (accessed: May 2022).
    1. Oberdörster G., Int. Arch. Occup. Environ. Health 2001, 74, 1. - PubMed

Substances

LinkOut - more resources