. 2025 Jan 2;85(1):52-68.
doi: 10.1158/0008-5472.CAN-24-0788.

LSD1 and CoREST2 Potentiate STAT3 Activity to Promote Enteroendocrine Cell Differentiation in Mucinous Colorectal Cancer

Affiliations

LSD1 and CoREST2 Potentiate STAT3 Activity to Promote Enteroendocrine Cell Differentiation in Mucinous Colorectal Cancer

Christopher A Ladaika et al. Cancer Res. .

Abstract

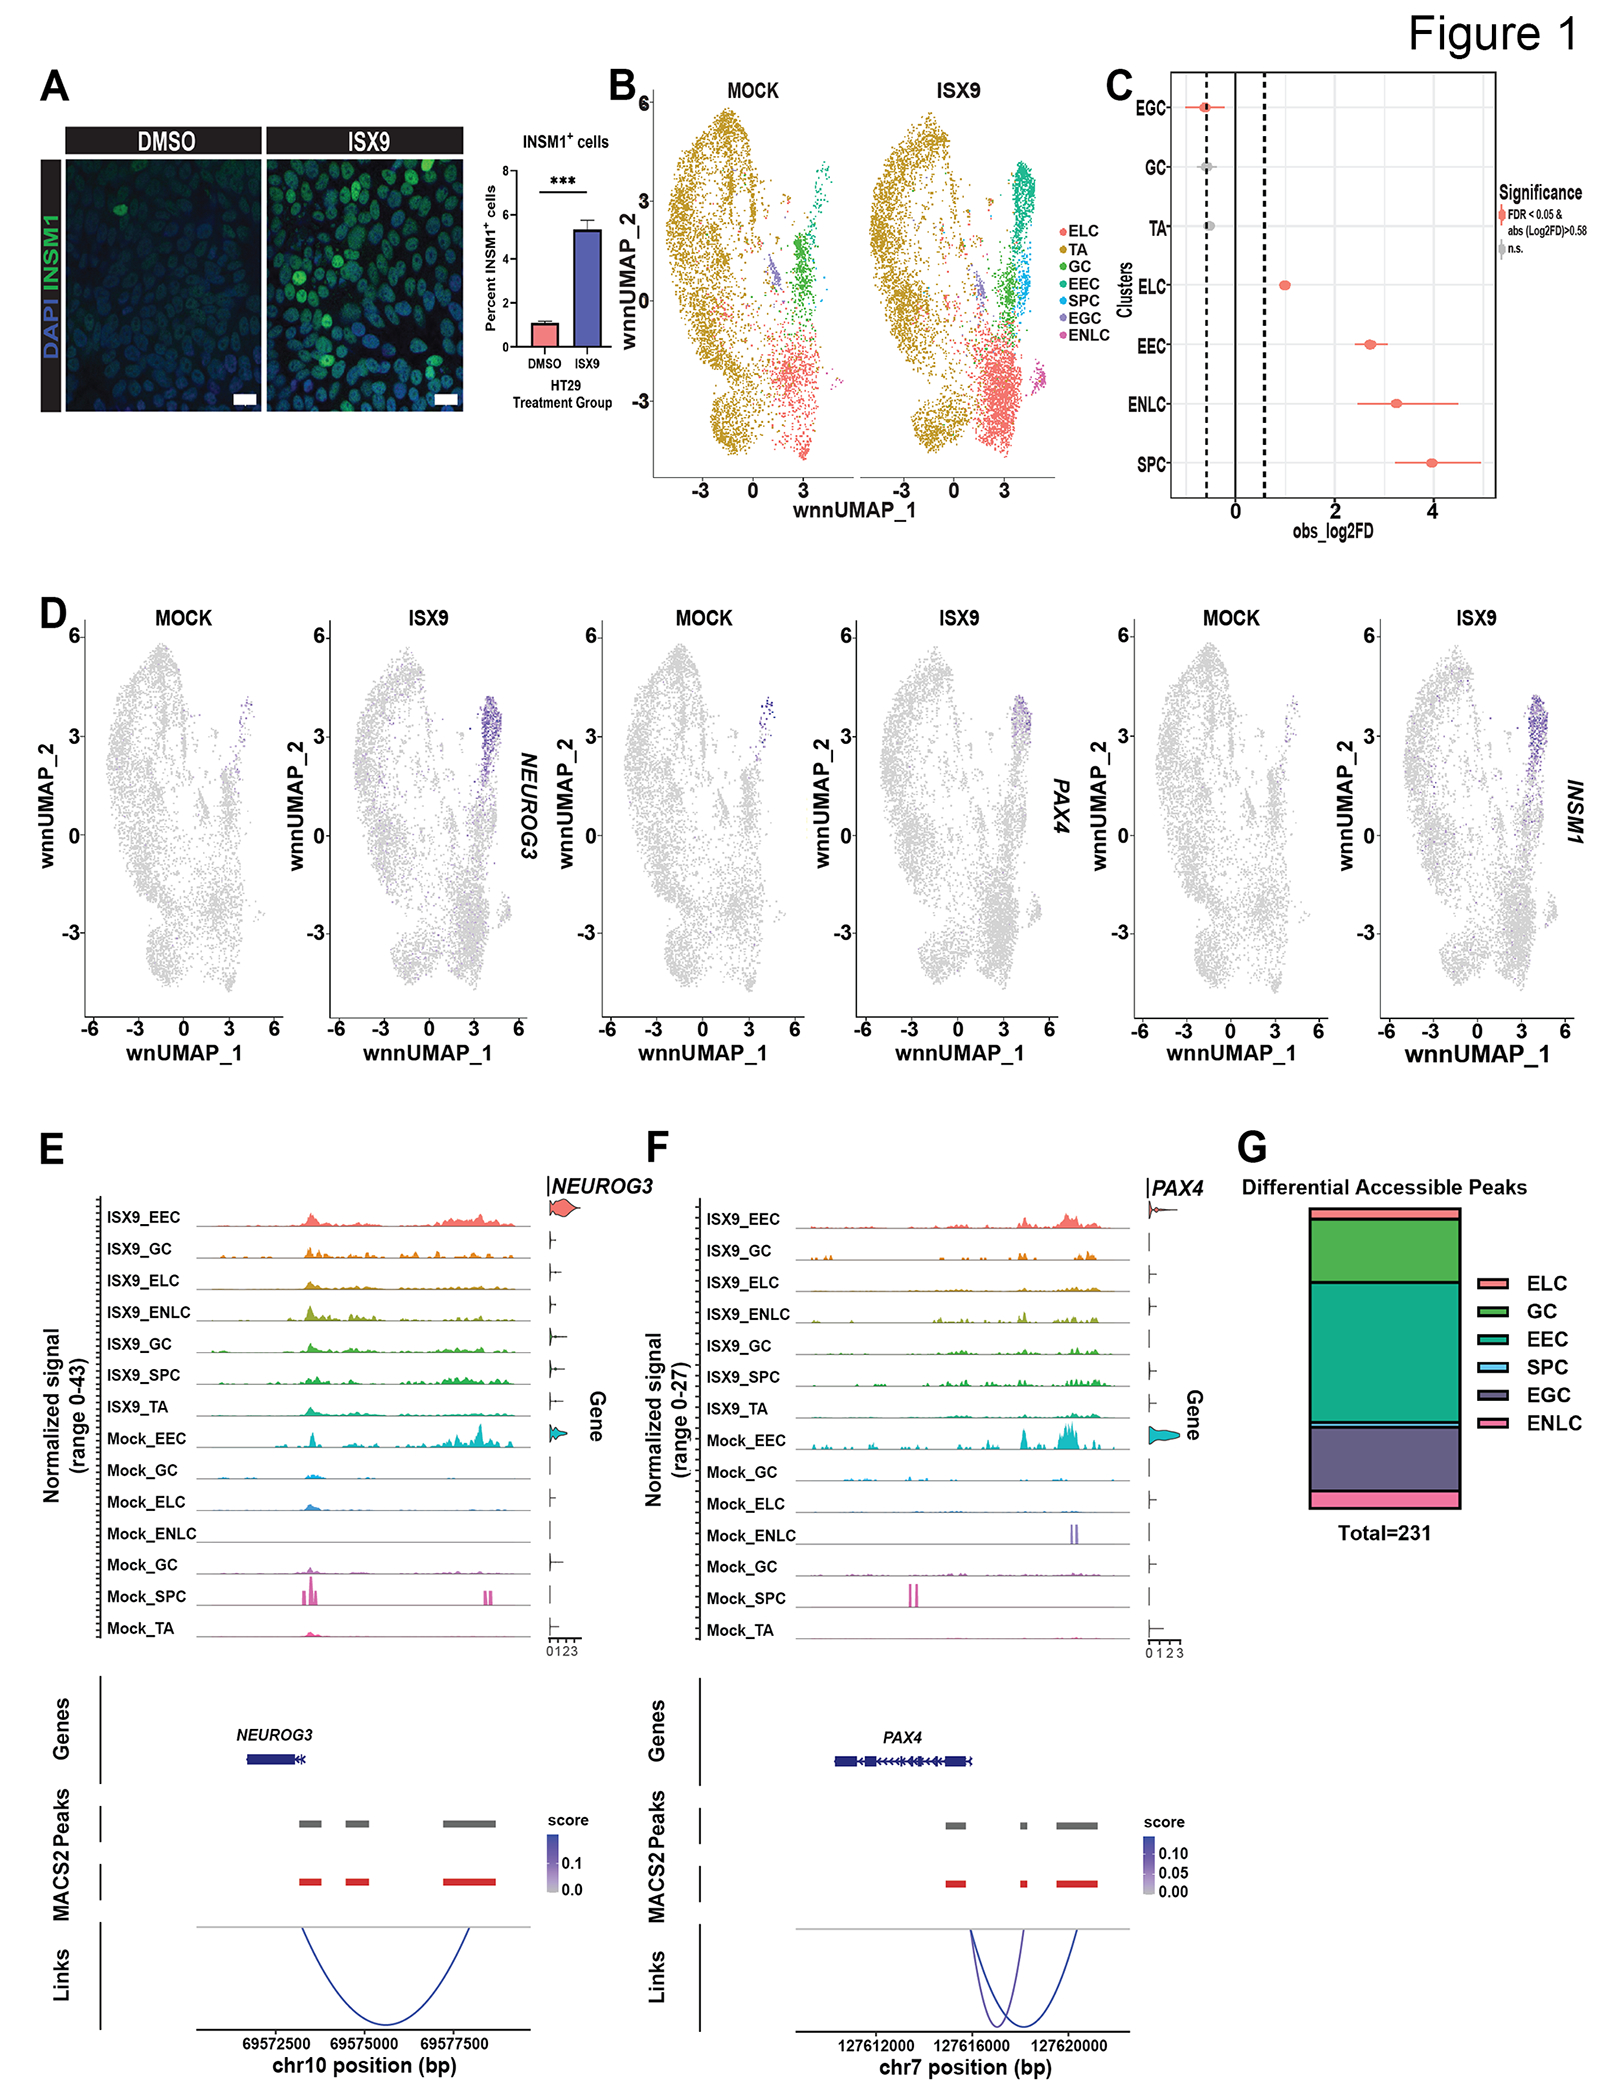
Neuroendocrine cells have been implicated in therapeutic resistance and worse overall survival in many cancer types. Mucinous colorectal cancer (mCRC) is uniquely enriched for enteroendocrine cells (EEC), the neuroendocrine cells of the normal colon epithelium, as compared with non-mCRC. Therefore, targeting EEC differentiation may have clinical value in mCRC. In this study, single-cell multiomics uncovered epigenetic alterations that accompany EEC differentiation, identified STAT3 as a regulator of EEC specification, and discovered a rare cancer-specific cell type with enteric neuron-like characteristics. Furthermore, lysine-specific demethylase 1 (LSD1) and CoREST2 mediated STAT3 demethylation and enhanced STAT3 chromatin binding. Knockdown of CoREST2 in an orthotopic xenograft mouse model resulted in decreased primary tumor growth and lung metastases. Collectively, these results provide a rationale for developing LSD1 inhibitors that target the interaction between LSD1 and STAT3 or CoREST2, which may improve clinical outcomes for patients with mCRC. Significance: STAT3 activity mediated by LSD1 and CoREST2 induces enteroendocrine cell specification in mucinous colorectal cancer, suggesting disrupting interaction among LSD1, CoREST2, and STAT3 as a therapeutic strategy to target neuroendocrine differentiation.


Conflict of interest statement

Conflict of interest statement: The authors declare no potential conflicts of interest.

Figures

Figure 1.
Figure 1.. Single cell multi-omics reveals chromatin changes during EEC differentiation.
A. Representative immunofluorescence images of EEC marker INSM1 (green) in HT29 cells treated twice for 24hrs with vehicle or ISX9 (40 μM). The scale bar is 20 μm. Graph shows quantification of percent INSM1 positive cells +/− SEM (N=3). B. UMAP dot plot of HT29 single cell multi-omics samples treated with vehicle (MOCK, left) or ISX9 (right) treated as in A. Samples are colored by cell type/cluster. TAs are transit amplifying cells, ELCs are enterocyte-like cells, SPCs are secretory progenitor cells, EGCs are early goblet cells, GCs are goblet cells, EECs are enteroendocrine cells, and ENLCs are enteric neuron-like cells C. Relative cell proportions for each cluster in DMSO vs ISX9 treated HT29 cells. Red dots have FDR < 0.05 and mean absolute |log2FD| > 0.58 in ISX9 vs. MOCK treated cells. D. Feature blots of normalized expression values of EEC marker genes NEUROG3, PAX4, and INSM1. E. Peaks to genes linkage map of NEUROG3. Peaks show ATAC-seq peak accessibility at NEUROG3 regulatory regions, violin plot shows expression of NEUROG3, curved blue line shows significant correlation between peak accessibility and expression of NEUROG3. F. Peaks to genes linkage map of PAX4. Visualization is the same as in E. G. Number of differential accessible peaks in Mock and ISX9-integrated specific cell type cluster compared to all other clusters. All clusters are included except the TA cluster.
igure 2.
igure 2.. STAT3 promotes EEC differentiation in mucinous colorectal cancer.
A. Volcano plot showing transcription factor motif enrichment in differential accessible peaks in EECs vs non-EEC clusters. Red dots have a log2FC > 1.5 and p-value < 0.05. B. Representative immunofluorescence showing increased nuclear STAT3 (red) in HT29 cells treated with vehicle or ISX9 (40 μM) for 4hrs. Scale bars, 20 μm. Graph shows quantification of nuclear STAT3 +/− SEM (N=3). C. (Left) Western blot showing shRNA mediated knockdown of STAT3. (Right) qRT-PCR of EEC marker RNA expression in empty vector and STAT3 knockdown (STAT3 KD) HT29 cells. D. qRT-PCR of EEC markers after two consecutive 24hr treatments with vehicle or STAT3 inhibitor (Stattic, 10 μM). E. Representative immunofluorescence images of EEC marker INSM1 (green) in HT29 cells pre-treated for 24hrs with vehicle or Stattic (10 μM) prior to two consecutive 24hr co-treatments with vehicle or Stattic (10 μM) with vehicle or ISX9 (40 μM). Scale bars, 20 μm. F. (Left) Western blot showing shRNA mediated knockdown of JAK2 in HT29 cells. (Right) qRT-PCR of EEC markers in empty vector and JAK2 knockdown (JAK2 KD) HT29 cells. G. qRT-PCR of EEC markers after treating HT29 cells twice for 24hrs with vehicle or JAK2 inhibitor AZD-1480 (5 μM). H. Representative immunofluorescence images of STAT3 (red) in HT29 cells pre-treated with vehicle or BAPTA-AM (20 μM) for 1hr prior to treatment with vehicle or ISX9 (40 μM) for 4hrs. Scale bars, 10 μm. Graph shows quantification of nuclear STAT3 +/− SEM (N=3). I. qRT-PCR of EEC markers following pre-treatment of HT29 cells with vehicle or calcium chelator BAPTA-AM (20 μM) twice for 1hr prior to treatment with vehicle or ISX9 (40 μM) for 24hrs. I. Significance was determined by Student’s t-test (B,C, D, F, and G) and one-way ANOVA with Tukey pairwise multiple comparison testing (H and I). *P≤ 0.05, ** P ≤ 0.01, *** P ≤ 0.001, **** P ≤ 0.0001.
Figure 3.
Figure 3.. LSD1 interacts with and demethylates STAT3 to promote EEC differentiation.
A. Western blot of LSD1 immunoprecipitation (IP) and Dimethyl-lysine (DmeK) IP performed using nuclear lysates prepared from HT29 cells treated with vehicle or ISX9 (40 μM) for 4hrs. IgG IP serves as a negative control. B. Western blot of LSD1 IP performed using nuclear lysates prepared from SW403 cells treated as in A. IgG IP serves as a negative control. C. Western blot of DmeK IP performed using nuclear lysates prepared from HT29 cells pre-treated with vehicle or LSD1 inhibitor Corin (50 nM) for 24hrs prior to co-treatment with vehicle or Corin (50 nM) with vehicle or ISX9 (40 μM) for 4hrs. IgG IP serves as a negative control. D. qRT-PCR of EEC marker RNA expression after treating cells with vehicle or Corin (50 nM) for 24hrs. E. qRT-PCR of EEC markers after pre-treating cells with vehicle or Corin (50 nM) for 24hrs prior to two consecutive 24hr co-treatments of vehicle or Corin (50 nM) with vehicle or ISX9 (40 μM). F. Western blot of LSD1 IP performed using nuclear lysates prepared from SW480 (non-mucinous) or NCI-H508 (mucinous) cells treated as in A. Significance was determined by Student’s t-test (D), one-way ANOVA with Tukey pairwise multiple comparison testing (E). ** P ≤ 0.01, *** P ≤ 0.001, **** P ≤ 0.0001.
Figure 4.
Figure 4.. CoREST2 interacts with LSD1 and STAT3 to promote EEC differentiation.
A. Individual UMAP plots showing the expression of RCOR1, RCOR2, or RCOR3 in individual cells from normal colon, HT29, and NCI-H508 scRNA-seq samples. B. Representative immunofluorescence images of EEC marker BETA-3-TUBULIN (β3T, green) and CoREST2 (red) in empty vector, CoREST1 knockdown (KD), CoREST2 KD, and CoREST3 KD HT29 cells. Scale bars, 40 μm. Graphs show quantification of percent B3T-positive (left), percent CoREST2-positive (middle), and percent β3T-positive of CoREST2-positive cells (right). C. qRT-PCR of RCOR2 and EEC marker RNA expression in empty vector and CoREST2 KD cells. D. Western blot of FLAG immunoprecipitation (IP) performed using nuclear lysates prepared form HT29 cells transduced with a plasmid containing FLAG tagged CoREST2 overexpression (CoREST2 OE FLAG) and treated with vehicle or ISX9 (40 μM) for 4hrs. IgG IP serves as a negative control. E. Dimethyl-lysine (DmeK) IP performed using nuclear lysates prepared from empty vector and CoREST2 KD HT29 cells treated with vehicle or ISX9 (40 μM) for 4hrs. F. qRT-PCR of RCOR2 and EEC markers in HT29 cells transduced with an empty vector or CoREST2 OE FLAG plasmid. G. Western blot of FLAG IP performed using nuclear lysates prepared form empty vector and CoREST1 KD HT29 cells transduced with CoREST2 OE FLAG plasmid and treated with ISX9 (40 μM) for 4hrs. IgG IP serves as a negative control. H. qRT-PCR of RCOR1 and RCOR2 (top) and EEC markers (bottom) in empty vector and CoREST1 KD HT29 cells transduced with an empty vector or CoREST2 OE FLAG plasmid. Significance was determined by one-way ANOVA with Tukey pairwise multiple comparison testing (B and G) and by Student’s t-test (C). *P≤ 0.05, ** P ≤ 0.01, *** P ≤ 0.001, **** P ≤ 0.0001.
Figure 5.
Figure 5.. LSD1 and CoREST2 regulate STAT3 chromatin binding.
A. Metagenomic heatmap for STAT3 CUT&RUN prepared from HT29 cells treated with vehicle or ISX9 (40 μM) for 4hrs. B. Gene Ontology enrichment analysis on genes associated with peaks from STAT3 CUT&RUN prepared from HT29 cells treated with ISX9. C. Gene Ontology analysis on peaks from FLAG CUT&RUN prepared from CoREST1 knockdown (KD) cells that overexpress CoREST2-FLAG. D. Gene tracks of CoREST2-FLAG enrichment upstream of ZNF800 (top) and SOX4 (bottom). Empty vector is a negative control in which cells contain two empty vector plasmids that do not express FLAG. E. Gene tracks showing enrichment of both STAT3 and CoREST2-FLAG upstream of INSM1 (left) and SHH (right). F. Western blot of chromatin lysate prepared from empty vector cells and LSD1 KD cells treated with vehicle or ISX9 (40 μM) for 4hrs. Whole cell extract (WCE) serves as a control for chromatin extract. Graph shows results of densitometry quantification +/− SEM (N=5). G. Western blot of chromatin lysate prepared from empty vector cells and CoREST2 KD cells treated as in F. Graph shows results of densitometry quantification +/− SEM (N=3). Significance was determined by one-way ANOVA with Tukey pairwise multiple comparison testing (F and G). *P≤ 0.05, ** P ≤ 0.01.
Figure 6.
Figure 6.. CoREST2 knockdown decreases tumor growth and lung metastases.
A. Cell viability of empty vector, CoREST1 knockdown (KD), CoREST2 KD, and CoREST3 KD HT29 cells. B. Clonogenic growth in empty vector, CoREST1 KD, CoREST2 KD, and CoREST3 KD HT29 cells. Graph is quantification the number of colonies per well relative to empty vector +/− SEM (N=6). C. Representative images of luciferase activity in colon and chest region of empty vector, CoREST1 KD, and CoREST2 KD HT29 cells orthotopically injected into colons of NSG mice at 2 weeks post-injection. Graphs show mean luciferase activity for each group in colon and chest regions +/− SEM (N=5 per group). D. Endpoint images of mouse colons with attached tumors at 3 weeks post-injection. E. Representative immunofluorescent images of Ki67 (green) and TdTomato+ (red, tumor cells) of colon tumor sections. Scale bars, 40μm. F. Representative immunofluorescent images of TdTomato+ tumor cells (red) in lung tissue sections. Scale bars, 100 μm. Graph shows quantification of number of metastases formed +/− SEM (N=5 for empty vector and CoREST2 KD; N=3 for CoREST1 KD). Significance was determined by one-way ANOVA with Dunnet pairwise multiple comparison testing (A+B) and Kruskal-Wallis with Dunn’s multiple comparison testing (E). *P≤ 0.05, ** P ≤ 0.01, *** P ≤ 0.001, **** P ≤ 0.0001.
Figure 7.
Figure 7.. Enteric neuron-like cells are a rare non-secretory cell type in mucinous colorectal cancer.
A. UMAP dot plots of normalized expression values of enteric neuron-like cell (ENLC) marker genes AKAP12, THBS2, and PRSS23 in HT29 cell scRNA-seq data from Figure 1. B. Dot plot showing various marker gene expression in ISX9 treated samples across all annotated cell types. The size of the dot is proportional to the percentage of cells that express a given gene, and the color scale indicates the average scaled gene expression within the specific cell population. C. Representative immunofluorescence images of ENLC marker AKAP12 (red) in HT29 cells treated with two consecutive 24hr treatments of VEHICLE or ISX9 (40 μM). Scale bars, 40 μm. Graph shows quantification of percent AKAP12-positive cells +/− SEM (N=3). D. (Left) Diffusion map of ISX9 treated cells arranged in diffusion pseudotime; (Right) annotated diffusion map. E. Top 30 transcription factors based on eigenvector centrality from ENLC gene regulatory network (GRN). F. RNA velocity plot showing cell identity shift following KLF6 simulated knockout (left) and randomized simulated vector (right). G. RNA velocity plot showing cell identity shift following KLF6 simulated overexpression (left) and randomized simulated vector (right). H. qRT-PCR of KLF6, ENLC marker AKAP12, and EEC marker NEUROG3 RNA expression in empty vector and KLF6 knockdown (KD) cells. I. Representative immunofluorescence images of ENLC marker AKAP12 (green) and TdTomato+ (red) of colon tumor from empty vector HT29 cells injected orthotopically into the colon of NSG mice. Scale bars, 30 μm J. Representative AKAP12 immunohistochemistry staining of normal colon and colon tumors from human colon tumor microarray. Scale bars, 50 μm. Significance was determined by Student’s t-test (C), one-way ANOVA with Dunnet pairwise multiple comparison testing (H). *P≤ 0.05, ** P ≤ 0.01, *** P ≤ 0.001, **** P ≤ 0.0001.

References

    1. Marusyk A, Janiszewska M, Polyak K. Intratumor Heterogeneity: The Rosetta Stone of Therapy Resistance. Cancer Cell 2020;37:471–484. - PMC - PubMed
    1. Fisher R, Pusztai L, Swanton C. Cancer heterogeneity: implications for targeted therapeutics. British Journal of Cancer 2013;108:479–85. - PMC - PubMed
    1. Bapat SA, Mali AM, Koppikar CB, Kurrey NK. Stem and Progenitor-Like Cells Contribute to the Aggressive Behavior of Human Epithelial Ovarian Cancer. Cancer Research 2005;65:3025–29. - PubMed
    1. Chen J, Li Y, Yu T-S, Mckay RM, Burns DK, Kernie, SG, et al. A restricted cell population propagates glioblastoma growth after chemotherapy. Nature 2012;488:522–26. - PMC - PubMed
    1. Oronksky B, Ma PC, Morgensztern D, Carter CA. Nothing But NET: A Review of Neuroendocrine Tumors and Carcinomas. Neoplasia 2017;19:991–1002. - PMC - PubMed

MeSH terms