. 2024 Nov 1;327(5):H1309-H1326.
doi: 10.1152/ajpheart.00272.2024. Epub 2024 Oct 4.

Nanoscale organization of cardiac calcium channels is dependent on thyroid hormone status

Affiliations

Nanoscale organization of cardiac calcium channels is dependent on thyroid hormone status

Amanda Charest et al. Am J Physiol Heart Circ Physiol. .

Abstract

Thyroid hormone dysfunction is frequently observed in patients with chronic illnesses including heart failure, which increases the risk of adverse events. This study examined the effects of thyroid hormones (THs) on cardiac transverse-tubule (TT) integrity, Ca2+ sparks, and nanoscale organization of ion channels in excitation-contraction (EC) coupling, including L-type calcium channel (CaV1.2), ryanodine receptor type 2 (RyR2), and junctophilin-2 (Jph2). TH deficiency was established in adult female rats by propyl-thiouracil (PTU) ingestion for 8 wk; followed by randomization to continued PTU without or with oral triiodo-l-thyronine (T3; 10 µg/kg/day) for an additional 2 wk (PTU + T3). Confocal microscopy of isolated cardiomyocytes (CMs) showed significant misalignment of TTs and increased Ca2+ sparks in thyroid-deficient CMs. Density-based spatial clustering of applications with noise (DBSCAN) analysis of stochastic optical reconstruction microscopy (STORM) images showed decreased (P < 0.0001) RyR2 cluster number per cell area in PTU CMs compared with euthyroid (EU) control myocytes, and this was normalized by T3 treatment. CaV1.2 channels and Jph2 localized within a 210 nm radius of the RyR2 clusters were significantly reduced in PTU myocytes, and these values were increased with T3 treatment. A significant percentage of the RyR2 clusters in the PTU myocytes had neither CaV1.2 nor Jph2, suggesting fewer functional clusters in EC coupling. Nearest neighbor distances between RyR2 clusters were greater (P < 0.001) in PTU cells compared with EU- and T3-treated CMs that correspond to disarray of TTs at the sarcomere z-discs. These results support a regulatory role of T3 in the nanoscale organization of RyR2 clusters and colocalization of CaV1.2 and Jph2 in optimizing EC coupling.NEW & NOTEWORTHY Thyroid hormone (TH) dysfunction exacerbates preexisting heart conditions leading to an increased risk of premature morbidity/mortality. Triiodo-l-thyronine (T3) optimizes cardiac excitation-contraction (EC) coupling by maintaining myocardial T-tubule (TT) structures and organization of calcium ion channels. Single-molecule localization microscopy shows T3 effects on the clustering of ryanodine receptors (RyR2) with colocalization of L-type calcium channels (CaV1.2) and junctophilin-2 (Jph2) at TT-SR structures. Heart disease with subclinical hypothyroidism/low T3 syndrome may benefit from TH treatment.

Keywords: L-type calcium channel; STORM; junctophilin-2; ryanodine receptor-2; thyroid.


Conflict of interest statement

No conflicts of interest, financial or otherwise, are declared by the authors.

Figures

Figure 1.
Figure 1.
Animal model physiological parameters. A–C: body weights (in g) of animals in each experimental group (euthyroid, EU; hypothyroid, PTU; PTU plus T3 treated, PTU + T3) at the study terminus (A), plasma total 3,5,3′,5′-tetraiodo-l-thyronine or thyroxine (T4) (B), and 3,3′,5-triiodo-l-thyronine (T3) (C) measured at the end of the study. Data are means ± SD, dots are individual animal values; 5 to 6 animals/group. Statistical analysis used one-way ANOVA, post hoc Tukey’s multiple comparisons test of group means. Significance between groups is indicated by brackets; *P < 0.05, **P < 0.01, and ****P < 0.0001.
Figure 2.
Figure 2.
Analysis of T-tubule structures. A: representative confocal images of cardiomyocytes from each treatment group (as described in legend of Fig. 1) stained with membrane specific di-8-ANEPPS dye. B: AutoTT analysis of transverse-oriented elements (TE) or T-tubules showing percent (%) TE density, and the index of TE-tubule integrity (TTint = TE density × TE regularity). Scatter plots show values of individual cells with group means ± SD of 4–8 cells per heart from 3 animals/group; statistical analysis used one-way ANOVA, post hoc Tukey’s multiple group comparisons; brackets between groups indicate significant differences of *P < 0.05, **P < 0.01, and ****P < 0.0001.
Figure 3.
Figure 3.
Analysis of calcium sparks in isolated ventricular myocytes. A: line-scanned images of representative cardiomyocytes from each study group (panels labeled EU, PTU, and PTU + T3), loaded with the calcium dye Fluo-4 are shown. Spontaneous Ca2+ spark images were captured by laser-scanning microscopy in line-scan mode. Scanning line (70 µm; x-axis) and scan time (in s; directional arrow in y-axis) are identical for all panels. SparkMaster software was used to measure Ca2+ spark characteristics. B: graph shows number of Ca2+ sparks generated over time. Box-and-whisker plot shows median values, box margins at 25th and 75th percentiles, whiskers at maximum/minimum values; each dot is the average value of 10–25 cells/heart; 4 animals in each group. Statistical analysis used one-way ANOVA, post hoc Tukey’s multiple group comparisons. **P < 0.01 between groups as indicated by brackets. EU, euthyroid; PTU, propyl-thiouracil; T3, triiodo-l-thyronine.
Figure 4.
Figure 4.
2-D STORM images of cardiomyocytes analyzed for RyR2 clusters and Jph2 localizations. Representative STORM images showing a defined “region of interest” (ROI = 3 × 10⁸ nm2) from EU (a), PTU (a), and PTU + T3 (a) cardiomyocytes. Localizations are individual arbitrarily color-coded spots that represent signals in the fluorescent channels corresponding to RyR2 (green) and Jph2 (magenta) immunolabeling. RyR2 and Jph2 localizations show alignment in organized rows corresponding to sarcomere z-lines (scale bar, 1 µm). Analysis of localizations in the STORM images of a images are shown in the corresponding b images EU (b), PTU (b), and PTU + T3 (b) (scale bar, 1 µm). DBSCAN of RyR2 localizations are joined by green mesh, and each cluster is encircled within a 210 nm radius from the cluster centroid (blue circles). Boxed areas (i) in each of the b images are enlarged in EU.i, PTU.i, and PTU + T3.i (scale bar, 250 nm). RyR2 image data analyses showed that 40%–80% of total RyR2 localizations within a cell area were clustered and that ∼10% to 30% of total Jph2 localized within the defined RyR2 cluster areas. 2-D, two-dimensional; DBSCAN, density-based spatial clustering of applications with noise; EU, euthyroid; Jph2, junctophilin-2; NNDs, nearest neighbor distances; PTU, propyl-thiouracil; ROI, region of interest; RyR, ryanodine receptor; STORM, stochastic optical reconstruction microscopy; T3, triiodo-l-thyronine.
Figure 5.
Figure 5.
Analysis of 2-D STORM images of RyR2 clusters and Jph2 colocalizations. Comparison of cluster numbers and localizations among treatment groups (EU, PTU, and PTU + T3) shown as violin plots indicating group median and quartiles (thick and thin horizonal lines) (individual points are averaged values of 2 ROIs per cell from 10 to 12 cells per heart from 5 or 6 animals per group). A: total number of RyR2 clusters per ROI identified by DBSCAN. B: number of RyR2 localizations in each cluster. C: NNDs between RyR2 clusters. D: number of Jph2 localizations quantified within the 210 nm search radius of each RyR2 cluster centroid. E: percentage of RyR2 clusters with no Jph2 localizations within the 210 nm search radius. Statistical analysis by one-way ANOVA, post hoc Tukey’s multiple comparisons test; P values between groups indicated by brackets. 2-D, two-dimensional; DBSCAN, density-based spatial clustering of applications with noise; EU, euthyroid; Jph2, junctophilin-2; NNDs, nearest neighbor distances; PTU, propyl-thiouracil; ROI, region of interest; RyR, ryanodine receptor; STORM, stochastic optical reconstruction microscopy; T3, triiodo-l-thyronine. **P < 0.01, ***P < 0.001, and ****P < 0.0001.
Figure 6.
Figure 6.
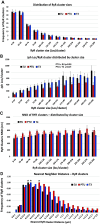
Histograms showing the distribution of RyR2 clusters by size. STORM images were analyzed by DBSCAN to identify RyR2 clusters and number of Jph2 colocalized with RyR2 clusters. Histogram shows RyR2 clusters segregated by size into bins of 25 localizations per cluster from 10 minimum localizations (loc) to 299 loc/cluster (displayed on x-axis). Bar graphs represent means ± SE of data averaged from 10 to 12 cells/heart of 5 to 6 animals per group [EU, PTU, and PTU + T3 (T3)]. Statistical analysis of data in each histogram used a linear mixed-effects model with Tukey’s post hoc pairwise comparisons. A: bars represent the number of RyR2 clusters (y-axis) in each bin. B: Jph2 localizations per cluster binned by RyR2 cluster size; LME statistical analysis showed differences between PTU vs. EU (P < 0.05) and PTU vs. T3 (P < 0.01). C: NNDs between RyR2 clusters based on cluster size. D: relative frequencies of RyR2 clusters (y-axis) distributed by NND between clusters (x-axis). *NND with the highest number of RyR2 clusters from each group with majority of RyR2 clusters from EU and T3 myocytes measuring 0.3–0.4-µm NND, whereas NND of clusters in PTU cells was 0.5–0.6 µm. DBSCAN, density-based spatial clustering of applications with noise; EU, euthyroid; Jph2, junctophilin-2; LME, linear mixed-effect; NNDs, nearest neighbor distances; PTU, propyl-thiouracil; ROI, region of interest; RyR, ryanodine receptor; STORM, stochastic optical reconstruction microscopy; T3, triiodo-l-thyronine.
Figure 7.
Figure 7.
3-D STORM images of RyR2 clusters and Jph2 localizations in ventricular myocytes. Representative 3-D STORM images of cardiomyocytes isolated from EU, PTU, and PTU + T3-treated animals. Localizations are individual arbitrarily color-coded spots that represent signals in the fluorescent channels corresponding to RyR2 (green) or Jph2 (magenta). a: subregions of an analyzed ROI (3 × 10¹¹ nm3) are shown to illustrate a 3-D view of the image [x, y, z planes indicated in EU (a)] with RyR2 clusters encircled by a sphere (blue lattice) measuring 210 nm radius from the cluster centroid, and individual Jph2 are seen as spots or localizations (scale bar is 1 µm at the front of the 3-D image). b: images are higher magnification of regions in corresponding images in a images (scale bar, 600 nm) illustrating RyR2 clusters (spots joined by green mesh) and Jph2 (magenta spots) inside and outside each sphere encircling a cluster. c: images illustrate higher magnification of individual RyR2 clusters within each sphere colocalized with Jph2 (scale bar, 200 nm). 3-D, three-dimensional; EU, euthyroid; Jph2, junctophilin-2; PTU, propyl-thiouracil; ROI, region of interest; RyR, ryanodine receptor; STORM, stochastic optical reconstruction microscopy; T3, triiodo-l-thyronine.
Figure 8.
Figure 8.
3-D STORM images of RyR2 clusters and CaV1.2 in ventricular myocytes. Representative 3-D images of cardiomyocytes from the three study groups (EU, PTU, and PTU + T3) are illustrated as described in legend to Fig. 7 showing localizations of RyR2 (green mesh) clustered within 210 nm radius spheres (blue lattice). Localizations of CaV1.2 (yellow spots) appear within and outside the spheres. Images in b and c are magnified subregions of the ROIs shown in corresponding a images. Scale bars are indicated. 3-D, three-dimensional; EU, euthyroid; PTU, propyl-thiouracil; ROI, region of interest; RyR, ryanodine receptor; STORM, stochastic optical reconstruction microscopy; T3, triiodo-l-thyronine.
Figure 9.
Figure 9.
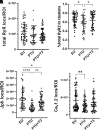
Analysis of RyR2 clusters in captured 3-D STORM images. Comparison of RyR2 clusters among study groups (EU, PTU, and PTU + T3) presented as violin plots showing group median (thick line) with first and third quartiles (thin horizonal lines) (individual points are averaged values of 2 ROIs per cell from 8 to 10 cells per heart from 5 animals per group). A–C: total number of RyR2 clusters per ROI (volume) (A), RyR2 cluster size is the distance between the furthest two RyR2 localizations in the cluster (B), and RyR2 cluster volume created by connecting the perimeter RyR2 localizations in the cluster (C; 3-D mesh in Fig. 8). D: number of RyR2 localizations per cluster analyzed by DBSCAN. E: NNDs between RyR2 clusters. Statistical analysis used one-way ANOVA, post hoc Tukey’s multiple comparisons test; P values between groups indicated by brackets. *P < 0.05 and ****P < 0.0001. Statistical analysis between PTU and PTU + T3 used unpaired t test with Welch’s correction, γP < 0.001. 3-D, three-dimensional; DBSCAN, density-based spatial clustering of applications with noise; EU, euthyroid; NNDs, nearest neighbor distances; PTU, propyl-thiouracil; ROI, region of interest; RyR, ryanodine receptor; STORM, stochastic optical reconstruction microscopy; T3, triiodo-l-thyronine.
Figure 10.
Figure 10.
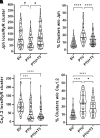
Jph2 and CaV1.2 localizations per RyR2 cluster analyzed in 3-D STORM images. Quantitation of Jph2 and CaV1.2 localizations within a sphere of 210 nm radius of the RyR2 cluster centroid are shown as violin plots as described in legend to Fig. 9. A: Jph2 localizations within the RyR2 cluster sphere. B: percentage of total RyR2 clusters in the cell area measured (ROI volume) without any associated Jph2. C: CaV1.2 localizations per cluster sphere. D: percentage of all clusters without CaV1.2. Statistical analysis comparing study groups (EU, PTU, and PTU + T3) used one-way ANOVA, post hoc Tukey’s multiple comparisons test; P values between groups indicated by brackets. γP = 0.06, *P < 0.05, ***P < 0.001, and ****P < 0.0001. 3-D, three-dimensional; EU, euthyroid; Jph2, junctophilin-2; PTU, propyl-thiouracil; ROI, region of interest; RyR, ryanodine receptor; STORM, stochastic optical reconstruction microscopy; T3, triiodo-l-thyronine
Figure 11.
Figure 11.
3-D STORM image analysis of cardiomyocyte RyR2, Jph2, and CaV1.2 channels. Cell area or ROI in 3-D longitudinal images of cardiomyocytes covered 10 sarcomeres and measured 3 × 10¹¹ nm3. Scatter plots show individual values averaged from 2 ROIs of 8–10 cells/heart from 5 animals/group. Means ± SD are shown for each group (EU, PTU, and PTU + T3). A: total RyR2 localizations in each ROI. B: percentage of total RyR2 in each ROI that were clustered by DBSCAN analysis. C and D: total number of Jph2 (C) and CaV1.2 (D) localizations within a 210-nm sphere of the RyR2 cluster centroid. Statistical analysis of group means used one-way ANOVA, post hoc Tukey’s multiple group comparisons. 3-D, three-dimensional; DBSCAN, density-based spatial clustering of applications with noise; EU, euthyroid; Jph2, junctophilin-2; PTU, propyl-thiouracil; ROI, region of interest; RyR, ryanodine receptor; STORM, stochastic optical reconstruction microscopy; T3, triiodo-l-thyronine. *P < 0.05, **P < 0.01, and ****P < 0.0001.
Figure 12.
Figure 12.
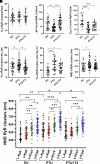
3-D STORM image analysis of small RyR2 clusters comprising of 4–9 localizations. Quantitation of RyR clusters, Jph2, and CaV1.2 localizations are as described in Figs. 9 and 10 legends. Scatter plots are individual values of 8 cells/heart from 3 animals/group. Means ± SD are shown for each group (EU, PTU, and PTU + T3). A: small RyR (s-RyR) clusters as percentage of total RyR clusters per ROI. B and C: total number of Jph (B) and CaV1.2 (C) localizations per s-RyR cluster. D and E: percentage of s-RyR clusters without associated Jph2 (D) or CaV1.2 (E). F: NNDs between s-RyR clusters in each study group. G: comparisons of NNDs among RyR clusters; L-RyR are large clusters of ≥10 localizations/cluster; s-RyR are small clusters (4–9 locs); s-0Cav are s-RyR without CaV1.2; s-0Jph are s-RyR without Jph2. Statistical analysis used one-way ANOVA, post hoc Tukey’s multiple group comparisons; lines/brackets between groups indicate significance at *P < 0.05, **P < 0.01, ***P < 0.001, and ****P < 0.0001. 3-D, three-dimensional; EU, euthyroid; Jph2, junctophilin-2; NNDs, nearest neighbor distances; PTU, propyl-thiouracil; ROI, region of interest; RyR, ryanodine receptor; STORM, stochastic optical reconstruction microscopy; T3, triiodo-l-thyronine.

Comment in

References

    1. Gerdes AM, Ojamaa K. Thyroid hormone and cardioprotection. Compr Physiol 6: 1199–1219, 2016. doi:10.1002/cphy.c150012. - DOI - PubMed
    1. Jabbar A, Pingitore A, Pearce SH, Zaman A, Iervasi G, Razvi S. Thyroid hormones and cardiovascular disease. Nat Rev Cardiol 14: 39–55, 2017. doi:10.1038/nrcardio.2016.174. - DOI - PubMed
    1. Klein I, Ojamaa K. Thyroid hormone and the cardiovascular system. N Engl J Med 344: 501–509, 2001. doi:10.1056/NEJM200102153440707. - DOI - PubMed
    1. Galli E, Pingitore A, Iervasi G. The role of thyroid hormone in the pathophysiology of heart failure: clinical evidence. Heart Fail Rev 15: 155–169, 2010. doi:10.1007/s10741-008-9126-6. - DOI - PubMed
    1. Kannan L, Shaw PA, Morley MP, Brandimarto J, Fang JC, Sweitzer NK, Cappola TP, Cappola AR. Thyroid dysfunction in heart failure and cardiovascular outcomes. Circ Heart Fail 11: e005266, 2018. doi:10.1161/CIRCHEARTFAILURE.118.005266. - DOI - PMC - PubMed

MeSH terms

LinkOut - more resources