. 2024 Oct 4;10(40):eadq3591.
doi: 10.1126/sciadv.adq3591. Epub 2024 Oct 4.

Conditional lethality profiling reveals anticancer mechanisms of action and drug-nutrient interactions

Affiliations

Conditional lethality profiling reveals anticancer mechanisms of action and drug-nutrient interactions

Kyle M Flickinger et al. Sci Adv. .

Abstract

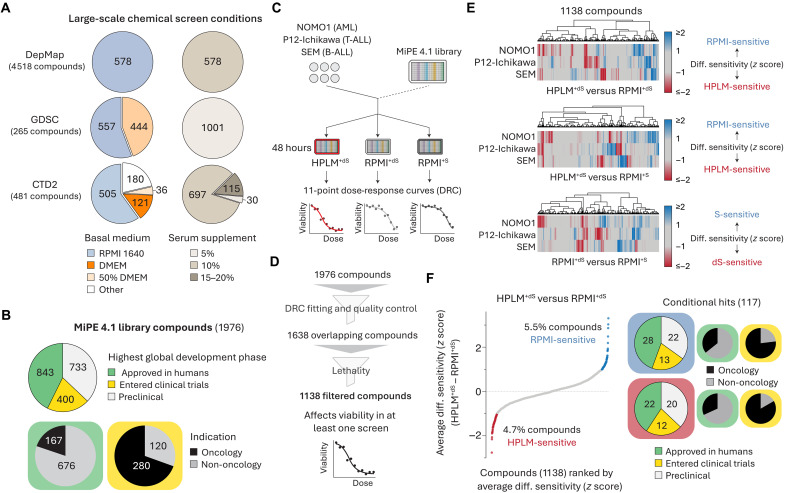
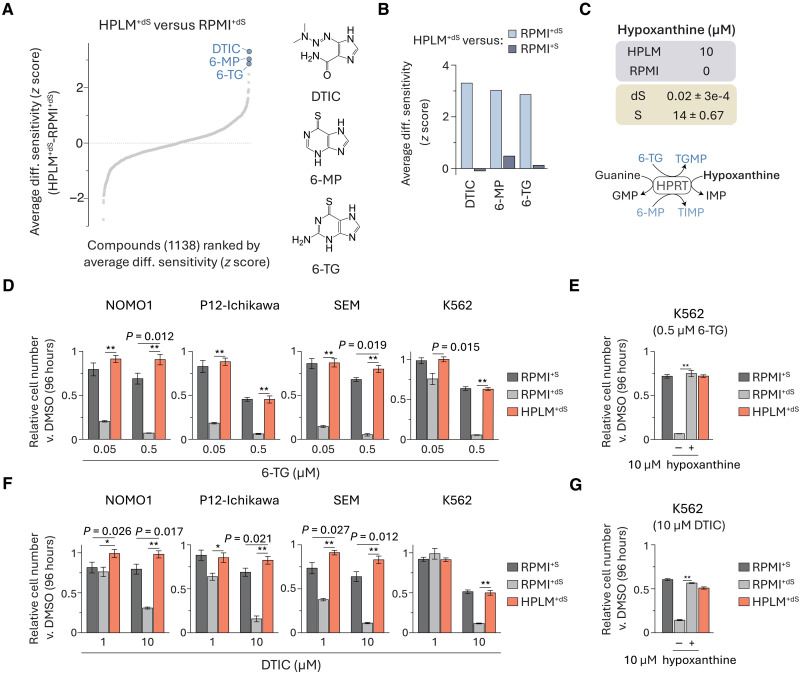
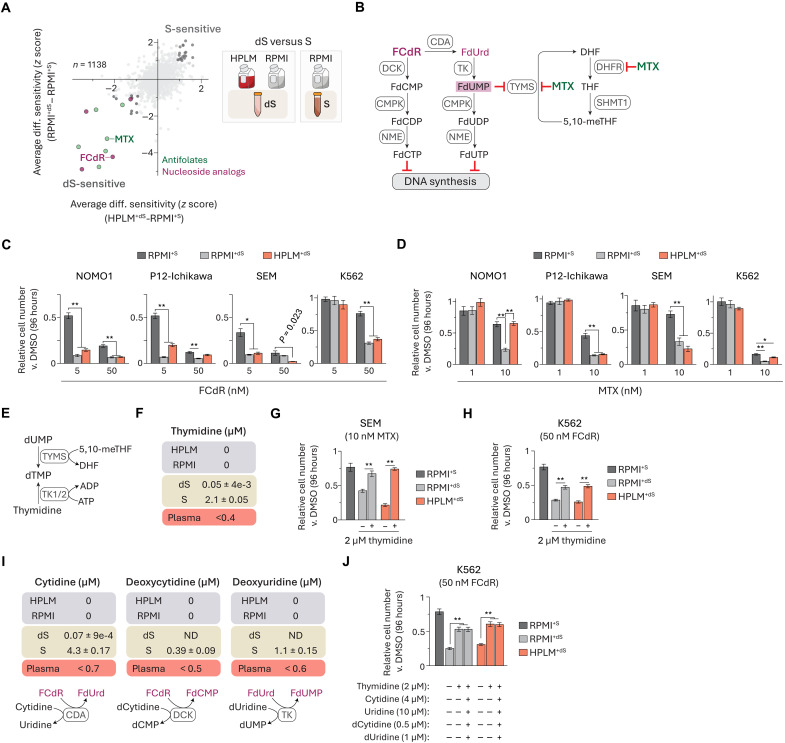
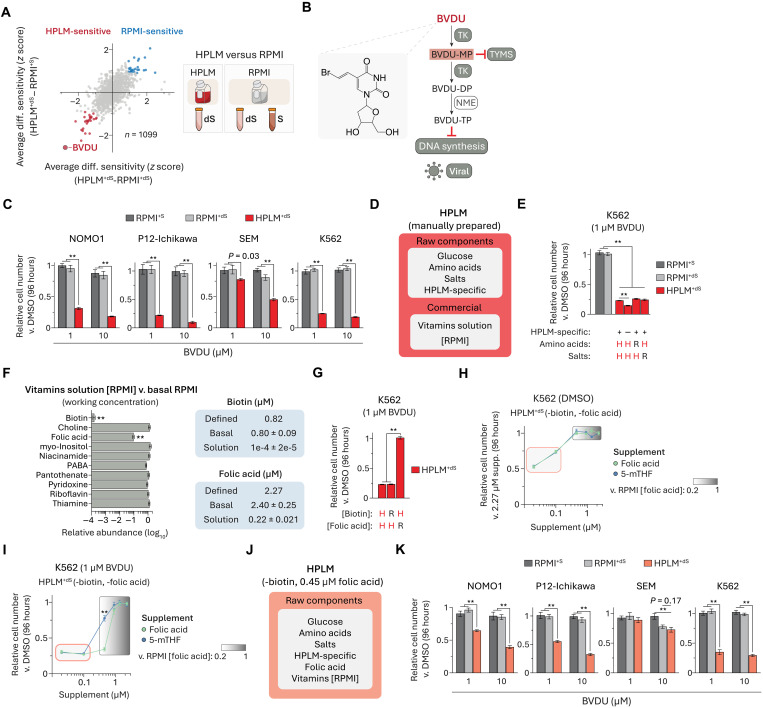
Chemical screens across hundreds of cell lines have shown that the drug sensitivities of human cancers can vary by genotype or lineage. However, most drug discovery studies have relied on culture media that poorly reflect metabolite levels in human blood. Here, we perform drug screens in traditional and Human Plasma-Like Medium (HPLM). Sets of compounds that show conditional anticancer activity span different phases of global development and include non-oncology drugs. Comparisons of the synthetic and serum-derived components that comprise typical media trace sets of conditional phenotypes to nucleotide synthesis substrates. We also characterize a unique dual mechanism for brivudine, a compound approved for antiviral use. Brivudine selectively impairs cell growth in low folate conditions by targeting two enzymes involved in one-carbon metabolism. Cataloged gene essentiality data further suggest that conditional phenotypes for other compounds are linked to off-target effects. Our findings establish general strategies for identifying drug-nutrient interactions and mechanisms of action by exploiting conditional lethality in cancer cells.


Figures

Fig. 1.
Fig. 1.. High-throughput screens reveal compounds with conditional anticancer activity.
(A) Growth conditions across chemical screens from the DepMap, GDSC, and CTD2 projects. Fifty percent DMEM refers to basal media containing DMEM and another synthetic medium in a 1:1 mixture. (B) Highest global development phase and indication for compounds in the MiPE 4.1 library. (C) Schematic for chemical screens in blood cancer cell lines. AML, acute myeloid leukemia; B-ALL, B cell acute lymphoblastic leukemia; T-ALL, T cell ALL. (D) Schematic for dose-response curve quality control and filtering strategies to establish a set of overlapping compounds across chemical screen datasets. (E) Cluster maps showing conditional lethality phenotypes in three cell lines. (F) Compounds ranked by average HPLM+dS-RPMI+dS phenotypes across three cell lines. Highest global development phase and indication for conditional hits.
Fig. 2.
Fig. 2.. Conditional phenotypes for purine analogs are linked to hypoxanthine.
(A) Compounds ranked by average HPLM+dS-RPMI+dS phenotypes. (B) Conditional phenotypes for DTIC, 6-MP, and 6-TG from averaged HPLM+dS-RPMI+dS and HPLM+dS-RPMI+S profiles. (C) Defined hypoxanthine levels in HPLM and RPMI. Concentrations of hypoxanthine in 10% FBS (dS, dialyzed; S, untreated) (mean ± SD, n = 3). Schematic of reactions catalyzed by HPRT. (D to G) Relative growth of cells treated with 6-TG [(D) and (E)] or DTIC [(F) and (G)] versus DMSO (mean ± SD, n = 3, **P < 0.005 and * P < 0.01).
Fig. 3.
Fig. 3.. Serum-derived thymidine alters cellular sensitivity to TYMS inhibitors.
(A) Comparison of averaged HPLM+dS-RPMI+S and RPMI+dS-RPMI+S phenotypes. dS-sensitive pyrimidine nucleoside analogs (purple) and antifolates (green). FCdR, fluorodeoxycytidine; MTX, methotrexate. (B) FCdR is converted to effector metabolites (left). MTX can inhibit TYMS and DHFR (right). (C and D) Relative growth of cells treated with FCdR (C) or MTX (D) versus DMSO (mean ± SD, n = 3, *P < 0.01, **P < 0.005). (E) Reactions catalyzed by thymidine kinase (TK) and TYMS generate dTMP. (F and I) Thymidine (F), cytidine, deoxycytidine, and deoxyuridine (I) are not defined in HPLM or RPMI. Levels of each in 10% FBS (dS, dialyzed; S, untreated) (mean ± SD, n = 3) and reported concentration ranges in human plasma (100, 101). Reactions catalyzed by enzymes involved in FCdR metabolism that can also act on these pyrimidines (I). (G and H) Relative growth of cells treated with MTX (G) or FCdR (H) versus DMSO (mean ± SD, n = 3, **P < 0.005). (J) Relative growth of cells treated with FCdR versus DMSO (mean ± SD, n = 3, **P < 0.005).
Fig. 4.
Fig. 4.. Conditional BVDU sensitivity is linked to folic acid availability.
(A) Comparison of averaged HPLM+dS-RPMI+dS and HPLM+dS-RPMI+S phenotypes. (B) Schematic for the activation and canonical mechanism of BVDU in virally infected cells. Viral TK catalyzes reactions that convert BVDU to its mono (BVDU-MP) and diphosphate (BVDU-DP) forms. BVDU-MP can inhibit human and viral TYMS. BVDU-DP is metabolized to the active triphosphate derivative (BVDU-TP) that inhibits viral DNA polymerase. (C and K) Relative growth of cells treated with BVDU versus DMSO (mean ± SD, n = 3, **P < 0.005). (D) Components of manually prepared HPLM. (E and G) Relative growth of cells treated with BVDU versus DMSO (mean ± SD, n = 3, **P < 0.005). H, HPLM-defined concentrations. R, RPMI-defined concentrations. See table S2. (F) Relative working concentrations in commercial solution (Sigma-Aldrich, R7256, lot RNBB7627) versus basal RPMI (lot 2458379) (mean ± SD, n = 3, **P < 0.005). Defined and working concentrations of biotin and folic acid (mean ± SD, n = 3). PABA, para-aminobenzoic acid. (H) Relative growth of K562 cells in biotin- and folic acid–deficient HPLM+dS supplemented with folic acid or 5-methyltetrahydrofolate (5-mTHF) (mean ± SD, n = 3). Red-outlined box, reported range in human plasma (see fig. S4). Gradient-shaded box, range from 0.45 to 2.27 μM. (I) Relative growth of K562 cells treated with BVDU versus DMSO in biotin- and folic acid–deficient HPLM+dS supplemented with folic acid or 5-mTHF (mean ± SD, n = 3, **P < 0.005). (J) Components of a modified HPLM that lacks biotin and contains 0.45 μM folic acid. HPLM-based media used for experiments are distinguished by the shading used in this panel and in (D).
Fig. 5.
Fig. 5.. TK2 expression is an intrinsic determinant of BVDU sensitivity.
(A and D) Cellular abundances of BVDU (left) and BVDU-MP (right) following BVDU treatment (mean ± SEM, n = 3, **P < 0.005). (B) Immunoblot for expression of TK2. Molecular weight (MW) standards are annotated. ACTB served as the loading control. S.E., short exposure; L.E., long exposure. TK2 cDNA was fused to 3xFLAG. (C) Relative growth of cells treated with BVDU versus DMSO (mean ± SD, n = 3, **P < 0.005). (E) Relative growth of TK2-knockout and control cells treated with BVDU versus vehicle-treated control cells in HPLM+dS (mean ± SD, n = 3, **P < 0.005).
Fig. 6.
Fig. 6.. BVDU-MP interferes with folate-dependent nucleotide synthesis.
(A) Relative growth of cells treated with BVDU versus DMSO (mean ± SD, n = 3, **P < 0.005). H, HPLM-defined concentration (0.45 μM); R, RPMI-defined concentration (2.27 μM). (B) Relative growth of TYMS-knockout and control cells versus control cells in HPLM+dS (mean ± SD, n = 3, **P < 0.005). (C) Relative abundances of ATP, GTP, and dTTP in BVDU-treated and control cells versus control cells in HPLM+dS (mean ± SEM, n = 3, **P < 0.005). (D and E) Heatmap of cellular abundances for indicated metabolites in BVDU-treated and control cells versus control cells in HPLM+dS (n = 3). (F and G) Relative abundances of ATP, GTP, and dTTP in FCdR- (F) and MTX-treated (G) versus control cells in HPLM+dS (mean ± SEM, n = 3, **P < 0.005). Drug doses selected to elicit growth defects comparable to those for BVDU-treated K562 cells in HPLM+dS. (H) Heatmap of cellular abundances for indicated metabolites in FCdR- and MTX-treated versus control cells in HPLM+dS (n = 3). (I) Relative NADP+ levels measured from DHFR activity assays following addition of MTX or BVDU-MP (mean ± SEM, n = 3, **P < 0.005). (J) Relative abundances of indicated folate species in BVDU- and MTX-treated versus control cells in HPLM+dS (mean ± SEM, n = 3, **P < 0.005).
Fig. 7.
Fig. 7.. CRISPR screens uncover genetic contributions to BVDU sensitivity.
(A) Schematic for genome-wide CRISPR screens in DMSO- and BVDU-treated K562 cells. (B) Comparison between DMSO- and BVDU-treated gene scores. Three types of screen hits are highlighted on the basis of differential gene score and essentiality. Essentiality cutoffs in each screen (origin, yellow hexagon). r, Pearson’s correlation coefficient. (C) Resistance-conferring hits. (D) Relative growth of ABCC4-knockout and control cells treated with BVDU versus vehicle-treated control cells in HPLM+dS (mean ± SD, n = 3, **P < 0.005). (E) Selectively essential BVDU-sensitizing hits. Dashed arrow indicates noncatalytic delivery of 10-formyl-THF to the purinosome. (F) Immunoblot for expression of TYMS in cells after treatment with DMSO, BVDU, FCdR, or MTX in HPLM+dS at indicated CETSA temperatures (top). Schematic depicting that the upper band corresponds to covalent ternary complex involving TYMS (bottom). (G) Comparison between DMSO- and BVDU-treated gene scores for a set of 23 genes involved in 1C metabolism (see table S4). Schematic of 1C metabolism. Yellow shading, encoding gene scored as essential in both screens. (H to J) Relative growth of SHMT2-knockout and control cells treated with BVDU versus vehicle-treated control cells in HPLM+dS (mean ± SD, n = 3, **P < 0.005 and *P < 0.01).
Fig. 8.
Fig. 8.. BVDU-MP affects the 10-formyl-THF synthetase activity of MTHFD1.
(A) Schematic for reactions catalyzed by MTHFD1 in 1C metabolism. MTHFD1 activities: S, 10-formyl-THF synthetase; C, 5,10-methynyl-THF cyclohydrolase; D, 5,10-meTHF dehydrogenase. (B) Relative growth of MTHFD1-knockout and control cells versus control cells in HPLM+dS (mean ± SD, n = 3, **P < 0.005). (C) LY-345899 can inhibit the CD activities of MTHFD1. (D to F) Relative growth of cells treated with LY-345899 versus DMSO (mean ± SD, n = 3, **P < 0.005). H, HPLM-defined concentration (0.45 μM); R, RPMI-defined concentration (2.27 μM). (G and H) Relative levels of indicated metabolites measured from MTHFD1(CD) (G) or multidomain MTHFD1 (H) activity assays following addition of LY-345899 or BVDU-MP (mean ± SEM, n = 3, **P < 0.005). (I) Proposed model for the dual-targeting mechanism of BVDU.
Fig. 9.
Fig. 9.. Conditional phenotypes for additional compounds are linked to folic acid.
(A) Comparison of averaged HPLM+dS-RPMI+dS and HPLM+dS-RPMI+S phenotypes. Highlighted hits can act on orthologs of DHFR. Canonical targets of SCH-79797 and TG100-115 are unrelated to 1C metabolism. (B to E) Relative growth of cells treated with SCH-79797 [(B) and (D)] or TG100-115 [(C) and (E)] versus DMSO (mean ± SD, n = 3, **P < 0.005).
Fig. 10.
Fig. 10.. Gene essentiality data suggest that other conditional phenotypes are linked to noncanonical mechanisms.
(A) Comparison of averaged HPLM+dS-RPMI+dS and HPLM+dS-RPMI+S phenotypes. (B, D, F, and H) Gene essentiality data for canonical targets of CB-839 (B), deguelin (D), apilimod (F), SB-612111 and JTC-801 (H). (C, E, G, I, and J) Relative growth of cells treated with CB-839 (C), deguelin (E), apilimod (G), SB-612111 (I), or JTC-801 (J) versus DMSO (mean ± SD, n = 3, **P < 0.005 and *P < 0.01).

Update of

References

    1. Swinney D. C., Anthony J., How were new medicines discovered? Nat. Rev. Drug Discov. 10, 507–519 (2011). - PubMed
    1. Moffat J. G., Vincent F., Lee J. A., Eder J., Prunotto M., Opportunities and challenges in phenotypic drug discovery: An industry perspective. Nat. Rev. Drug Discov. 16, 531–543 (2017). - PubMed
    1. Yu C., Mannan A. M., Yvone G. M., Ross K. N., Zhang Y.-L., Marton M. A., Taylor B. R., Crenshaw A., Gould J. Z., Tamayo P., Weir B. A., Tsherniak A., Wong B., Garraway L. A., Shamji A. F., Palmer M. A., Foley M. A., Winckler W., Schreiber S. L., Kung A. L., Golub T. R., High-throughput identification of genotype-specific cancer vulnerabilities in mixtures of barcoded tumor cell lines. Nat. Biotechnol. 34, 419–423 (2016). - PMC - PubMed
    1. Loewa A., Feng J. J., Hedtrich S., Human disease models in drug development. Nat. Rev. Bioeng. 1–15 (2023). - PMC - PubMed
    1. Horvath P., Aulner N., Bickle M., Davies A. M., Nery E. D., Ebner D., Montoya M. C., Östling P., Pietiäinen V., Price L. S., Shorte S. L., Turcatti G., von Schantz C., Carragher N. O., Screening out irrelevant cell-based models of disease. Nat. Rev. Drug Discov. 15, 751–769 (2016). - PubMed

LinkOut - more resources