. 2024 Oct 4;10(40):eadq4082.
doi: 10.1126/sciadv.adq4082. Epub 2024 Oct 4.

Shine and darkle the blood vessels: Multiparameter hypersensitive MR angiography for diagnosis of panvascular diseases

Affiliations

Shine and darkle the blood vessels: Multiparameter hypersensitive MR angiography for diagnosis of panvascular diseases

Wenyue Li et al. Sci Adv. .

Abstract

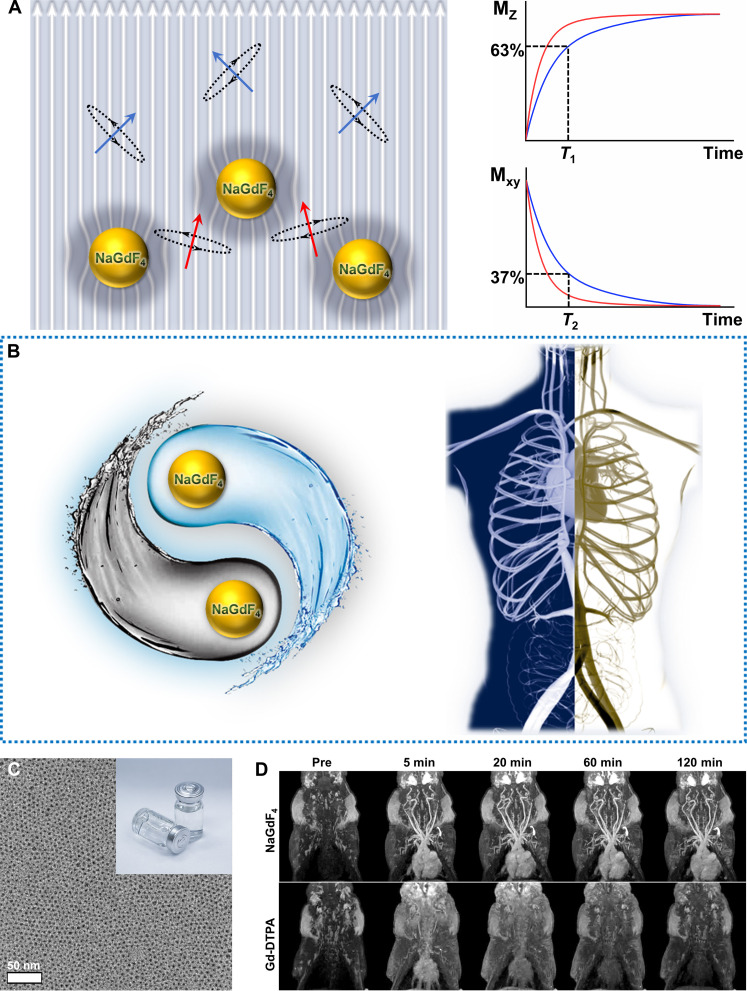
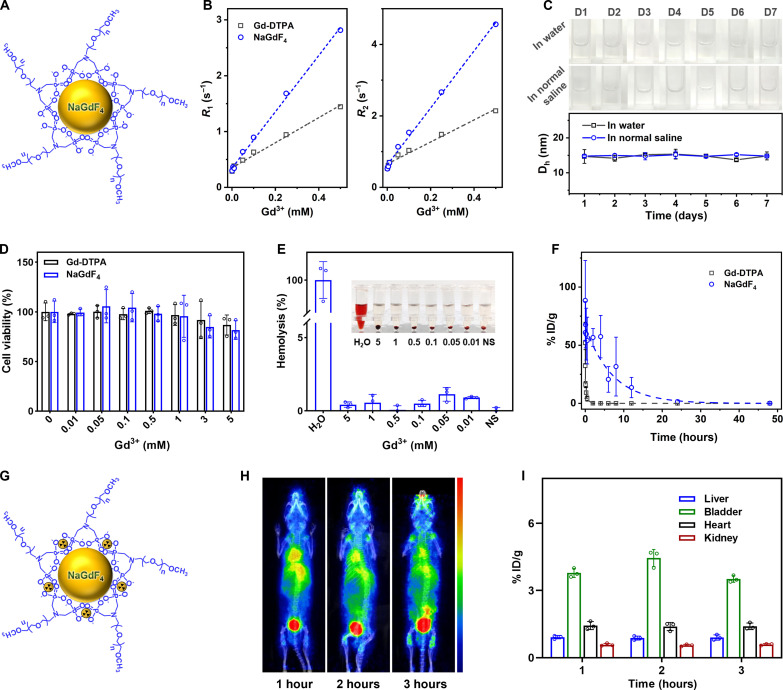
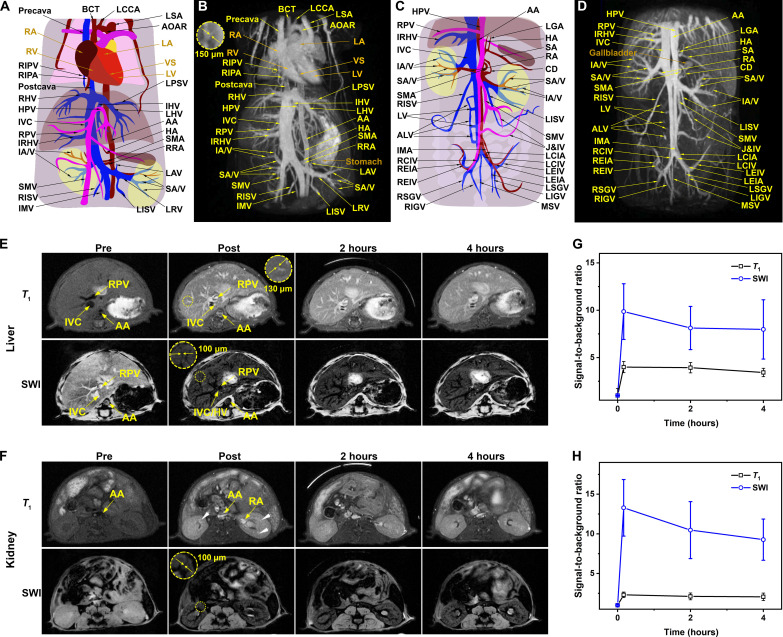
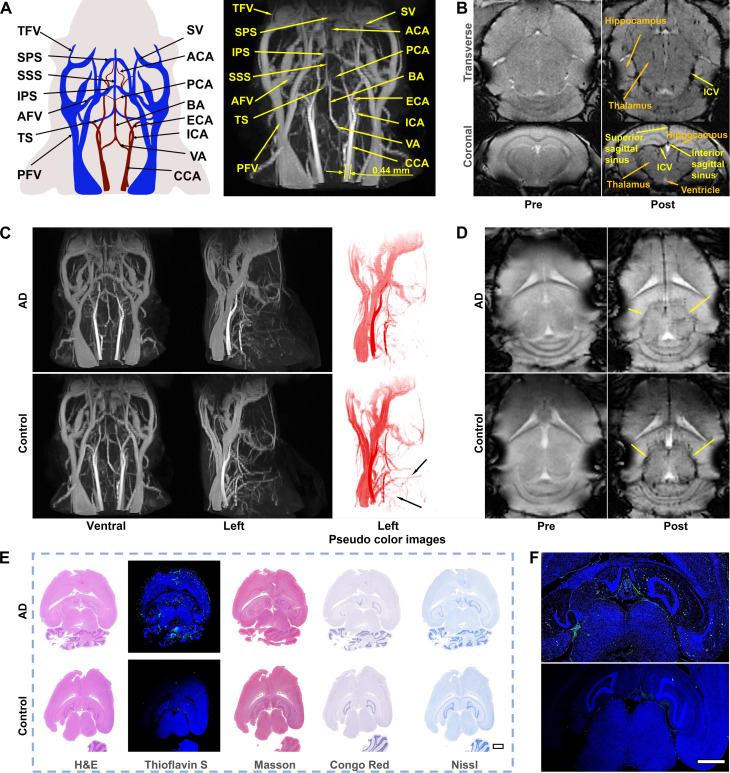
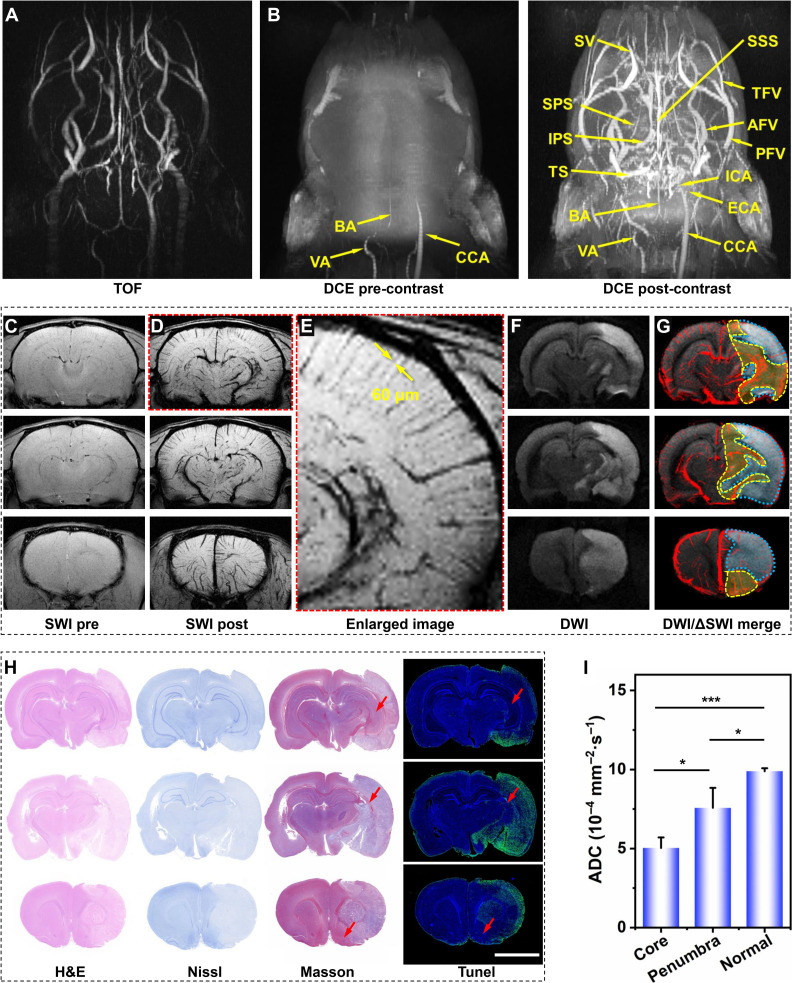
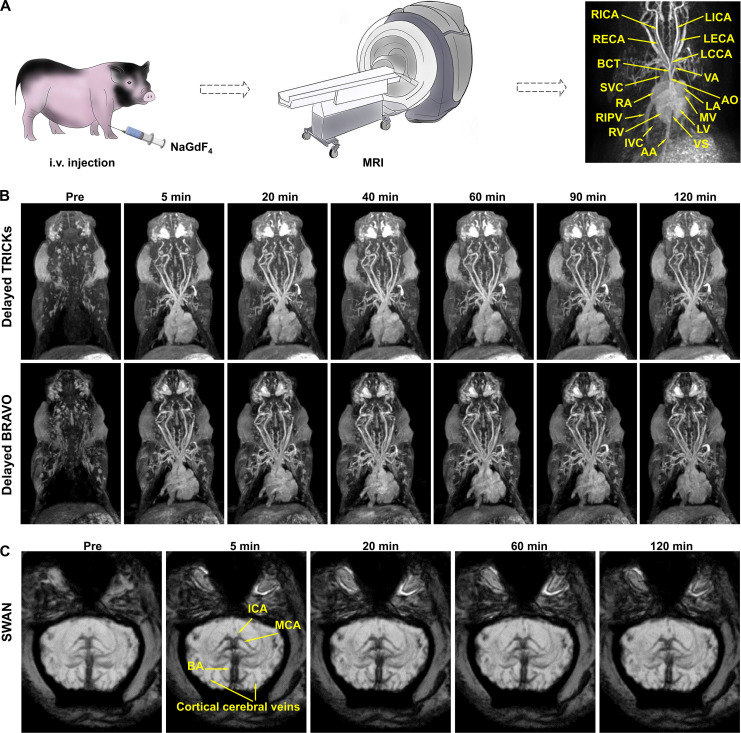
Magnetic resonance angiography (MRA) is pivotal for diagnosing panvascular diseases. However, single-modality MRA falls short in diagnosing diverse vascular abnormalities. Thus, contrast agents combining T1 and T2 effects are sought for multiparameter MRA with clinical promise, yet achieving a balance in T1 and T2 contrast enhancement effects remains a scientific challenge. Herein, we developed a hypersensitive multiparameter MRA strategy using dual-modality NaGdF4 nanoparticles. Because of the longer tumbling time (τR), NaGdF4 nanoparticles can improve the longitudinal relaxivity (r1), brightening vessels in T1-weighted sequences. Simultaneously, the regular arrangement of Gd3+ in the crystal induces magnetic anisotropy, creating local static magnetic field heterogeneity and generating negative signals in T2-weighted sequences. Consequently, the efficacy of NaGdF4-enhanced high-resolution multiparameter MRA has been validated in diagnosing ischemic stroke and Alzheimer's disease in rodent models. In addition, the dual-contrast imaging has been realized on swine with a clinical 3.0-T magnetic resonance imaging scanner, highly emphasizing the clinical translation prospect.


Figures

Fig. 1.
Fig. 1.. Illustration of the mechanism diagram and the TEM image and the MR images of NaGdF4.
(A) The mechanism diagram of ultrasmall Gd-doped inorganic nanoparticles NaGdF4 for hypersensitive dual-modality MRA. (B) The schematic diagram of dual shine and darkled blood vessels based on NaGdF4. (C) The transmission electron microscopy (TEM) image and the product picture of biocompatible NaGdF4 nanoparticles. (D) The MR images of swine with NaGdF4 nanoparticles and Gd-DTPA on a 3.0-T clinical MRI scanner (Note: The NaGdF4 enhanced angiograms shown in 1D are derived from Fig. 6B).
Fig. 2.
Fig. 2.. Characterization of NaGdF4 nanoparticles.
(A) The schematic diagram of PEGylated NaGdF4 nanoparticles. (B) The linear fittings of R1 and R2 of NaGdF4 nanoparticles and Gd-DTPA with distinct Gd3+ concentration. (C) The picture of long-term stability of PEGylated NaGdF4 nanoparticles in water or NS and temporal evolutions of the Dh of PEGylated NaGdF4 nanoparticles in water or NS. (D) Viabilities of human umbilical vein endothelial cells after coincubating with NaGdF4 nanoparticles and Gd-DTPA with distinct Gd3+ concentration. (E) The hemolysis rate analysis of NaGdF4 nanoparticles with different concentrations. Inset, photographs of different solutions containing blood cells after centrifugation. (F) Blood clearance profiles of PEGylated NaGdF4 nanoparticles in BALB/c mice (n = 3). (G) The schematic diagram of PEGylated NaGdF4 nanoparticles labeled 68Ga. (H) The PET images of mice acquired at 1, 2, and 3 hours after the intravenous injection of 68Ga-labeled PEGylated NaGdF4 nanoparticles (n = 3), together with the time distribution acquired by 68Ga signals in different organs (I).
Fig. 3.
Fig. 3.. Chest and abdominal cavity 3D MRA of mice with NaGdF4.
The schematic illustration of 3D MRI vascular structures from heart to kidney (A) and from kidney to lower limbs (C), DCE-MRI of hepatorenal angiography of mice from heart to kidney (B), and from kidney to lower limbs (D) with PEGylated NaGdF4 nanoparticles after 5 min administration. T1 MRI and SWI of liver (E) and kidney (F) of mice with pre-contrast, post-contrast (5 min), after 2 and 4 hours. The temporal evolution of the average intravascular signal intensity ratio of vascular and organs of liver (G) and kidney (H). Abbreviations: RIPV, right inferior pulmonary vein; RIPA, right inferior pulmonary artery; R/I/LHV, right/ intermediate/left hepatic vein; HPV, hepatic portal vein; IVC, inferior vena cava; RPV, right portal vein; IRHV, inferior right hepatic vein; IA/V, interlobar artery/vein; SMV, superior mesenteric vein; R/LISV, right/left internal spermatic vein; IMV, inferior mesenteric vein; BCT, brachiocephalic trunk; LCCA, left common carotid artery; LSA, left subclavian artery; AOAR, aortic arch; LPSV, left posterior supramarginal vein; AA, abdominal aorta; HA, hepatic artery; SMA, superior mesenteric artery; RRA, right renal artery; LAV, left adrenal vein; SA/V, segmental artery/vein; LRV, left renal vein; LV, lumbar vein; ALV, ascending lumbar vein; IMA, inferior mesenteric artery; R/LCIV, right/left common iliac vein; R/LEIV, right/left external iliac vein; R/LEIA, right/left external iliac artery; R/LSGV, right/left superior gluteal vein; R/LIGV, right/left inferior gluteal vein; LGA, left gastric artery; SA, splenic artery; RA, renal artery; CD, cystic duct; J&IV, jejunal and ileal veins; R/LCIA, right/left common iliac artery; MSV, median sacral. At the heart: L/RA, left/right atrium; L/RV, left/right ventricle; VS, ventricular septum.
Fig. 4.
Fig. 4.. MRA of AD with NaGdF4.
(A) Schematic illustration of the vascular anatomic structures of the mouse brain and 3D DCE MRA of the mouse brain enhanced by nanoparticles after 5-min administration. The main blood vessels are identified. (B) The transverse position and coronal position of 2D SWI of the mouse brain with pre-contrast and post-contrast (5 min). (C) Ventral and left 3D DCE MRA with the pseudo color images of AD and healthy mice brain enhanced by nanoparticles after 5 min administration. (D) SWI of AD and healthy mice brain with pre-contrast and post-contrast (5 min). (E) H&E, Thioflavin S, Congo red, Masson, and Nissl staining of the brain with AD and healthy mice. The embedded scale bar corresponded to 1 mm. (F) The enlarged images of Thioflavin S staining of the brain with AD and healthy mice. The embedded scale bar corresponded to 1 mm. Abbreviations: SV, supraorbital vein; TFV, transverse facial vein; AFV, anterior facial vein; PFV, posterior facial vein; SSS, superior sagittal sinus; TS, transverse sinus; SPS, superior petrosal sinus; IPS, inferior petrosal sinus; ICA, internal carotid artery; ECA, external carotid artery; BA, basilar artery; VA, vertebral artery; CCA, common carotid artery; ACA, anterior cerebral artery; PCA, posterior cerebral artery.
Fig. 5.
Fig. 5.. MRA of stroke with NaGdF4.
TOF angiography (A) and 3D DCE MRA of the stroke rat enhanced by PEGylated NaGdF4 nanoparticles with pre-contrast and post-contrast (5 min). (B). Three representative imaging planes of SWI pre- (C) and post 5 min- (D) injection of PEGylated NaGdF4 nanoparticles. (E) The enlarged image of the upper SW image in (D). Three representative imaging planes of DWI (F) and superimposed images of DWI with corresponding ΔSWI (G). (H) Three representative imaging planes of slice staining analysis with H&E, Nissl, TUNEL, and Masson staining. (I) The average ADC values of infarct core identified by the DWI, ischemic region identified by nanoprobe-based ΔSWI, and normal region of contralateral hemisphere in the three imaging planes. Data are shown as means ± SD (n = 3). Statistical significance was determined by one-way analysis of variance (ANOVA) with a Tukey’s post hoc test (*P < 0.05, ***P < 0.001). The embedded scale bar corresponded to 5 mm.
Fig. 6.
Fig. 6.. MRA of swine with NaGdF4.
(A) Schematic illustration of the procedure of MRA and the vascular identification of swine. (B) The 3D TRICKS angiography (top) and 3D BRAVO images (bottom) after NaGdF4 nanoparticles administration. (C) SWAN images of brain vessels of swine. Abbreviations: AO, aorta; BCT, brachiocephalic trunk; L/RECA, left/right external carotid artery; L/RICA, left/ right internal carotid artery; LCCA, left common carotid artery; VA, vertebral artery; SVC, superior vena cava; RIPV, right inferior pulmonary vein; IVC, inferior vena cava; AA, abdominal aorta; L/RA, left/right atrium; L/RV, left/right ventricle; VS, ventricular septum; MV, mitral valve; BA, basilar artery; ICA, internal carotid artery; MCA, middle cerebral artery.
Fig. 7.
Fig. 7.. Biosafety evaluation of NaGdF4 on mice.
(A) Fluctuations in the body weight of mice after NaGdF4 nanoparticles administration (n = 4). (B to H) Blood biochemical test and routine blood test results of mice treated with the NaGdF4 nanoparticles (n = 4). (I) H&E staining of the tissue slices from major organs of mice receiving NaGdF4 and healthy mice. Data were plotted as means ± SD. The embedded scale bar corresponded to 200 μm. Abbreviations: ALT, alanine aminotransferase; AST, aspartate aminotransferase; WBC, white blood cell; Lymph#, lymphocytes; Mon#, monocyte ratio; Gran#, granulocyte; RBC, red blood cell; PLT, platelets; PDW, platelet distribution width; RDW, red cell distribution width; HGB, hemoglobin; MCHC, mean corpuscular hemoglobin concentration; HCT, hematocrit; PCT, plateletcrit; MCV, mean corpuscular volume; MPV, mean platelet volume; MCH, mean corpuscular hemoglobin; UREA, carbamide; CREA, creatinine; UA, uric acid; γ-GT, gamma-glutamyltransferase.
Fig. 8.
Fig. 8.. Biosafety evaluation of NaGdF4 on CRF rats.
(A) Fluctuations in the body weight of mice after NaGdF4 nanoparticles administration (n = 5). (B and C) Blood test results of different groups of rats (n = 5). Data were plotted as means ± SD. (D) Photographs of the extracted kidney tissues from healthy rats or CRF rats receiving different contrast agents. (E) Photographs of the extracted liver tissues from healthy rats or CRF rats receiving different contrast agents. The H&E staining images of kidney (F) and liver (G). The embedded scale bar corresponded to 200 μm. Abbreviations: UREA, carbamide; CREA, creatinine; Ca, calcium; P, phosphorus; TBIL, total bilirubin; DBIL, direct bilirubin; IBIL, indirect bilirubin; ALT, alanine aminotransferase.

Similar articles

Cited by

References

    1. Suowen X., Iqra I., Peter J. L., Hong L., Danielle K., Xueying Z., Sihui L., Zhuoming L., Peiqing L., Jihong H., Ian C. H., Eno E. E., Scott J. C., Alastair G. S., Jianping W., Endothelial dysfunction in atherosclerotic cardiovascular diseases and beyond: From mechanism to pharmacotherapies. Pharmacol. Rev. 73, 924–967 (2021). - PubMed
    1. Hu Y., Zhao Y., Li P., Lu H., Li H., Ge J., Hypoxia and panvascular diseases: Exploring the role of hypoxia-inducible factors in vascular smooth muscle cells under panvascular pathologies. Sci. Bull. 68, 1954–1974 (2023). - PubMed
    1. Musialek P., Montauk L., Saugnet A., Micari A., Hopkins L. N., The cardio-vascular future of panvascular medicine: The basics. Kardiol. Pol. 77, 899–901 (2019). - PubMed
    1. Guthaner D. F., Wexler L., Enzmann D. R., Riederer S. J., Keyes G. S., Collins W. F., Brody W. R., Evaluation of peripheral vascular disease using digital subtraction angiography. Radiology 147, 393–398 (1983). - PubMed
    1. Singh A., Mor-Avi V., Patel A. R., The role of computed tomography myocardial perfusion imaging in clinical practice. J. Cardiovasc. Comput. 14, 185–194 (2020). - PubMed

LinkOut - more resources