. 2024 Oct 4;9(100):eado0398.
doi: 10.1126/sciimmunol.ado0398. Epub 2024 Oct 4.

Maintenance of X chromosome inactivation after T cell activation requires NF-κB signaling

Affiliations

Maintenance of X chromosome inactivation after T cell activation requires NF-κB signaling

Katherine S Forsyth et al. Sci Immunol. .

Abstract

X chromosome inactivation (XCI) balances X-linked gene dosage between sexes. Unstimulated T cells lack cytological enrichment of X-inactive specific transcript (Xist) RNA and heterochromatic modifications on the inactive X chromosome (Xi), which are involved in maintenance of XCI, and these modifications return to the Xi after stimulation. Here, we examined allele-specific gene expression and epigenomic profiles of the Xi in T cells. We found that the Xi in unstimulated T cells is largely dosage compensated and enriched with the repressive H3K27me3 modification but not the H2AK119-ubiquitin (Ub) mark. Upon T cell stimulation mediated by both CD3 and CD28, the Xi accumulated H2AK119-Ub at gene regions of previous H3K27me3 enrichment. T cell receptor (TCR) engagement, specifically NF-κB signaling downstream of the TCR, was required for Xist RNA localization to the Xi. Disruption of NF-κB signaling in mouse and human T cells using genetic deletion, chemical inhibitors, and patients with immunodeficiencies prevented Xist/XIST RNA accumulation at the Xi and altered X-linked gene expression. Our findings reveal a previously undescribed connection between NF-κB signaling pathways, which affects XCI maintenance in T cells in females.


Conflict of interest statement

Competing interests:

The authors declare that they have no competing interests.

Figures
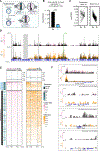
Fig. 1.
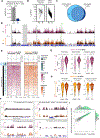
Fig. 1.. The Xi in unstimulated T cells is dosage compensated with transcription from the Xi and distinct epigenetic features at both expressed and silent genes.
(A) Schematic for Xist RNA localization patterns in unstimulated and stimulated T cells (left) and generation of F1 mus × cast mice for allele-specific RNA-seq and CUT&RUN (right). M. m. castaneus, Mus musculus castaneus. (B) Total RPM for the Xa and Xi. Average SDs of three biological replicates are shown; unpaired t test with Welch’s correction, ****P < 0.0001. (C) Log SRPM from Xa and Xi alleles in unstimulated T cells, with each paired line representing one gene, showing Xi expressed and silent genes. Mann-Whitney U test comparing Xi/(Xa + Xi) SRPM for each gene (expressed and silent). (D) Counts per million (CPM)–normalized track of X-specific enrichment of H2AK119-Ub (top) and H3K27me3 (bottom) in unstimulated T cells. Enrichment on the Xa (black) and Xi enrichment of H2AK119-Ub (pink) and H3K27me3 (orange); Xist promoter (green bar); unmappable regions (gray bars). (E) Heatmap of H2AK119-Ub (left, pink) and H3K27me3 (right, orange) enrichment for all expressed X-linked genes by XCI escape status. Metaplots show average enrichments 5 kb upstream of the TSS to 5 kb downstream of the transcription end site (TES). SRPM from the Xi for each gene (teal horizontal lines). XCI escape genes (blue) and genes subject to XCI (black). (F) CPM-normalized tracks of H2AK119-Ub (top) and H3K27me3 (bottom) enrichment at individual genes. Enrichment on the Xa (black), Xi enrichment of H2AK119-Ub (pink), and Xi enrichment of H3K27me3 (orange). The genes shown are Kdm6a (154 kb), Il2rg (7.8 kb), Cxcr3 (10 kb), and Pim2 (7.1 kb).
Fig. 2.
Fig. 2.. The Xi in stimulated T cells acquires H2AK119-Ub marks, and XCI escape genes have distinct epigenetic features.
(A) Total RPM from each X. Averages (SDs) of three biological replicates; unpaired t test with Welch’s correction, ****P < 0.0001. (B) Log SRPM from Xa and Xi alleles in stimulated T cells for expressed and silent genes. Mann-Whitney U test comparing the Xi/(Xa + Xi) SRPM for each X-linked gene, ****P < 0.0001. (C) Venn diagram for overlap of XCI escape genes between unstimulated (light blue) and stimulated T cells (dark blue). (D) CPM-normalized track of chr. X enrichment of H2AK119-Ub (top) and H3K27me3 (bottom) in stimulated T cells. Enrichment on the Xa (black); Xi enrichment of H2AK119-Ub (dark pink) and H3K27me3 (dark orange); Xist promoter (green bar); unmappable regions (gray bars). (E) Heatmap of enrichment of H2AK119-Ub (left, dark pink) and H3K27me3 (right, dark orange) for all expressed (RPKM ≥ 1) X-linked genes by XCI escape status (blue or black), for regions 5 kb upstream of the TSS to 5 kb downstream of the TES. Xi-specific SRPM in teal. (F) CPM-normalized tracks of H2AK119-Ub (top) and H3K27me3 (bottom) enrichment at individual genes: Kdm6a (154 kb), Il2rg (7.8 kb), Cxcr3 (10 kb), and Pim2 (7.1 kb). Xa enrichment (black); Xi enrichment of H2AK119-Ub (dark pink) and H3K27me3 (dark orange). (G and H) d-Score analysis of H2AK119-Ub (G) and H3K27me3 (H) accumulation at promoter, gene body, and intergenic regions for unstimulated (Unstim.) and stimulated (Stim.) T cells. Biological replicates (n = 3) were averaged for each time point. P values were calculated using a Wilcoxon signed-rank test with Benjamini-Hochberg correction. (I) Scatter plot of H3K27me3 on the Xi in gene bodies in unstimulated T cells (log2CPM) versus H2AK119-Ub accumulation from 0 to 48 hours of stimulation (log2ΔCPM). H3K27me3-enriched genes (in the top quartile of the gene body d-score in unstimulated T cells) in green; H3K27me3-low genes in gray. Pearson correlation coefficient is shown for each group.
Fig. 3.
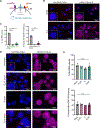
Fig. 3.. TCR signaling, independent of signal strength, is necessary for Xist RNA and H2AK119-Ub localization to the Xi.
(A) Schematic of T cell activation involving the TCR, mediated by either an αCD3 antibody or MHC-peptide complexes. The amino acid sequences of the peptides with various affinities for the OT-I TCR are shown. (B) Representative fields (from one experiment) showing sequential Xist RNA FISH and H2AK119-Ub IF for T cells activated with both αCD3 and αCD28 (top) or αCD3 alone (bottom) for 72 hours. (C) Quantification of Xist RNA clouds (left) and H2AK119-Ub foci for T cells cultured with either αCD3 and αCD28 or αCD3 alone for 72 hours. Averages of three independent experiments showing the SEM; unpaired t test with Welch’s correction, *P < 0.05. In total, 102 to 157 nuclei (FISH) and 85 to 111 nuclei (IF) were counted per condition per experiment. n.s., not significant. (D) Representative fields (from one experiment) showing sequential Xist RNA FISH and H2AK119-Ub IF for OT-I transgenic T cells cultured with congenic splenocytes peptide-pulsed with SIINFEKL, SIIVFEKL, SIIQFEKL, EIINFEKL, or no peptide for 72 days before sorting. (E) Quantification of Xist RNA clouds (top) and H2AK119-Ub foci (bottom) for OT-I transgenic T cells cultured with congenic splenocytes peptide-pulsed with SIINFEKL, SIIVFEKL, SIIQFEKL, or EIINFEKL for 72 hours before sorting. Averages of three independent experiments with SEM; one-way ANOVA with Dunnett’s T3 multiple comparisons test to the anti-SIINFEKL condition, *P < 0.05 and ***P < 0.001. In total, 27 to 144 nuclei (FISH) and 20 to 106 nuclei (IF) were counted per condition per experiment.
Fig. 4.
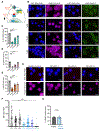
Fig. 4.. Signaling through CD28 or IL-2 alone is not sufficient for Xist RNA and H2AK119-Ub localization to the Xi.
(A) Schematic of cell surface CD28 receptor activated by αCD28 antibody; the IL-2 receptor is activated by soluble recombinant IL-2. (B) Representative fields (from one experiment) showing sequential Xist RNA FISH and H2AK119-Ub IF for T cells activated with either αCD28 alone (top) or IL-2 alone (bottom) for 72 hours. (C) Quantification of Xist RNA clouds (left) and H2AK119-Ub foci for T cells cultured with αCD3 and αCD28, αCD28 alone, or IL-2 alone for 72 hours. Averages of three independent experiments showing SEM with each dot representing a biological replicate; one-way ANOVA with Dunnett’s T3 multiple comparisons test for the αCD3 and αCD28 condition, **P < 0.01 and ****P < 0.0001. In total, 74 to 157 nuclei (FISH) and 58 to 111 nuclei (IF) were counted per condition per experiment. (D) Representative fields (from one experiment) showing sequential Xist RNA FISH and H2AK119-Ub IF of αCD3-/αCD28-stimulated T cells treated with 100 nM rapamycin (G0/G1 block), 200 μM hydroxyurea (S block), nocodozole (1 μg/ml; G2/M block), or a mock treatment control for 72 hours. (E) Quantification of Xist RNA clouds (top) and H2AK119-Ub foci for αCD3-/αCD28-stimulated T cells treated with 100 nM rapamycin (G0/G1 block), 200 μM hydroxyurea (S block), nocodozole (1 μg/ml; G2/M block), or a mock treatment control for 72 hours. Averages of three independent experiments (SEM) are shown with each dot representing a biological replicate; one-way ANOVA with Dunnett’s T3 multiple comparisons test to mock treatment. In total, 85 to 135 nuclei (FISH) and 52 to 146 nuclei (IF) were counted per condition per experiment.
Fig. 5.
Fig. 5.. Canonical NF-κB signaling stimulates the relocalization of Xist RNA and heterochromatic histone modifications to the Xi.
(A) Schematic of the canonical pathway of NF-κB activation, where TCR engagement induces phosphorylation of IκB (red) by the IKK complex composed of IKKα, IKKβ, and NEMO. Subsequent IκB ubiquitinylation and proteasomal degradation releases NF-κB dimers for nuclear translocation. Kinase inhibitors IMD-0354 and TPCA-1 block phosphorylation of IκB. CD4-cre × IKKβflox/flox mice (IKKβ cKO) lack the kinase catalytic subunit of IKKβ. (B and C) (B) Representative fields and (C) quantification of Xist RNA FISH clouds of αCD3-/αCD28-stimulated T cells treated with various concentrations of IKKβ kinase inhibitors for 48 hours. Averages of three independent experiments (SEM); one-way ANOVA with Dunnett’s T3 multiple comparisons test to mock treated; **P < 0.01, ***P < 0.001, and ****P < 0.0001 with 102 to 173 nuclei counted per condition. (D and E) (D) Representative fields and (E) quantification of H2AK119-Ub IF and H3K27me3 IF of αCD3-/αCD28-stimulated T cells treated with 2.5 μM IKKβ kinase inhibitors IMD-0354 or TPCA-1 for 48 hours. Averages of three independent experiments (SEM); one-way ANOVA with Dunnett’s T3 multiple comparisons test to mock treated condition with 36 to 118 nuclei counted per condition. (F) Representative fields of Xist RNA FISH, H2AK119-Ub IF, and H3K27me3 IF of αCD3-/αCD28-stimulated T cells from IKKβ+/+, IKKβ cKO/+, and IKKβ cKO/cKO female mice. (G) Quantification of Xist RNA clouds of T cells from IKKβ+/+, IKKβ cKO/+, and IKKβ cKO/cKO female mice stimulated with αCD3 and αCD28 for 48 hours. Averages of three independent experiments (SEM); Kruskal-Wallis test, **P < 0.01, with 108 to 226 nuclei counted per condition. (H) Quantification of H2AK119-Ub foci (left) and H3K27me3 foci (right) of T cells from IKKβ+/+, IKKβ cKO/+, and IKKβ cKO/cKO female mice stimulated with αCD3 and αCD28 for 48 hours. Averages of three independent experiments (SEM); Kruskal-Wallis test, *P < 0.05, with 58 to 150 nuclei counted per condition.
Fig. 6.
Fig. 6.. X-linked gene and Xist RNA interactome gene expression is altered in mouse T cells after canonical NF-κB inhibition.
(A) Log2CPM values of Xist expression in T cells that were unstimulated, stimulated, or stimulated in the presence of IMD-0354 from RNA-seq dataset. Statistical significance quantified using a one-way ANOVA. (B) Volcano plot of differentially expressed X-linked genes comparing T cells stimulated in the absence or presence of IMD-0354, using cutoffs of an adjusted P value of ≤0.05 and log2 fold change (Log2FC) of 0.5849. Genes escaping XCI in T cells stimulated in the presence of IMD-0354 are shown with light blue circles. (C) Volcano plot of genes differentially expressed from the Xi comparing T cells stimulated in the absence or presence of IMD-0354. (D) Heatmap of differentially expressed (z-score) Xist RNA interactome protein coding genes between unstimulated T cells (n = 3), stimulated T cells (n = 3), and stimulated T cells in the presence of 2.5 μM IMD-0354 (n = 3). Complete lists of up-regulated and down-regulated genes are available in data file S4.
Fig. 7.
Fig. 7.. NF-κB signaling is required for XIST RNA localization to the Xi in human T cells.
(A) Schematic of NF-κB signaling pathways that can be inhibited chemically using IMD-0354 or genetically when patients exhibit heterozygous LOF mutations in NF-κB1. (B) Representative fields of sequential XIST RNA FISH and H2AK119-Ub IF (left two columns) and sequential XIST RNA FISH and H3K27me3 IF (right two columns) of CD3+ T cells in PBMCs from healthy females and stimulated with αCD3 and αCD28 and various concentrations of the IKKβ kinase inhibitor IMD-0354 for 48 hours. (C to E) Quantification of (C) XIST RNA clouds and subsequent (D) H2AK119-Ub IF foci or (E) H3K27me3 IF foci of αCD3-/αCD28-stimulated human T cells treated with various concentrations of IMD-0354 for 48 hours. XIST RNA cloud counts are the average of two technical replicates of the same female donor. Averages of three independent experiments (SEM); one-way ANOVA with Dunnett’s T3 multiple comparisons test to mock treatment, *P < 0.05, **P < 0.01, and ***P < 0.001; in total, 51 to 172 nuclei counted per condition. (F) Representative fields of XIST RNA FISH and H2AK119-Ub IF of sorted central/effector memory CD4+ T cells (CD45RACD27+) stimulated with αCD3 and αCD28 for 48 hours from female NF-κB1 patients as well as a healthy control (HC1). (G) MFI of XIST RNA for sorted central/effector memory CD4+ T cells from healthy controls and NF-κB1 patients stimulated with αCD3 and αCD28. Each dot represents one nucleus. Significance quantified using the Mann-Whitney U test comparing the pooled per group average MFI for XIST RNA, with 73 to 137 nuclei counted per sample: ****P < 0.0001. Significance was unchanged when excluding patient 4 (18 nuclei) for disproportionately low cell numbers. (H) Quantification of H2AK119-Ub foci in sorted memory CD4+ T cells from healthy controls and NF-κB1 patients stimulated with αCD3 and αCD28. Averages (SEM); Kruskal-Wallis test, **P < 0.01, with 36 to 114 nuclei counted per condition.

References

    1. Klein SL, Flanagan KL, Sex differences in immune responses. Nat. Rev. Immunol 16, 626–638 (2016). - PubMed
    1. Patin E, Hasan M, Bergstedt J, Rouilly V, Libri V, Urrutia A, Alanio C, Scepanovic P, Hammer C, Jönsson F, Beitz B, Quach H, Lim YW, Hunkapiller J, Zepeda M, Green C, Piasecka B, Leloup C, Rogge L, Huetz F, Peguillet I, Lantz O, Fontes M, Di Santo JP, Thomas S, Fellay J, Duffy D, Quintana-Murci L, Albert ML, M. I. Consortium, Natural variation in the parameters of innate immune cells is preferentially driven by genetic factors. Nat. Immunol 19, 302–314 (2018). - PubMed
    1. Melzer S, Zachariae S, Bocsi J, Engel C, Löffler M, Tárnok A, Reference intervals for leukocyte subsets in adults: Results from a population-based study using 10-color flow cytometry. Cytom. B: Clin. Cytom 88, 270–281 (2015). - PubMed
    1. Carr EJ, Dooley J, Garcia-Perez JE, Lagou V, Lee JC, Wouters C, Meyts I, Goris A, Boeckxstaens G, Linterman MA, Liston A, The cellular composition of the human immune system is shaped by age and cohabitation. Nat. Immunol 17, 461–468 (2016). - PMC - PubMed
    1. Bongen E, Lucian H, Khatri A, Fragiadakis GK, Bjornson ZB, Nolan GP, Utz PJ, Khatri P, Sex differences in the blood transcriptome identify robust changes in immune cell proportions with aging and influenza infection. Cell Rep. 29, 1961–1973.e4 (2019). - PMC - PubMed

Publication types