. 2024 Dec:58:101065.
doi: 10.1016/j.neo.2024.101065. Epub 2024 Oct 3.

Construction of self-driving anti-αFR CAR-engineered NK cells based on IFN-γ and TNF-α synergistically induced high expression of CXCL10

Affiliations

Construction of self-driving anti-αFR CAR-engineered NK cells based on IFN-γ and TNF-α synergistically induced high expression of CXCL10

Min He et al. Neoplasia. 2024 Dec.

Abstract

Introduction: Ovarian cancer is the most malignant gynecological tumor. Previous studies have demonstrated that chimeric antigen receptor (CAR)-engineered NK-92 cells targeting folate receptor α (αFR) (NK-92-αFR-CAR) can specifically kill αFR-positive ovarian cancer cells. However, the migration barrier restricts antitumor effects of CAR-engineered cells.

Objectives: To elucidate the mechanism by which NK-92-αFR-CAR cells induce the secretion of chemokine CXCL10 during killing ovarian cancer cells. It is speculated that NK-92-αFR-CAR-CXCR3A can target αFR and have chemotaxis of CXCL10, and they may have stronger killing effect of ovarian cancer.

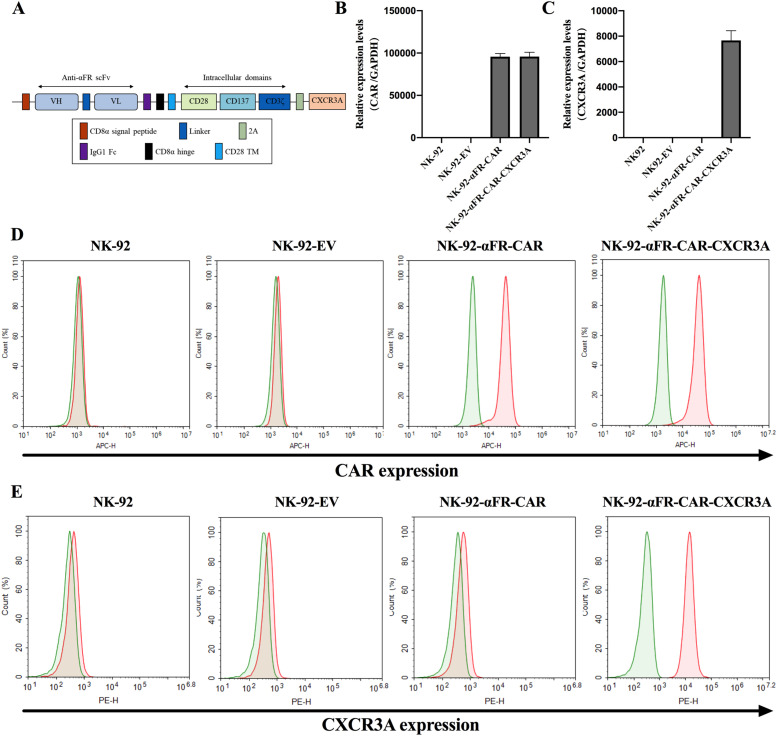
Methods: Study the mechanism of CXCL10 expression strongly induced by TNF-α and IFN-γ combined stimulation in ovarian cancer cells. Construct the fourth generation of NK-92-αFR-CAR-CXCR3A cells, which were co-expressed CXCR3A and αFR-CAR. Evaluate the killing and migration effects of NK-92-αFR-CAR-CXCR3A in vitro and in vivo.

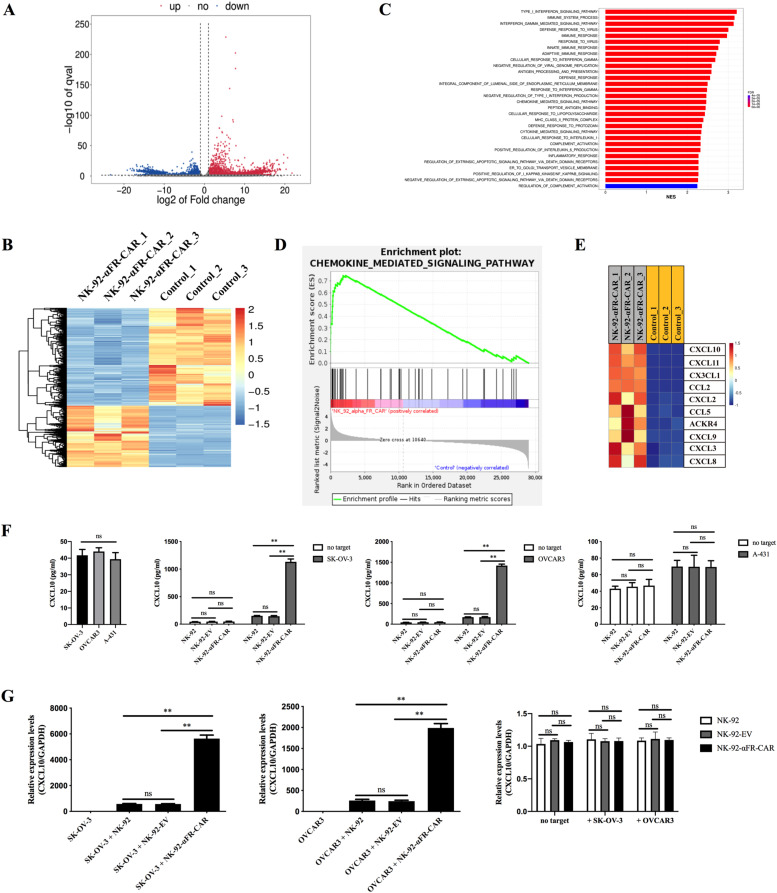
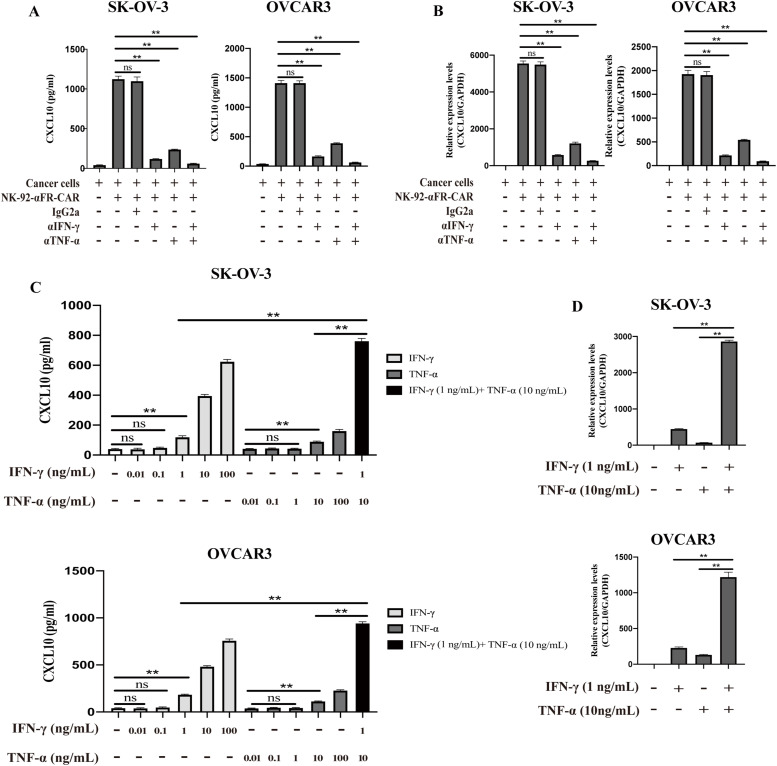
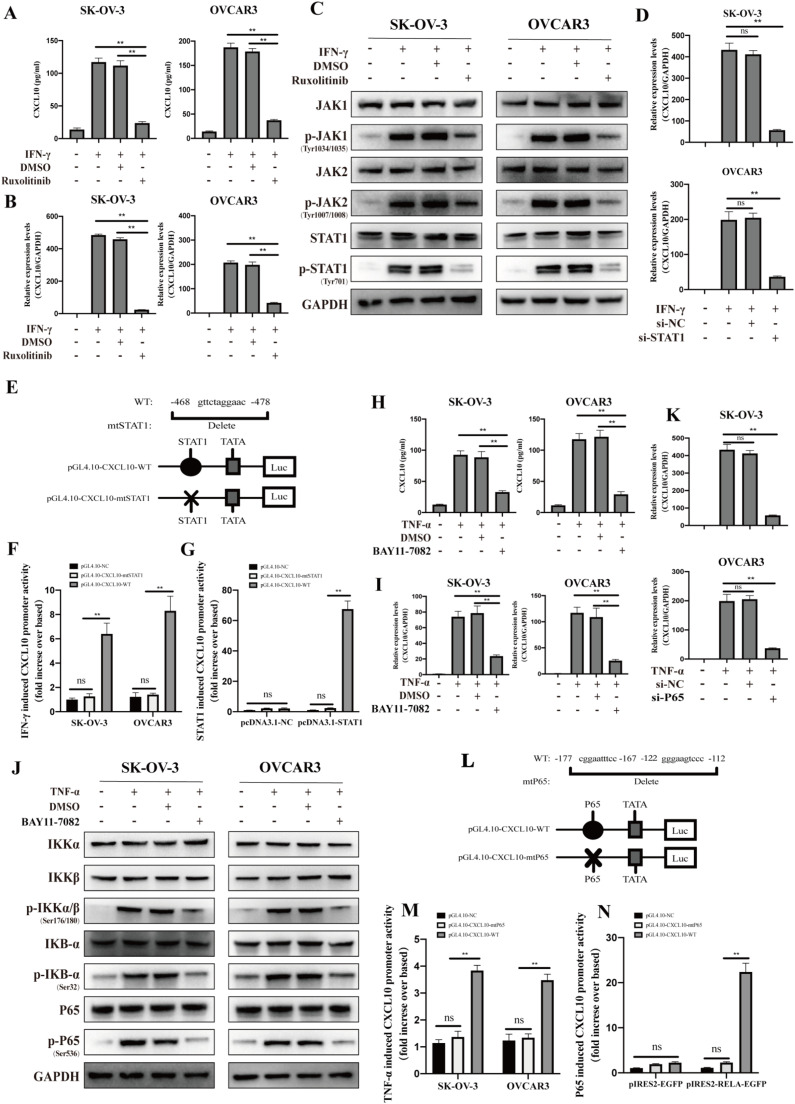
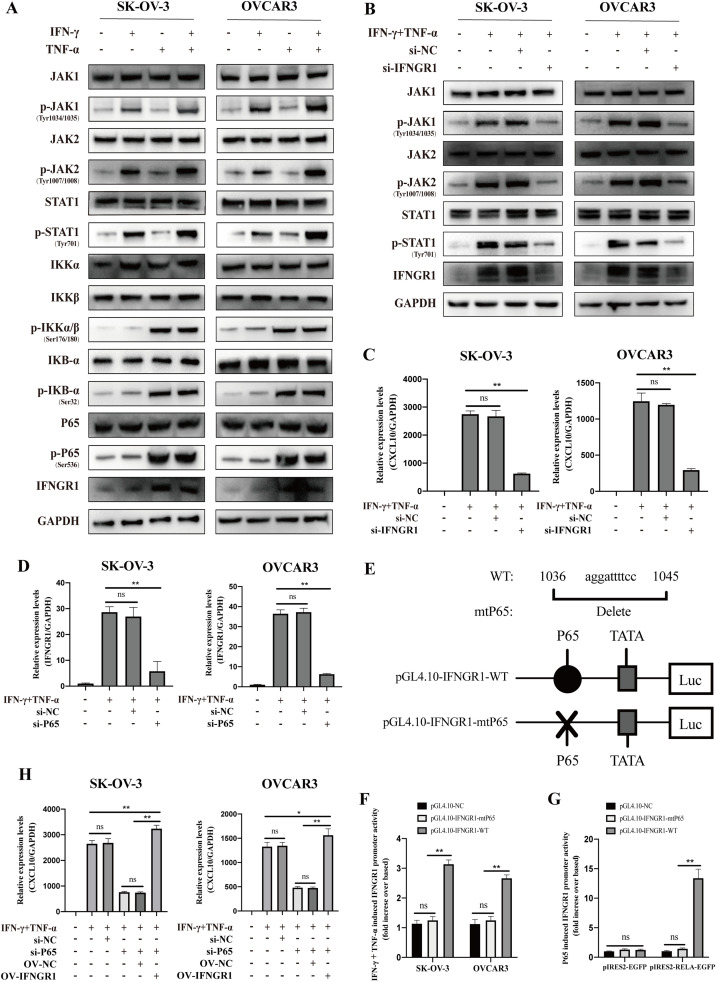
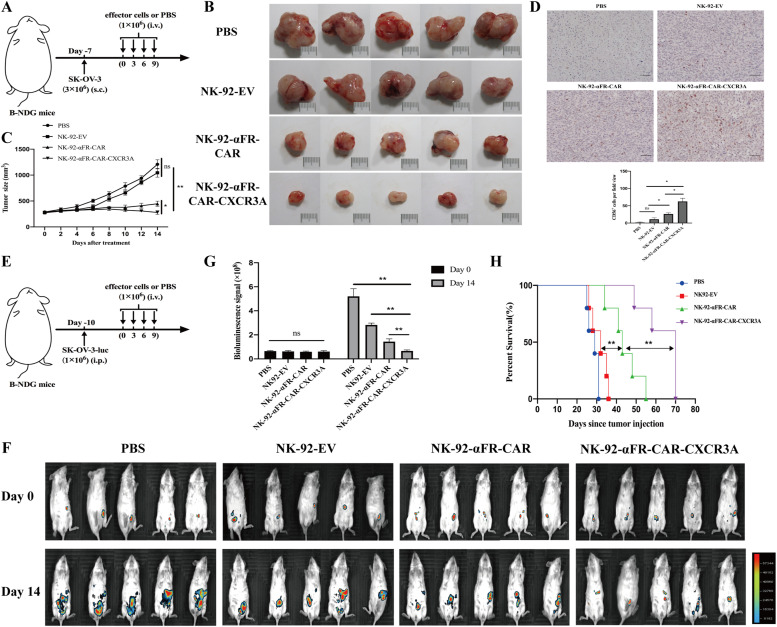
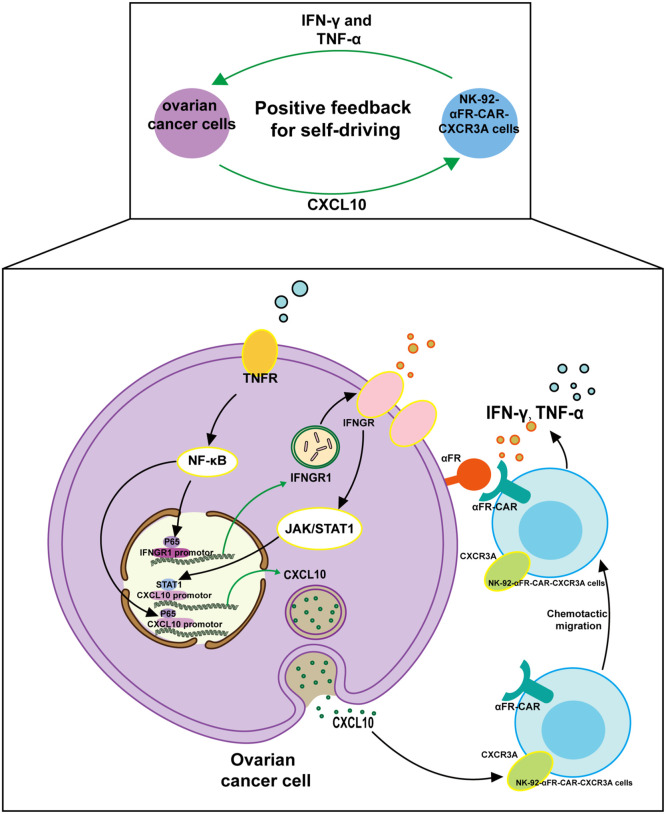
Results: RNA sequencing (RNA-seq) first revealed that the expression level of the chemokine CXCL10 was most significantly increased in ovarian cancer cells co-cultured with NK-92-αFR-CAR. Secondly, cytokine stimulation experiments confirmed that IFN-γ and TNF-α secreted by NK-92-αFR-CAR synergistically induced high CXCL10 expression in ovarian cancer cells. Further signaling pathway experiments showed that IFN-γ and TNF-α enhanced the activation level of the IFN-γ-IFNGR-JAK1/2-STAT1-CXCL10 signaling axis. Cytotoxicity experiments showed that NK-92-αFR-CAR-CXCR3A cells could not only efficiently kill αFR-positive ovarian cancer cells in vitro but also secrete IFN-γ and TNF-α. Higher migration than that of NK-92-αFR-CAR was detected in NK-92-αFR-CAR-CXCR3A using transwell assay. NK-92-αFR-CAR-CXCR3A effectively killed tumor cells in different mouse xenograft models of ovarian cancer and increased infiltration into tumor tissue.

Conclusion: This study confirmed that IFN-γ and TNF-α secreted by αFR-CAR-engineered NK cells can synergistically induce high expression of CXCL10 in ovarian cancer cells and constructed self-driving αFR-CAR-engineered NK cells that can break through migration barriers based on CXCL10, which may provide a new therapeutic weapon for ovarian cancer.

Keywords: CAR-NK; CXCL10; CXCR3; Immunotherapy; Ovarian cancer.


Conflict of interest statement

Declaration of competing interest The authors have declared no conflict of interest

Figures

Image, graphical abstract
Graphical abstract
Fig. 1
Fig. 1
Expression of CXCL10 in ovarian cancer cells after co-culture with NK-92-αFR-CAR cells. (A) Volcano plot of gene expression alternations in SK-OV-3 cells co-cultured with NK-92-αFR-CAR cells. (B) Heatmap of differentially expressed genes in SK-OV-3 cells co-cultured with NK-92-αFR-CAR cells. (C) The top 30 enriched gene sets from GSEA analysis. (D) GSEA enrichment plots of chemokine-mediated signaling pathway gene set. (E) The top 10 core enriched genes involved in chemokine-mediated signaling pathway gene set. (F) CXCL10 levels in the supernatants of ovarian cancer cells and effector cells cultured alone or in co-culture were detected using ELISA assay. (G) The relative expression levels of CXCL10 mRNA normalized to GAPDH mRNA expression in ovarian cancer cells and effector cells cultured alone or in co-culture were detected using qPCR. The data are representative of three independent experiments with similar results. The data in (F) and (G) are expressed as the means ± SEM of triplicate samples. Statistical analysis shows the comparison between the labeled groups. * represents significant difference, **P < 0.01; ns, P ≥ 0.05.
Fig. 2
Fig. 2
Synergistic induction of IFN-γ and TNF-α secreted by NK-92-αFR-CAR cells on CXCL10 expression in ovarian cancer cells. (A) CXCL10 levels in the supernatants of ovarian cancer cells co-cultured with NK-92-αFR-CAR cells in the presence or absence of specific neutralizing antibodies were detected using ELISA assay. IgG2a represents isotype control antibody, αIFN-γ represents anti-IFN-γ neutralizing antibody, and αTNF-α represents anti-TNF-α neutralizing antibody. (B) The relative expression levels of CXCL10 mRNA normalized to GAPDH mRNA expression in ovarian cancer cells co-cultured with NK-92-αFR-CAR cells in the presence or absence of specific neutralizing antibodies were detected using qPCR. (C) CXCL10 levels in the supernatants of ovarian cancer cells treated with IFN-γ or TNF-α at different concentrations were determined using ELISA assay. (D) The relative expression levels of CXCL10 mRNA normalized to GAPDH mRNA expression in ovarian cancer cells treated with IFN-γ (1 ng/mL) and TNF-α (10 ng/mL) alone or in combination were detected using qPCR. All data are expressed as the means ± SEM of three independent experiments. Statistical analysis shows the comparison between the labeled groups. * represents significant difference, *P < 0.05; **P < 0.01; ns, P ≥ 0.05.
Fig. 3
Fig. 3
Mediated signaling pathways of IFN-γ-induced and TNF-α-induced CXCL10 expression in ovarian cancer cells. (A) CXCL10 levels in the supernatants of Ruxolitinib-pretreated ovarian cancer cells stimulated with IFN-γ were determined using ELISA assay.The concentration of IFN-γ is 1ng/ml. (B) The relative expression levels of CXCL10 mRNA normalized to GAPDH mRNA expression in Ruxolitinib-pretreated ovarian cancer cells stimulated with IFN-γ were detected using qPCR. (C) Phosphorylation levels of JAK1/2-STAT1 signaling pathway in Ruxolitinib-pretreated ovarian cancer cells stimulated with IFN-γ were detected using Western Blot. p- means phosphorylated. (D) The relative expression levels of CXCL10 mRNA normalized to GAPDH mRNA expression in siRNA-transfected ovarian cancer cells stimulated with IFN-γ were detected using qPCR. si-NC represents control siRNA, si-STAT1 represents STAT1 siRNA. (E) and (L) Schematic representation of the constructed firefly luciferase reporter plasmids. (F) IFN-γ-induced CXCL10 promoter activity in the plasmid-transfected ovarian cancer cells. (G) STAT1-induced CXCL10 promoter activity in the plasmid-transfected 293T cells. (H) CXCL10 levels in the supernatants of BAY 11-7082-pretreated ovarian cancer cells stimulated with TNF-α were determined using ELISA assay. (I) The relative expression levels of CXCL10 mRNA normalized to GAPDH mRNA expression in BAY 11-7082-pretreated ovarian cancer cells stimulated with TNF-α were detected using qPCR. (J) Phosphorylation levels of NF-κB signaling pathway in BAY 11-7082-pretreated ovarian cancer cells stimulated with TNF-α were detected using Western Blot. (K) The relative expression levels of CXCL10 mRNA normalized to GAPDH mRNA expression in siRNA-transfected ovarian cancer cells stimulated with TNF-α were detected using qPCR. si-P65 represents P65 siRNA. (M) TNF-α-induced CXCL10 promoter activity in the plasmid-transfected ovarian cancer cells. (N) P65-induced CXCL10 promoter activity in the plasmid-transfected 293T cells. All data are expressed as the means ± SEM of three independent experiments. Statistical analysis shows the comparison between the labeled groups. * represents significant difference, **P < 0.01; ns, P ≥ 0.05.
Fig. 4
Fig. 4
Mediated signaling pathway of TNF-α-induced IFNGR1 expression in ovarian cancer cells. (A) Phosphorylation levels of JAK1/2-STAT1 and NF-κB signaling pathways in ovarian cancer cells stimulated with IFN-γ or/and TNF-α were detected using Western Blot. p- means phosphorylated. (B) Phosphorylation levels of JAK1/2-STAT1 signaling pathway in siRNA-transfected ovarian cancer cells stimulated with IFN-γ and TNF-α. IFN-γ + TNF-α represents IFN-γ and TNF-α combined to treat. si-NC represents control siRNA, si-IFNGR1 represents IFNGR1 siRNA. (C) The relative expression levels of CXCL10 mRNA normalized to GAPDH mRNA expression in siRNA-transfected ovarian cancer cells stimulated with IFN-γ and TNF-α were detected using qPCR. (D) The relative expression levels of IFNGR1 mRNA normalized to GAPDH mRNA expression in siRNA-transfected ovarian cancer cells stimulated with IFN-γ and TNF-α were detected using qPCR. si-P65 represents P65 siRNA. (E) Schematic representation of the constructed firefly luciferase reporter plasmids. (F) IFN-γ and TNF-α-induced IFNGR1 promoter activity in the plasmid-transfected ovarian cancer cells. (G) P65-induced IFNGR1 promoter activity in the plasmid-transfected 293T cells. (H) The relative expression levels of CXCL10 mRNA normalized to GAPDH mRNA expression in ovarian cancer cells transfected with siRNA and expression vector were detected using qPCR. OV-NC represents control expression vector, OV-IFNGR1 represents IFNGR1 expression vector. All data are expressed as the means ± SEM of three independent experiments. Statistical analysis shows the comparison between the labeled groups. * represents significant difference, *P < 0.05; **P < 0.01; ns, P ≥ 0.05.
Fig. 5
Fig. 5
Construction and expression of αFR-CAR-CXCR3A in NK-92 cells. (A) Schematic representation of αFR-CAR-CXCR3A. (B) The relative expression levels of αFR-CAR mRNA normalized to GAPDH mRNA expression in NK-92 cells were detected using qPCR. (C) The relative expression levels of CXCR3A mRNA normalized to GAPDH mRNA expression in NK-92 cells were detected using qPCR. The data are expressed as the means ± SEM of triplicate samples. (D) Surface expression of αFR-CAR on NK-92 cells was analyzed using flow cytometry. (E) Surface expression of CXCR3A on NK-92 cells was analyzed using flow cytometry. The filled green histograms indicate isotype control, whereas the filled red histograms indicate the αFR-CAR or CXCR3A expression.
Fig. 6
Fig. 6
Specific cytotoxicity, cytokine secretion, and chemotaxis of NK-92-αFR-CAR-CXCR3A cells. (A) Cell killing by NK-92 cells, NK-92-EV cells, NK-92-αFR-CAR cells, and NK-92-αFR-CAR-CXCR3A cells was determined in the LDH cytotoxicity assay after co-culture with target cells at the indicated E/T ratios. (B) and (C) IFN-γ (B) and TNF-α (C) release of NK-92, NK-92-EV, NK-92-αFR-CAR, and NK-92-αFR-CAR-CXCR3A cells in the presence or absence of SK-OV-3, OVCAR3, or A-431 cells using the ELISA assay. (D) CXCL10 release of SK-OV-3 cells and OVCAR3 cells in the presence or absence of NK-92 cells, NK-92-EV cells, NK-92-αFR-CAR cells, or NK-92-αFR-CAR-CXCR3A cells using the ELISA assay. (E) and (F) Chemotaxis of NK-92, NK-92-EV, NK-92-αFR-CAR, and NK-92-αFR-CAR-CXCR3A cells under CXCL10 secreted by SK-OV-3 cells was analyzed by transwell migration assay. All data are expressed as the means ± SEM of three independent experiments. Statistical analysis shows the comparison between the labeled groups. * represents significant difference, *P < 0.05; **P < 0.01; ns, P ≥ 0.05.
Fig. 7
Fig. 7
In vivo antitumor activity and chemotaxis of NK-92-αFR-CAR-CXCR3A cells. (A), (E) Schematic representation of the construction of different mouse xenograft models of ovarian cancer and the corresponding treatment protocols. s.c. represents subcutaneous injection, i.v. represents intravenous injection, i.p. represents intraperitoneal injection. (B) Subcutaneous tumor tissues were isolated for photographing at the endpoint of the animal study. (C) Subcutaneous tumor volumes of each group were estimated every two days to monitor ovarian cancer development. (D) Chemotactic migration of NK-92 cells into subcutaneous tumor tissues were detected using immunohistochemistry. On the top was a representative immunohistochemistry picture of each group. Scale bars: 100 µm. On the bottom was quantification summary of CD56 positive stained cells per field view in each group. Five randomly selected fields of view were quantified for each group. (F) Intraperitoneal tumor development was determined by in vivo bioluminescence imaging at day 0 and day 14. (G) Statistical analysis of bioluminescence signal intensity in each group shown in (F). (H) Kaplan-Meier survival curves of intraperitoneal tumor-bearing mice treated with PBS, NK-92-EV cells, NK-92-αFR-CAR cells, or NK-92-αFR-CAR-CXCR3A cells. The data in (C), (D), and (G) are expressed as the means ± SEM of five mice for all groups. Statistical analysis shows the comparison between the labeled groups. * represents significant difference, *P < 0.05; **P < 0.01; ns, P ≥ 0.05.
Fig. 8
Fig. 8
Schematic of positive feedback for self-driving of NK-92-αFR-CAR-CXCR3A cells based on IFN-γ and TNF-α synergistically induced high CXCL10 expression. In the antitumor process, IFN-γ and TNF-α secreted by NK-92-αFR-CAR-CXCR3A cells synergistically induced high expression of CXCL10 in ovarian cancer cells through JAK-STAT1 and NF-κB signaling pathways, respectively. Under the action of CXCL10, NK-92-αFR-CAR-CXCR3A cells continue to chemotactically migrate into tumor tissues, which can not only make ovarian cancer cells secrete more CXCL10, but also further enhance the antitumor effects.

Similar articles

Cited by

References

    1. Siegel RL, Miller KD, Fuchs HE, Jemal A. Cancer statistics, 2022. CA Cancer J. Clin. 2022;72(1):7–33. doi: 10.3322/caac.21708. - DOI - PubMed
    1. Bell D, Berchuck A, Birrer M, Chien J, Cramer DW, Dao F, et al. Integrated genomic analyses of ovarian carcinoma. Nature. 2011;474(7353):609–615. doi: 10.1038/nature10166. - DOI - PMC - PubMed
    1. Jemal A, Siegel R, Ward E, Hao Y, Xu J, Thun MJ. Cancer statistics. CA Cancer J. Clin. 2009;59(4):225–249. doi: 10.3322/caac.20006. - DOI - PubMed
    1. Liang Z, Dong J, Yang N, Li SD, Yang ZY, Huang R, et al. Tandem CAR-T cells targeting FOLR1 and MSLN enhance the antitumor effects in ovarian cancer. Int. J. Biol. Sci. 2021;17(15):4365–4376. doi: 10.7150/ijbs.63181. - DOI - PMC - PubMed
    1. Hassan R, Thomas A, Alewine C, Le DT, Jaffee EM, Pastan I. Mesothelin immunotherapy for cancer: ready for prime time. J. Clin. Oncol. 2016;34(34):4171–4179. doi: 10.1200/JCO.2016.68.3672. - DOI - PMC - PubMed

Publication types

MeSH terms