. 2024 Oct 15;5(10):101755.
doi: 10.1016/j.xcrm.2024.101755. Epub 2024 Oct 4.

De novo GTP synthesis is a metabolic vulnerability for the interception of brain metastases

Affiliations

De novo GTP synthesis is a metabolic vulnerability for the interception of brain metastases

Agata M Kieliszek et al. Cell Rep Med. .

Abstract

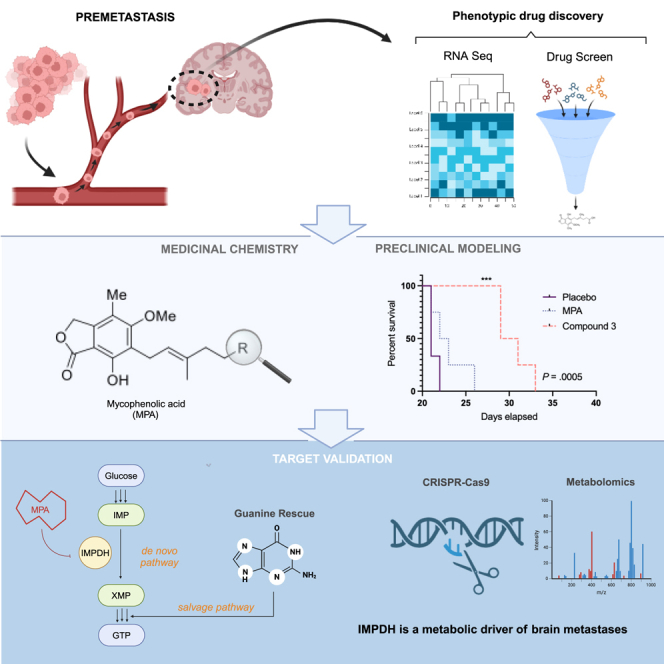
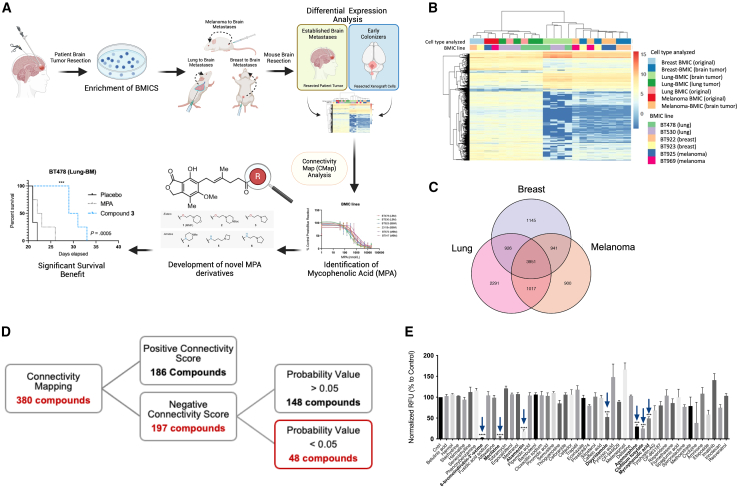
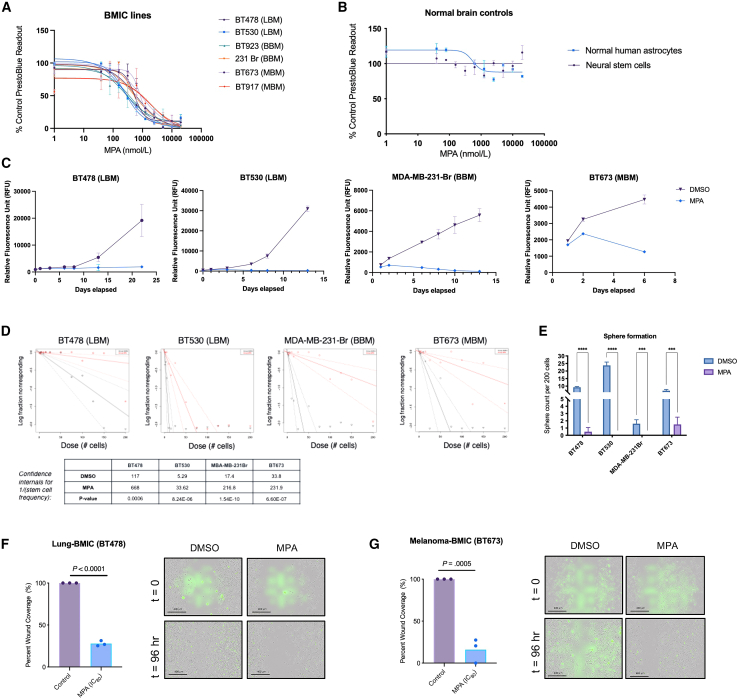
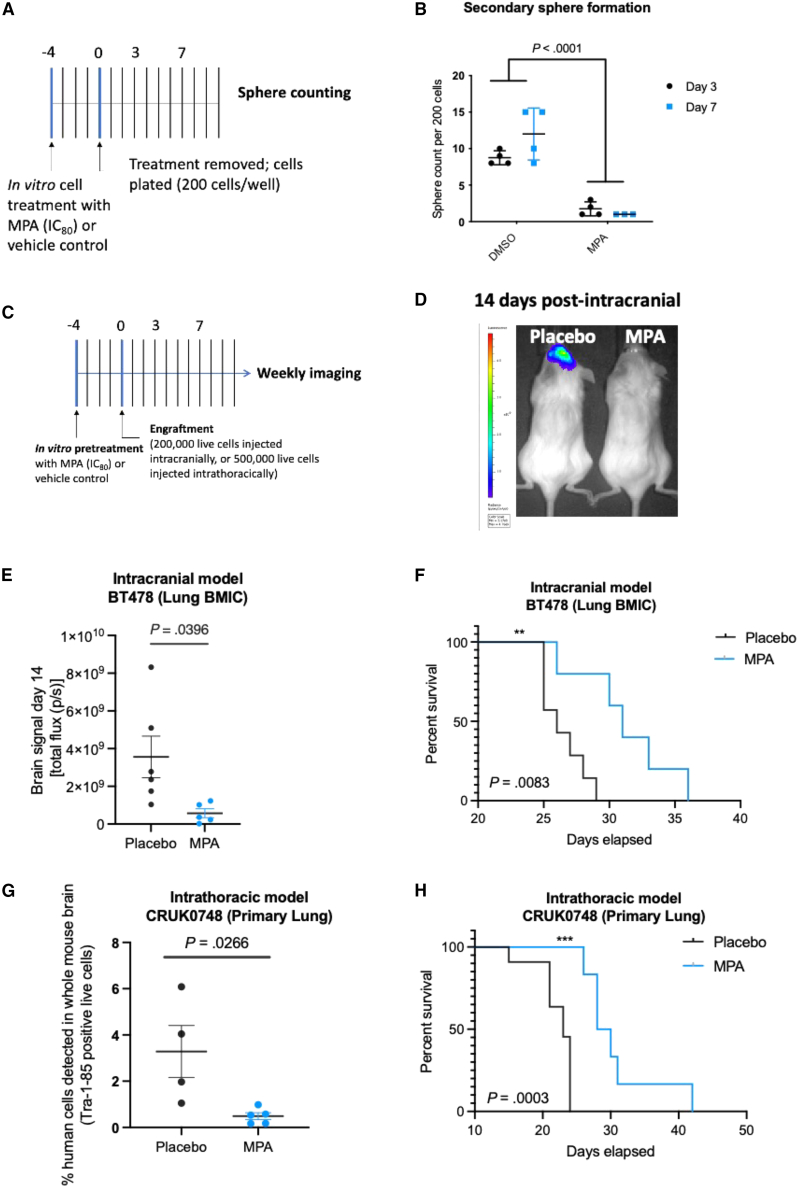
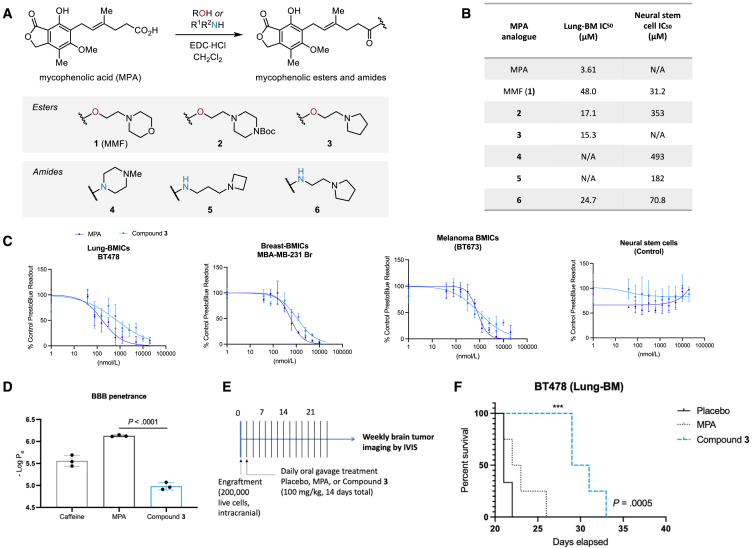
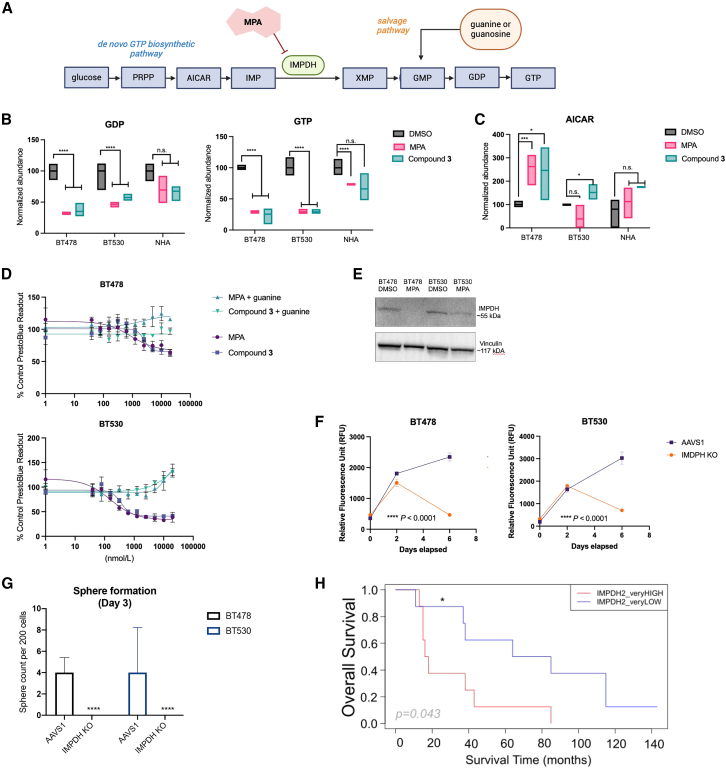
Patients with brain metastases (BM) face a 90% mortality rate within one year of diagnosis and the current standard of care is palliative. Targeting BM-initiating cells (BMICs) is a feasible strategy to treat BM, but druggable targets are limited. Here, we apply Connectivity Map analysis to lung-, breast-, and melanoma-pre-metastatic BMIC gene expression signatures and identify inosine monophosphate dehydrogenase (IMPDH), the rate-limiting enzyme in the de novo GTP synthesis pathway, as a target for BM. We show that pharmacological and genetic perturbation of IMPDH attenuates BMIC proliferation in vitro and the formation of BM in vivo. Metabolomic analyses and CRISPR knockout studies confirm that de novo GTP synthesis is a potent metabolic vulnerability in BM. Overall, our work employs a phenotype-guided therapeutic strategy to uncover IMPDH as a relevant target for attenuating BM outgrowth, which may provide an alternative treatment strategy for patients who are otherwise limited to palliation.

Keywords: GTP synthesis; IMPDH; brain metastases; cancer stem cells.


Conflict of interest statement

Declaration of interests A.M.K., J.W.J., C.V., J.M., and S.K.S. are listed as co-inventors for a PCT patent that has been filed, relating to this work.

Figures

None
Graphical abstract
Figure 1
Figure 1
Phenotypic screen identifies anti-BMIC compounds (A) Schematic of phenotypic screen pipeline. Transcriptomes of BMICs isolated from established patient BM samples were compared to the same BMICs isolated from the brains of mice following orthotopic transplantation (i.e., early colonizers of metastatic spread). Created with BioRender.com. (B) RNA sequencing revealed a unique molecular and genetic profile suggestive of deregulation during the pre-metastatic stage of BM from all three cohorts. “Original” denotes BMIC samples collected prior to xenograft injection. (C) Venn diagram of 3,951 genes being commonly differentially expressed during pre-metastasis. (D) Schematic of selection criteria that led to 48 compounds being chosen for preliminary drug screen and evaluated against an in-house patient-derived lung-BMIC line at 10 μΜ for 72 h using a PrestoBlue readout. (E) 48 CMap compounds evaluated against an in-house patient-derived lung-BMIC line; seven compounds significantly decreased the viability to lung-BMICs (BT478) compared to vehicle control after a 72-h incubation period (blue arrows refer to compounds shown in Figure 1D; n = 3; ∗∗∗, p < 0.001; ∗∗∗∗, p < 0.0001). See also Figure S1. Comparisons of cell viability were made via a two-tailed unpaired t test and data are presented as mean ± SD from 3 technical replicates.
Figure 2
Figure 2
MPA is a selective anti-BMIC inhibitor (A) Dose-response curves of multiple lung-BM (LBM), breast-BM (BBM), and melanoma-BM (MBM) cells, and (B) control normal brain cells after a 72-h treatment with MPA. PrestoBlue readout is normalized to vehicle-treated cells. Data are presented as mean ± SD from 4 technical replicates. (C) Assessment of cell viability of patient-derived BMICs treated with MPA or its vehicle. PrestoBlue readout is normalized to vehicle-treated cells, p < 0.0001. (D) Limiting dilution analysis regression curves of patient-derived BMICs after a 6-day treatment with MPA or its vehicle: plotted using the extreme limiting dilution program (available from: http://bioinf.wehi.au/software/elda/). (E) Quantification of tumor spheres formed by patient-derived BMICs after 72-h treatment with MPA or its vehicle. Sphere count normalized to vehicle-treated cells, p < 0.0001. (F and G) Percent wound closure of DMSO control vs. MPA-treated cells expressed as an average of replicates (n = 3) and images are taken at 10× magnification. Wound closure (represented by dotted white line) is measured using ImageJ on Incucyte-derived images, p values are indicated. Scale bars are 400 μm. See also Videos S1, S2, S3, and S4. Comparisons of cell viability, sphere formation, and wound closure were made via a two-tailed unpaired t test and data are presented as mean ± SD from 3 to 4 technical replicates. SYTOX green nucleic acid stain indicates cell death.
Figure 3
Figure 3
Short exposure of BMICs to MPA slows BM progression in mice (A) Schematic of clonogenic secondary sphere formation assay. (B) Quantification of secondary tumor sphere formation by patient-derived BMICs following the removal of MPA (IC80 treatment for 72 h) or its vehicle from the culture media. Comparisons were made via a two-tailed unpaired t test and data are presented as mean ± SD from 4 to 5 technical replicates. p value is indicated. (C) Schematic of experimental timeline. BMICs or primary lung cancer cells were pre-treated with MPA or its vehicle in vivo (due to MPA’s predicted poor BBB penetrance) for 4 days followed by either intracranial or intrathoracic engraftment into immunocompromised mice, respectively. (D) Representative IVIS bioluminescence images of mice 14-day post injection and (E) brain tumor burden comparisons between placebo and MPA groups. IVIS, in vivo imaging system. Comparisons were made via a two-tailed unpaired t test and data are presented as mean ± SD from 4 to 5 technical replicates. p value is indicated. (F) Kaplan-Meier survival analysis of placebo and MPA groups following intracranial engraftment of patient-derived BMICs. Comparisons were made via a log rank (Mantel-Cox) test, p value is indicated. (G) Quantification of human cells in mouse brains by flow cytometry at the humane endpoint. Comparisons were made via a two-tailed unpaired t test and data are presented as mean ± SD from 4 to 5 technical replicates. p value is indicated. (H) Kaplan-Meier survival analysis of vehicle and MPA groups following intrathoracic engraftment of patient-derived metastatic lung tumor cells. Comparisons were made via a log rank (Mantel-Cox) test, p value is indicated.
Figure 4
Figure 4
Increasing MPA’s brain penetrance enhances its anti-BM phenotype in vivo (A) Summary of the design and synthesis strategy for MPA analogs. See supplementary information for chemical syntheses. (B) A summary of each analog’s activity following dose-response assays. N/A, not applicable. (C) Dose-response curves of a lung-BMIC line (BT478), breast-BMIC line (MDA-MB-231 Br), melanoma-BMIC line (BT673), and neural stem control cells following a 72-h treatment with MPA or Compound 3. PrestoBlue readout is normalized to vehicle-treated cells and data are presented as mean ± SD from 4 technical replicates. (D) Brain penetrance was evaluated in vitro using the parallel artificial membrane permeability (PAMPA) assay. Permeability coefficients (−LogPe) > 6 indicate low CNS permeability, whereas −LogPe < 6 indicate high CNS permeability. Caffeine was used as a BBB-permeable control. Comparisons were made via a two-tailed unpaired t test and data are presented as mean ± SD from 3 technical replicates. p value is indicated. (E) Schematic of treatment regimen. Mice were treated daily by oral gavage using either MPA, Compound 3, or placebo. (F) Kaplan-Meier survival analysis of control-, MPA-, and Compound 3-treated mice. Log rank test, p value is indicated (n.s., not significant [MPA], ∗∗∗p = 0.0005 [Compound 3]).
Figure 5
Figure 5
MPA targets the de novo GTP synthesis pathway in BMICs (A) Schematic of the de novo GTP synthesis pathway. Created with BioRender.com. (B) Boxplots depicting relative GDP and GTP levels in patient-derived BMIC lines and normal human astrocytes (NHAs) with either DMSO, MPA, or Compound 3 treatment. Comparisons were made via a two-tailed unpaired t test, n = 4 technical replicates, p value is indicated. N.s., not significant, ∗∗∗∗ = p < 0.0001. (C) Boxplots depicting relative AICAR levels in patient-derived BMIC lines and NHAs with either DMSO, MPA, or Compound 3 treatment. Comparisons were made via a two-tailed unpaired t test, n = 4 technical replicates. N.s., not significant. (D) Dose-response curves of BT478 and BT530 tumor cells treated with MPA or Compound 3 in culture media supplemented with exogenous guanine (12 μM) or vehicle (water). Data are presented as mean ± SD from 4 technical replicates. (E) Immunoblot confirmation of IMPDH (IMPDH1 + IMPDH2) knockout (KO) in patient-derived lung-BMICs. Cropped from single full blot. (F) Time-course proliferation assays of AAVS1 and IMPDH KO BT478 and BT530 cells. Comparisons were made via a two-tailed unpaired t test. Data are presented as mean ± SD from 4 technical replicates, ∗∗∗∗ = p < 0.0001. (G) Representative bar graphs depicting the sphere count per 200 cells of AAVS1 vs. IMPDH KO cells. Comparisons were made via a two-tailed unpaired t test, data are presented as mean ± SD from 4 technical replicates, ∗∗∗∗ = p < 0.0001. (H) Kaplan-Meier curves showing the overall survival probability (from primary cancer diagnosis to death) in a cohort of 30 patients with lung carcinoma who developed BM, for IMPDH2 very high vs. very low expression (1st and 3rd quartiles cutoff values: <114.86 and >210.74). The Cox regression model for survival analysis was used, p values (p) are shown. The hazard ratio (HR) and 95% confidence interval (CI) are HR = 0.30, CI (0.09–0.96) for IMPDH2 very low compared with very high, or inverted HR = 3.33, CI (1.041–11.11). For the two patients from the cohort who were still alive at the end of the study, the latest survival time point was used for the analysis. Data were obtained from the processed (Q3 method normalization) GEO dataset (GSE200563). Data acquisition, analysis, and visualization performed using R version 4.1.2 and the following packages: GEOquery, survival, and ggplot2.

References

    1. Patchell R.A. The management of brain metastases. Cancer Treat Rev. 2003;29:533–540. doi: 10.1016/S0305-7372(03)00105-1. - DOI - PubMed
    1. Soffietti R., Cornu P., Delattre J.Y. 2011. Brain metastases 10.1038/s41572-018-0055-y.
    1. Liu Q., Tong X., Wang J. Management of brain metastases: history and the present. Chin. Neurosurg. J. 2019;5:1. doi: 10.1186/s41016-018-0149-0. - DOI - PMC - PubMed
    1. Han C.H., Brastianos P.K. Genetic characterization of brain metastases in the era of targeted therapy. Front. Oncol. 2017;7:230. doi: 10.3389/fonc.2017.00230. - DOI - PMC - PubMed
    1. PK B., SL C., S S. Genomic characterization of brain metastases reveals branched evolution and potential therapeutic targets. Cancer Discov. 2015;5:1164–1177. - PMC - PubMed