. 2024 Oct 15;5(10):101762.
doi: 10.1016/j.xcrm.2024.101762. Epub 2024 Oct 3.

A simplified and robust risk stratification model for stem cell transplantation in pediatric acute myeloid leukemia

Affiliations

A simplified and robust risk stratification model for stem cell transplantation in pediatric acute myeloid leukemia

Hua Yang et al. Cell Rep Med. .

Abstract

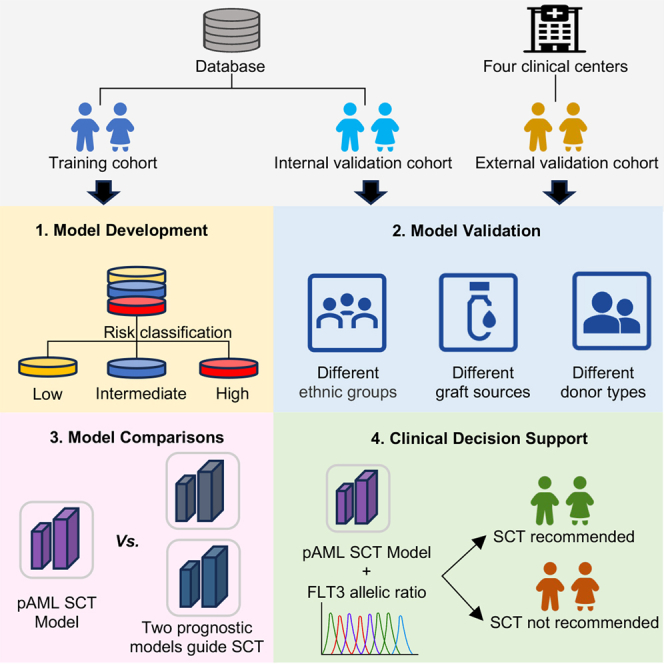
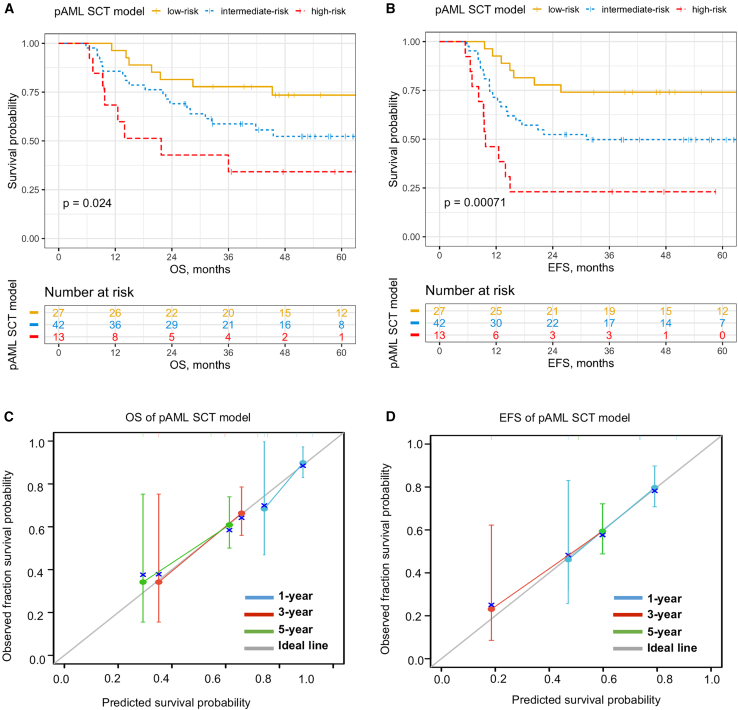
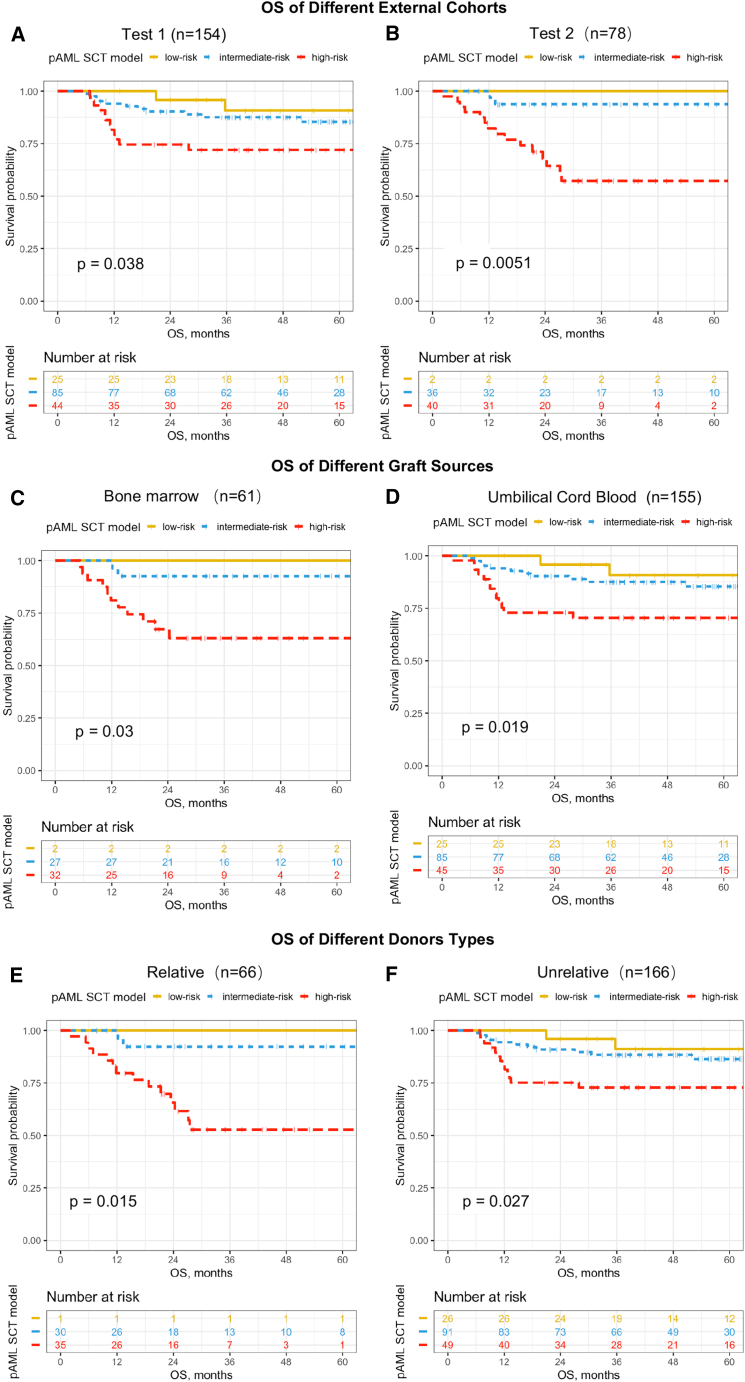
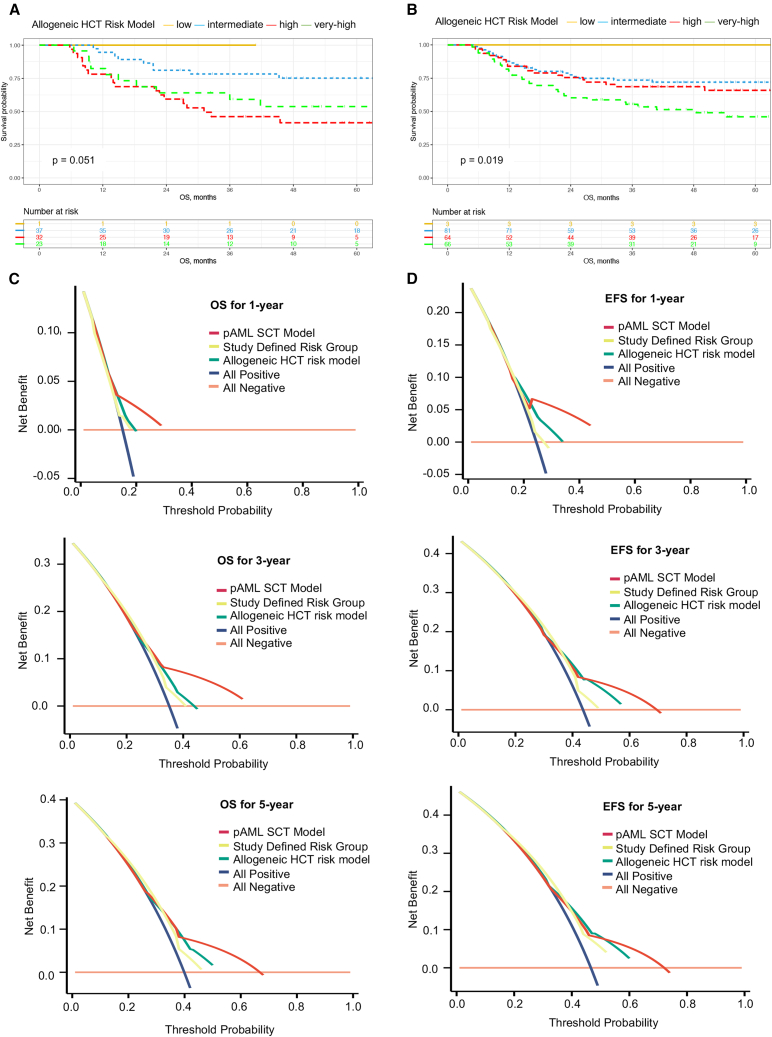
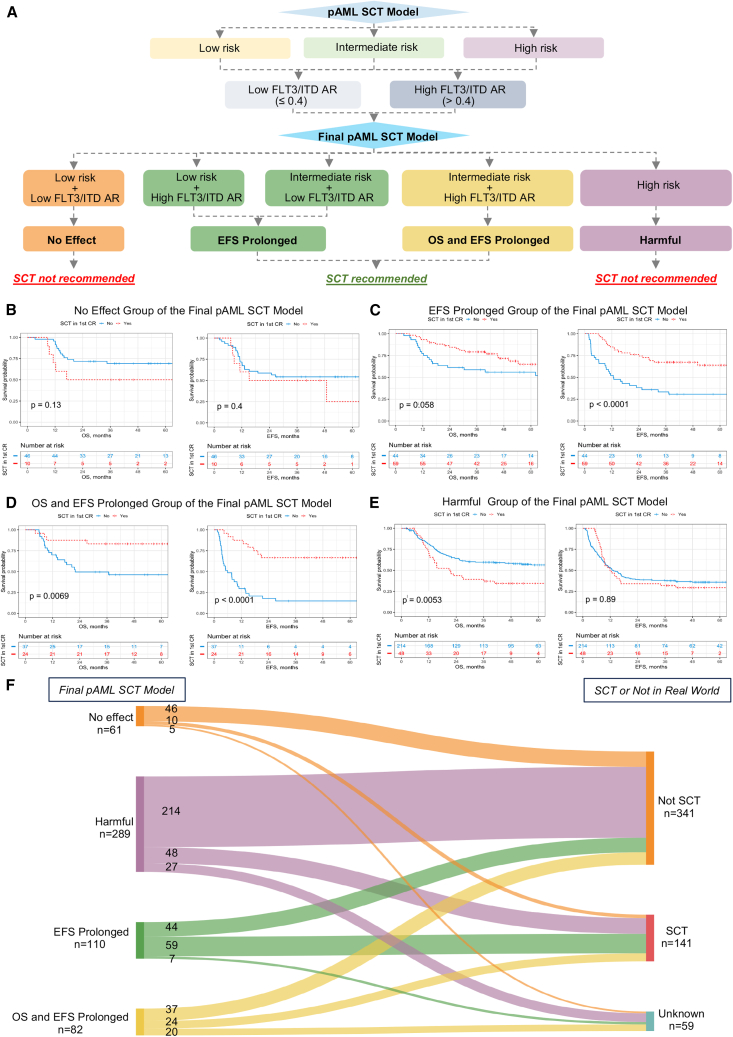
The efficacy of stem cell transplantation (SCT) in pediatric acute myeloid leukemia (pAML) remains unsatisfactory due to the limitations of existing prognostic models in predicting efficacy and selecting suitable candidates. This study aims to develop a cytomolecular risk stratification-independent prognostic model for SCT in pAML patients at CR1 stage. The pAML SCT model, based on age, KMT2A rearrangement (KMT2A-r), and minimal residual disease at end of course 1 (MRD1), effectively classifies patients into low-, intermediate-, and high-risk groups. We validate the effectiveness in an internal validation cohort and in four external validation cohorts, consisting of different graft sources and donors. Moreover, by incorporating the FMS-like tyrosine kinase 3/internal tandem duplication (FLT3/ITD) allelic ratio, the pAML SCT model is refined, enhancing its ability to effectively select suitable candidates. We develop a simple and robust risk stratification model for pAML patients undergoing SCT, to aid in risk stratification and inform pretransplant decision-making at CR1 stage.

Keywords: allelic ratio of FLT3/ITD; minimal residual disease; pediatric acute myeloid leukemia; risk stratification model; stem cell transplantation.


Conflict of interest statement

Declaration of interests The authors declare no competing interests.

Figures

None
Graphical abstract
Figure 1
Figure 1
Flowchart of the study design (A) The process of the pAML SCT model development. (B) Validation of the prognostic performance of the pAML SCT model by internal cohort and external cohorts. (C) The process of comparing the pAML SCT model with two other prognostic models used to guide SCT. (D) In combination with FLT3 allelic ratio to build the final pAML SCT model and utilized to aid in the screening of suitable candidates for SCT. AUC, area under the curve; MRD, minimal residual disease; SCT, stem cell transplantation.
Figure 2
Figure 2
Model development and performance in the training cohort (A) Forest plot of age at diagnosis, KMT2A-r status, and MRD1 status in the training cohort. (B) OS of patients in high-, intermediate-, and low-risk groups decreased sequentially (p < 0.001). (C) The EFS of patients in the high-, intermediate-, and low-risk groups decreases sequentially (p = 0.00045). (D) Variance inflation factor results for the three variables in the pAML SCT model. MRD1, minimal residual disease at the end of the first treatment course; OS, overall survival; EFS, event-free survival.
Figure 3
Figure 3
Performance evaluation of the pAML SCT model in the internal validation cohort (A) The sequential decrease in OS was observed among patients in the high-, intermediate-, and low-risk groups in the internal validation cohort (p = 0.024). (B) The sequential decrease in EFS was observed among patients in the high-, intermediate-, and low-risk groups (p = 0.00071) in the internal validation cohort. Yellow, low-risk, blue, intermediate-risk, red, high-risk for the Kaplan-Meier curves. (C) The calibration curve graph for the internal validation cohort of OS. (D) The calibration curve graph for the internal validation cohort of EFS. Blue, 1-year, red, 3-year, green, 5-year, gray, ideal line for the calibration curves. EFS, event-free survival; OS, overall survival; SCT, stem cell transplantation.
Figure 4
Figure 4
Further validation of the performance of the pAML SCT model in external validation cohorts (A) The OS Kaplan-Meier curves (p = 0.038) of test 1 cohort. (B) The OS Kaplan-Meier curves (p = 0.0051) of test 2 cohort. (C) Kaplan-Meier curves for OS (p = 0.03) in the bone marrow cohort. (D) Kaplan-Meier curves for OS (p = 0.019) in the umbilical cord blood cohort. (E) The OS Kaplan-Meier curves (p = 0.015) of the relative donors cohort. (F) The OS Kaplan-Meier curves (p = 0.027) of the unrelative donors cohort. Yellow, low-risk, blue, intermediate-risk, red, high-risk for the Kaplan-Meier curves. AUC, area under the curve; EFS, event-free survival; OS, overall survival; SCT, stem cell transplantation.
Figure 5
Figure 5
Comparison with existing pAML prognostic models guiding SCT (A) In the training cohort, no statistically significant differences were observed between the four risk groups of the allogeneic HCT risk model (p = 0.051). (B) In the internal validation cohort, significant differences were observed between the four risk groups of the allogeneic HCT risk model (p = 0.019) while the high-risk group overlapped with the intermediate group. (C) The DCA curves for OS at the 1-, 3-, and 5-year timepoints. (F) The DCA curves for EFS at the 1-, 3-, and 5-year timepoints. AUC, area under the curve; DCA, decision curve analysis; EFS, event-free survival; OS, overall survival.
Figure 6
Figure 6
Application of the final pAML SCT model for SCT candidate screening (A) This flowchart shows how the FLT3/ITD allelic ratio is incorporated into the final pAML SCT model, as well as how the risk groupings of the model are used to make SCT decisions. Patients in the final pAML SCT model were divided into four groups, where OS and EFS prolonged and EFS prolonged groups were recommended for SCT, and no effect and harmful groups were not. (B) No significant difference was observed in OS (p = 0.13) and EFS (p = 0.4) between patients who underwent SCT and those who did not in the no effect group. (C) SCT patients in the EFS prolonged group had longer EFS than non-SCT patients (p < 0.001). There was no significant difference in OS (p = 0.058) between the two groups in the EFS prolonged group. (D) Longer OS (p = 0.00069) and EFS (p < 0.0001) were observed in SCT patients than in non-SCT patients in the OS and EFS prolonged group. (E) SCT patients in the harmful group had a shorter OS than non-SCT patients (p = 0.0053). There was no significant difference in EFS (p = 0.89) within the harmful group. (F) Sankey diagram illustrates the final pAML SCT model compared to the actual SCT population in the TARGET 308 cohort. Risk groups are illustrated by colored boxes, and the number of cases within them is included for each classifier. Middle areas indicate case redistribution flow. EFS, event-free survival; OS, overall survival; SCT, stem cell transplantation.

Similar articles

Cited by

References

    1. Tao Y., Wei L., Shiba N., Tomizawa D., Hayashi Y., Ogawa S., Chen L., You H. Development and validation of a promising 5-gene prognostic model for pediatric acute myeloid leukemia. Mol. Biomed. 2024;5:1. doi: 10.1186/s43556-023-00162-y. - DOI - PMC - PubMed
    1. Chen X., Pan J., Wang S., Hong S., Hong S., He S. The Epidemiological Trend of Acute Myeloid Leukemia in Childhood: a Population-Based Analysis. J. Cancer. 2019;10:4824–4835. doi: 10.7150/jca.32326. - DOI - PMC - PubMed
    1. Zhang J., Liu L., Wei J., Wu X., Luo J., Wei H., Ning L., He Y. High expression level of the FTH1 gene is associated with poor prognosis in children with non-M3 acute myeloid leukemia. Front. Oncol. 2022;12 doi: 10.3389/fonc.2022.1068094. - DOI - PMC - PubMed
    1. Bertuccio S.N., Anselmi L., Masetti R., Lonetti A., Cerasi S., Polidori S., Serravalle S., Pession A. Exploiting Clonal Evolution to Improve the Diagnosis and Treatment Efficacy Prediction in Pediatric AML. Cancers. 2021;13 doi: 10.3390/cancers13091995. - DOI - PMC - PubMed
    1. Pollard J.A., Guest E., Alonzo T.A., Gerbing R.B., Loken M.R., Brodersen L.E., Kolb E.A., Aplenc R., Meshinchi S., Raimondi S.C., et al. Gemtuzumab Ozogamicin Improves Event-Free Survival and Reduces Relapse in Pediatric KMT2A-Rearranged AML: Results From the Phase III Children's Oncology Group Trial AAML0531. J. Clin. Oncol. 2021;39:3149–3160. doi: 10.1200/jco.20.03048. - DOI - PMC - PubMed

Substances