. 2024 Oct 4;7(12):e202302545.
doi: 10.26508/lsa.202302545. Print 2024 Dec.

SLMAP3 is essential for neurulation through mechanisms involving cytoskeletal elements, ABP, and PCP

Affiliations

SLMAP3 is essential for neurulation through mechanisms involving cytoskeletal elements, ABP, and PCP

Taha Rehmani et al. Life Sci Alliance. .

Abstract

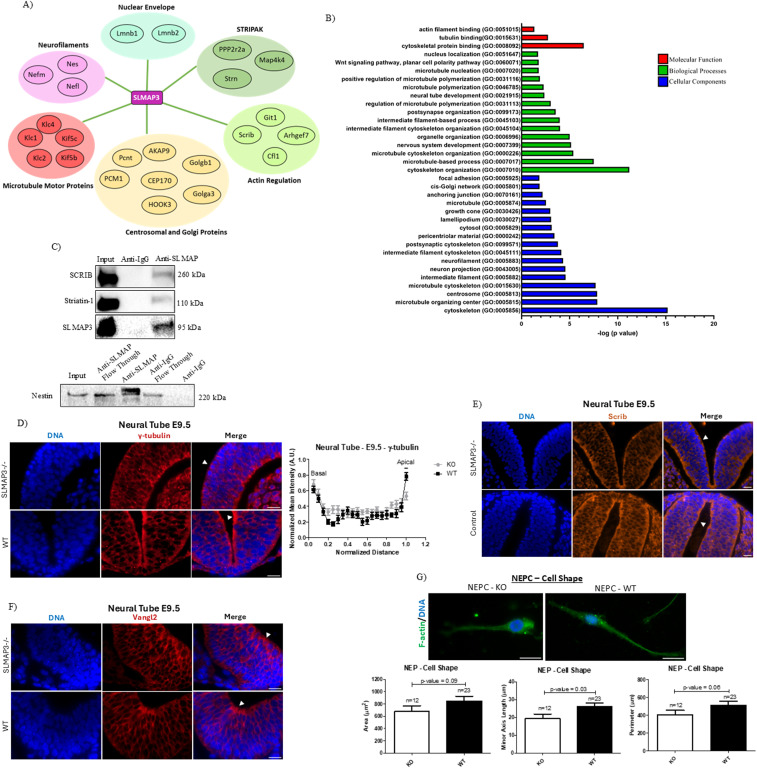
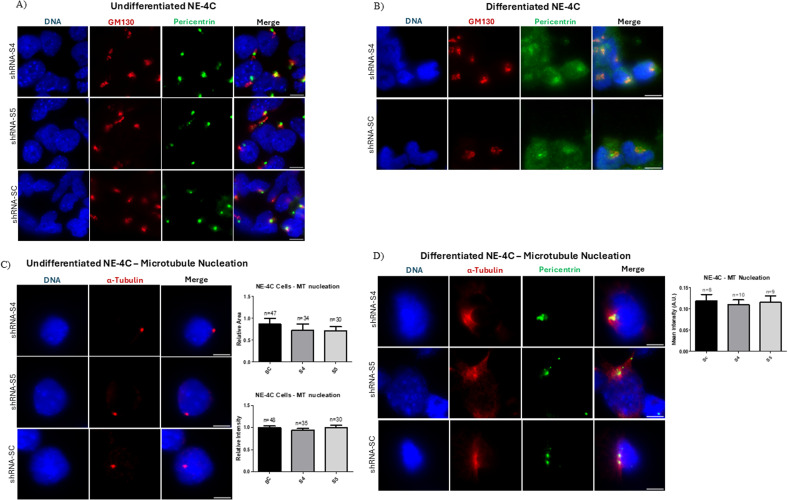
SLMAP3 is a tail-anchored membrane protein that targets subcellular organelles and is believed to regulate Hippo signaling. The global loss of SLMAP3 causes late embryonic lethality in mice, with some embryos exhibiting neural tube defects such as craniorachischisis. We show here that SLMAP3 -/- embryos display reduced length and increased width of neural plates, signifying arrested convergent extension. The expression of planar cell polarity (PCP) components Dvl2/3 and the activity of the downstream targets ROCK2, cofilin, and JNK1/2 were dysregulated in SLMAP3 -/- E12.5 brains. Furthermore, the cytoskeletal proteins (γ-tubulin, actin, and nestin) and apical components (PKCζ and ZO-1) were mislocalized in neural tubes of SLMAP3 -/- embryos, with a subsequent decrease in colocalization of PCP proteins (Fzd6 and pDvl2). However, no changes in PCP or cytoskeleton proteins were found in cultured neuroepithelial cells depleted of SLMAP3, suggesting an essential requirement for SLMAP3 for these processes in vivo for neurulation. The loss of SLMAP3 had no impact on Hippo signaling in SLMAP3 -/- embryos, brains, and neural tubes. Proteomic analysis revealed SLMAP3 in an interactome with cytoskeletal components, including nestin, tropomyosin 4, intermediate filaments, plectin, the PCP protein SCRIB, and STRIPAK members in embryonic brains. These results reveal a crucial role of SLMAP3 in neural tube development by regulating the cytoskeleton organization and PCP pathway.


Conflict of interest statement

The authors declare that they have no conflict of interest.

Figures

None
Graphical abstract
Figure S1.
Figure S1.. Breeding diagram to generate global KO of SLMAP in mice.
(A) During the cre-dependent phase, flox-SLMAP mice are crossed with CMV-cre mice to generate offspring, which contains one WT/one cleaved SLMAP allele and cre (SLMAP+/−:Cre). Backcrossing with a WT mouse will produce an animal that contains one cleaved SLMAP allele without cre (SLMAP+/−), thus beginning the cre-independent breeding phase. Breeding SLMAP+/− together will generate experimental animals, WT (SLMAP+/+), KD (SLMAP+/−), and KO (SLMAP−/−). (B) Schematic representing the flox-SLMAP gene, exon 3 flanked with LoxP sites. Primers F2 and R2 target sequences upstream and downstream of LoxP site 1, whereas R1 targets the sequence downstream of LoxP site 2. PCR amplicons run on separate lanes on a 1% gel to identify amplicon sizes produced from primer F2/R1 pairing and F2/R2 pairing. These will identify WT, KD, or KO experimental animals.
Figure 1.
Figure 1.. Loss of SLMAP3 leads to defective neurulation.
(A) Western blot image of E11.5 whole embryo lysates genotyped as WT (+/+), heterozygous (+/−), or KO (−/−) incubated with anti-SLMAP to determine SLMAP isoform expression. Bar graphs represent the expression of SLMAPs by normalizing with total protein visualized by Stain-Free technology. N = 6. *P < 0.05. The P-value was calculated using one-way ANOVA statistical analysis. (B) Representative neonatal pups underwent dissection microscopy to magnify the phenotypic differences in animals genotyped as WT (SLMAP3+/+), heterozygous (SLMAP3+/−), or KO (SLMAP3−/−) with a closed and open NT (neural tube). Images were captured with Stereo V.20 to demonstrate size differences, facial retrusion (stunted snout), tail formation, and spine and brain development. Lens magnification = 1x; microscope magnification = 7.5x; scale bar = 0.1 mm. Bar graphs represent length differences, craniofacial retrusion, and tail length in experimental animals (+/−, −/−) compared with the WT. *P < 0.05. The P-value was calculated using one-way ANOVA statistical analysis. N = 3. (C) Table displaying the penetrance of embryos displaying neural tube defects because of the loss of SLMAP3. NTDs occur in 38% of SLMAP3−/− embryos and consistently present with craniofacial retrusion, growth retardation, and short tail phenotypes. (D) Whole-mount images of WT and KO embryos during prenatal development (E8.5-E13.5). Scale bar = 1 mm. The bar graph represents body size and posterior neuropore in WT and KO E8.5 embryos, n = 3. (E) Transverse sectioning of WT (SLMAP+/+) and KO (SLMAP−/−) E8.5 and E9.5 embryos at closure site 1. Sections were stained with hematoxylin and eosin to visualize the cytoplasm and the nucleus. Scale bar = 50 μm. (F) Bar graphs comparing changes in the neural plate thickness in E8.5 and E9.5 neural tubes, n = 3. (G) Diagram and bar graph comparing changes in the E9.5 neural grove aperture in WT and KO sections, n = 3. (H) Heatmap representing results of RNA sequencing on E11.5 WT and KO whole embryo identifying genes associated with craniorachischisis with Euclidean clustering to highlight similarities in gene expression and experimental animals. The red color signifies lower log2FC, whereas green represents higher log2FC. N = 4. *P < 0.05. The P-value was calculated using an unpaired two-way t test.
Figure 2.
Figure 2.. Defects in neurulation caused by SLMAP3 loss are independent of Hippo signaling.
(A) Proposed schematic of SLMAP-STRIPAK components in Hippo signaling. (B) Western blots of WT or KO lysates from E11.5 whole embryos with anti-STRIPAK components (striatin-1, STRIP1, and PP2A-A/C). N = 3. (C) Western blots of WT (+/+), heterozygous (−/+), or KO (−/−) lysates from E11.5 whole embryos and activity of Hippo-activating kinase, with anti-phospho/total MST2, and downstream transcriptional coactivator, with anti-phospho/total YAP. N = 3. (D) Western blots of WT (+/+), heterozygous (−/+), or KO (−/−) lysates from E12.5 brains and activity of the Hippo downstream transcriptional coactivator, with anti-phospho/total YAP. Bar graphs represent the relative expression or activity of indicated proteins by normalizing to Stain-Free or the phospho-to-total protein ratio. N = 3. (E) Heatmap representing results of RNA sequencing on E11.5 WT and KO whole embryos identifying Hippo signaling target genes with Euclidean clustering to group similarities in gene expression and experimental animals. The red color signifies lower log2FC, whereas green represents higher log2FC. N = 4.
Figure S2.
Figure S2.. Defects in neurulation caused by the loss of SLMAP3 do not impact YAP or proliferation.
(A) Immunofluorescent imaging of sectioned E9.5 WT and SLMAP3−/− neural tubes labeled with DAPI (DNA) (blue) and anti-YAP (green). Sale bar = 20 μm. (B) Immunofluorescent imaging of sectioned E9.5 WT and SLMAP3−/− neural tubes labeled with DAPI (DNA) (blue) and anti-phospho-histone 3 (pH3) (orange). Scale bar = 20 μm. The arrowhead indicates the apical region of the neural tube.
Figure 3.
Figure 3.. Loss of SLMAP3 perturbs components of planar cell polarity.
(A) Schematic representing simplified PCP signaling regulating cytoskeletal dynamics through the asymmetrical distribution of Fzd/DVL and Vangl/Prickle. (B) Western blot images with anti-SLMAP in WT and KO E12.5 brain lysates and control whole embryo (W.E) lysates. (C) Representative Western blot images with anti-PCP signaling transducers (DVL1, DVL2, DVL3) and PCP signaling targets (ROCK2, cofilin, JNK1/2) in WT and KO E12.5 brain lysates. Bar graphs represent the relative expression of indicated proteins normalized to Stain-Free total protein or phosphorylated-to-total protein ratio. N = 4. *P < 0.05. The P-value was calculated using an unpaired two-way t test. (D) Immunofluorescent imaging of sectioned E8.5 control (WT or KD) and SLMAP3−/− neural tubes labeled with DAPI (DNA) (blue), anti-Fzd6 (green), and anti-phospho-DVL2 (red). Scale bar = 20 μm. Bar graphs represent Pearson’s correlation of Fzd6 and phospho-DVL2 staining of three images of one neural tube. The P-value was calculated using an unpaired two-way t test. (E) Western blots with anti-SCRIB, anti-Vangl1, and anti- Vangl2 in WT and KO E12.5 brain lysates. Bar graphs represent the relative expression of indicated proteins normalized to Stain-Free total protein. N = 4. (F) Western blots with anti-phospho-β-catenin and anti-β-catenin in WT and KO E12.5 brain lysates. Bar graphs represent the relative expression of phospho-to-total B-catenin. N = 4.
Figure 4.
Figure 4.. Loss of SLMAP3 impacts apical basal polarity components.
(A) Schematic representing how analyses in neural tubes were performed. Three lines from the basal to the apical region in each image were drawn for plot profile analysis. Distances and staining intensities were normalized to allow comparison with multiple profilers. (B) Immunofluorescent imaging of sectioned E8.5 control and SLMAP3−/− neural tubes labeled with DAPI (DNA) (blue) and phalloidin (F-actin) (green) showing the less concentration of F-actin in SLMAP3−/− neural tubes. Scale bar = 20 μm. Three lines in each of the multiple figures from one neural tube of each genotype were considered, totalizing n = 12 for KO and n = 12 for control. (C) Immunofluorescent imaging of sectioned E9.5 WT and SLMAP3−/− neural tubes labeled with DAPI (DNA) (blue) and phalloidin (F-actin) (orange) also indicating less apical localization of F-actin in SLMAP3−/− neural tubes. Scale bar = 20 μm. Three lines in each figure from one neural tube of each genotype were considered, totalizing n = 9 for KO and n = 6 for WT. (D) Immunofluorescent imaging of sectioned E9.5 WT and SLMAP3−/− neural tubes labeled with DAPI (DNA) (blue) and anti-aPKCζ (red) showing dispersed aPKCζ in SLMAP3−/− neural tubes. Scale bar = 20 μm. Three lines in each of the multiple figures from two neural tubes of each genotype were considered, totalizing n = 18 for KO and n = 15 for WT. (E) Immunofluorescent imaging of sectioned E8.5 control (WT/KD) and SLMAP3−/− neural tubes labeled with DAPI (DNA) (blue) and anti-ZO-1 (orange) showing dispersed ZO-1 in the apical region of SLMAP3−/− neural tubes. Scale bar = 20 μm. Three lines in each of the multiple figures from two neural tubes of each genotype were considered, totalizing n = 12 for KO and n = 12 for control. (F) Immunofluorescent imaging of sectioned E9.5 WT and SLMAP3−/− neural tubes labeled with DAPI (DNA) (blue) and anti-ZO-1 (orange) showing dispersed ZO-1 in the apical region of SLMAP−/− neural tubes. Scale bar = 20 μm. Three lines in each of the multiple figures from three neural tubes of each genotype were considered, totalizing n = 24 for KO and n = 24 for WT. (G) Immunofluorescent imaging of sectioned E9.5 WT and SLMAP3−/− neural tubes labeled with DAPI (DNA) (blue) and anti-nestin (red) indicating that nestin is more concentrated in the basal region of SLMAP3−/− neural tubes compared with the WT, where nestin is also visible across the neural tube. Scale bar = 20 μm. Three lines in each figure from four neural tubes of each genotype were considered, totalizing n = 12 for KO and n = 15 for WT. (H) Western blot images with anti-E-cad and anti-N-cad in WT and KO E12.5 brain lysates. Bar graphs represent the relative expression of indicated proteins normalized to Stain-Free total protein. N = 4. *P < 0.05, **P < 0.01, and ***P < 0.001. The P-value was calculated using an unpaired two-way t test. Arrowheads indicate the apical region of the neural tube.
Figure S3.
Figure S3.. SLMAP3 deficiency does not affect localization of adherent junctions.
(A) Immunofluorescent imaging of sectioned E8.5 WT and SLMAP3−/− neural tubes labeled with DAPI (DNA) (blue) and anti-N-cad (orange). Scale bar = 20 μm. (B) Immunofluorescent imaging of sectioned E8.5 control (WT or KD) and SLMAP3−/− neural tubes labeled with DAPI (DNA) (blue) and anti-β-catenin (orange). Scale bar = 20 μm. Three lines in each of the multiple figures from neural tubes of three KO and four control embryos were considered, totalizing n = 27 for KO and n = 33 for control. (C) Immunofluorescent imaging of sectioned E9.5 control (WT/KD) and SLMAP3−/− neural tubes labeled with DAPI (DNA) (blue) and anti-β-catenin (orange). Scale bar = 20 μm. Three lines in each of the multiple figures from neural tubes of two KO and two WT embryos were considered, totalizing n = 18 for KO and n = 15 for WT. The P-value was calculated using an unpaired two-way t test, but it did not reach statistical significance. Arrowheads indicate the apical region of the neural tube.
Figure 5.
Figure 5.. SLMAP associates with cytoskeletal elements.
(A) Protein–protein interaction network of the highest peptide discovery count for SLMAP3 determined from mass spectroscopy peptide analysis of anti-SLMAP immunoprecipitated E12.5 brain lysates (12). (B) GO analysis of molecular function, biological process, and cellular components associated with the network of proteins that interact with SLMAP3. (C) Western blot displaying the presence of SLMAP3, striatin-1, SCRIB, and nestin after immunoprecipitation of E12.5 brain lysates with anti-SLMAP and anti-IgG and blotting with anti-SCRIB, anti-striatin-1, and anti-nestin. (D) Immunofluorescent imaging of sectioned E9.5 WT and SLMAP3−/− neural tubes labeled with DAPI (DNA) (blue) and anti-γ-tubulin (red), indicating less tubulin in the apical regions of SLMAP3−/− neural tubes. Scale bar = 20 μm. Three lines in each of the multiple figures from two neural tubes of each genotype were considered, totalizing n = 12 for KO and n = 12 for WT. (E) Immunofluorescent imaging of sectioned E9.5 control (WT/KD) and SLMAP3−/− neural tubes labeled with DAPI (DNA) (blue) and anti-SCRIB (orange). Scale bar = 20 μm. (F) Immunofluorescent imaging of sectioned E9.5 WT and SLMAP3−/− neural tubes labeled with DAPI (DNA) (blue) and anti-Vangl2 (red). Scale bar = 20 μm. (G) Immunofluorescent imaging of WT and KO primary NEPCs labeled with DAPI (DNA) (blue) and phalloidin (F-actin) (green). Bar graphs represent the area, minor axis length, and perimeter of NEPCs. Scale bar = 8 μm. The number of cells analyzed is indicated in the graphs. **P < 0.01. The P-value was calculated using an unpaired two-way t test. Arrowheads indicate the apical region of the neural tube.
Figure S4.
Figure S4.. SLMAP is not required for Golgi organization in neural tubes and primary neuroepithelial cells (NEPCs).
(A) Immunofluorescent imaging of sectioned E9.5 WT and SLMAP3−/− neural tubes labeled with DAPI (DNA) (blue) and anti-GM130 (red). Bar graphs represent the area and major axis length of Golgi vesicles. Scale bar = 20 μm. The average from the images of three KO and three WT neural tubes is plotted. (B) Immunofluorescent imaging of WT and KO NEPCs labeled with DAPI (DNA) (blue) and anti-GM130 (red). Bar graphs represent the total Golgi area, units per cell, and mean area of Golgi vesicles in NEPCs. Scale bar = 8 μm. The P-value was calculated using an unpaired two-way t test. The arrowhead indicates the apical region of the neural tube.
Figure 6.
Figure 6.. Knockdown of SLMAP3 in NE-4C cells affects proliferation upon differentiation.
(A) shRNA (S4 & S5) that targets exon 22 of the SLMAP. (B) Western blot with anti-SLMAP in NE-4C cell lysates transduced with shRNA-S4, shRNA-S5, and shRNA-Sc. The bar graph represents the quantification of the relative expression of SLMAP3 normalized to Stain-Free total protein. N = 4. (C) Immunofluorescent imaging of shRNA-Sc, shRNA-S4, and shRNA-S5 undifferentiated NE-4C cells labeled with DAPI (DNA) (blue) and anti-phospho-histone 3 (pH3) (green). Scale bar = 100 μm. The number of fields analyzed is indicated in the graphs. Bar graphs represent the percentages of pH3-positive cells. (D) Immunofluorescent imaging of shRNA-Sc, shRNA-S4, and shRNA-S5 differentiated NE-4C cells labeled with DAPI (DNA) (blue) and anti-KI67 (green). Scale bar = 100 μm. The number of fields analyzed is indicated in the graphs. Bar graphs represent the percentages of Ki67-positive cells. (E) Immunofluorescent imaging of shRNA-Sc, shRNA-S4, and shRNA-S5 differentiated NE-4C cells labeled with DAPI (DNA) (blue) and TUNEL (red). Scale bar = 20 μm. *P < 0.05 and **P < 0.01. The P-value was calculated using one-way ANOVA statistical analysis.
Figure 7.
Figure 7.. SLMAP3 does not impact the distribution of ABP and PCP components in NE-4C cells.
(A) Immunofluorescent imaging of shRNA-Sc, shRNA-S4, and shRNA-S5 NE-4C cells labeled with DAPI (DNA) (blue) and phalloidin (F-actin) (green). The graph represents the relative intensity of F-actin in 27 cell–cell contacts across three biological samples. Scale bar = 20 μm. (B) Immunofluorescent imaging of shRNA-Sc, shRNA-S4, and shRNA-S5 NE-4C cells labeled with DAPI (DNA) (blue) and anti-ZO-1 (green). The graph represents the relative intensity of ZO-1 in 15 cell–cell contacts. Scale bar = 20 μm. (C) Immunofluorescent imaging of shRNA-Sc, shRNA-S4, and shRNA-S5 NE-4C cells labeled with DAPI (DNA) (blue) and anti-SCRIB (green). The graph represents the distribution of the relative intensity of SCRIB in 35 cell–cell contacts across two biological samples. Scale bar = 20 μm. (D) Immunofluorescent imaging of shRNA-Sc, shRNA-S4, and shRNA-S5 NE-4C cells labeled with DAPI (DNA) (blue) and anti-Vangl2 (red). The graph represents the distribution of the relative intensity of Vangl2 in 30 cell–cell contacts across two biological samples. Scale bar = 20 μm. (E) Immunofluorescent imaging of shRNA-Sc, shRNA-S4, and shRNA-S5 NE-4C cells labeled with DAPI (DNA) (blue), anti-Fzd6 (green), and anti-phospho-DVL2 (red). Scale bar = 20 μm. The bar graph represents Pearson’s correlation of Fzd6 and phospho-DVL2 in the SLMAP KD (shRNA-S4 and shRNA-S5) and control (shRNA-Sc) neural tube. The number of fields quantified is indicated in the graph. The P-value was calculated using an unpaired two-way t test.
Figure S5.
Figure S5.. SLMAP3 does not impact adherent junctions in NE-4C cells.
(A, B) Immunofluorescent imaging of shRNA-Sc, shRNA-S4, and shRNA-S5 (A) undifferentiated (scale bar = 20 μm) and (B) differentiated (scale bar = 10 μm) NE-4C cells labeled with DAPI (DNA) (blue) and anti-N-cadherin (green).
Figure S6.
Figure S6.. Knockdown of SLMAP3 in NE-4C cells does not affect microtubule nucleation activity.
(A, B) Immunofluorescent imaging of shRNA-Sc, shRNA-S4, and shRNA-S5 (A) undifferentiated and (B) differentiated NE-4C cells labeled with DAPI (DNA) (blue), anti-GM130 (red), and anti-pericentrin (green). Scale bar = 10 μm. (C) Immunofluorescent imaging of shRNA-Sc, shRNA-S4, and shRNA-S5 undifferentiated NE-4C cells labeled with DAPI (DNA) (blue) and anti-α-tubulin (red) that underwent microtubule nucleation assay. Scale bar = 10 μm. The bar graph represents the relative area and relative intensity of α-tubulin. The number of cells quantified is indicated in the graphs. (D) Immunofluorescent imaging of shRNA-Sc, shRNA-S4, and shRNA-S5 differentiated NE-4C cells labeled with DAPI (DNA) (blue), anti-α-tubulin (red), and anti-pericentrin (green) that underwent a microtubule nucleation assay. Scale bar = 10 μm. The bar graph represents the mean intensity of α-tubulin within the pericentrin region. Scale bar = 20 μm. The P-value was calculated using one-way ANOVA statistical analysis.

References

    1. Copp AJ, Greene NDE (2013) Neural tube defects—disorders of neurulation and related embryonic processes. Wiley Interdiscip Rev Dev Biol 2: 213–227. 10.1002/wdev.71 - DOI - PMC - PubMed
    1. Wigle JT, Eisenstat DD (2023) Neural induction and regionalization Neurodevelopmental Pediatrics. New York, NY: Springer International Publishing: 29–38.
    1. Martin AC, Goldstein B (2014) Apical constriction: Themes and variations on a cellular mechanism driving morphogenesis. Development 141: 1987–1998. 10.1242/dev.102228 - DOI - PMC - PubMed
    1. Ravichandran Y, Goud B, Manneville JB (2020) The Golgi apparatus and cell polarity: Roles of the cytoskeleton, the Golgi matrix, and Golgi membranes. Curr Opin Cell Biol 62: 104–113. 10.1016/j.ceb.2019.10.003 - DOI - PubMed
    1. Nikolopoulou E, Galea GL, Rolo A, Greene NDE, Copp AJ (2017) Neural tube closure: Cellular, molecular and biomechanical mechanisms. Development 144: 552–566. 10.1242/dev.145904 - DOI - PMC - PubMed