. 2024 Oct 4;7(12):e202402627.
doi: 10.26508/lsa.202402627. Print 2024 Dec.

Mitochondria remodeling during endometrial stromal cell decidualization

Affiliations

Mitochondria remodeling during endometrial stromal cell decidualization

Marco Dalla Torre et al. Life Sci Alliance. .

Abstract

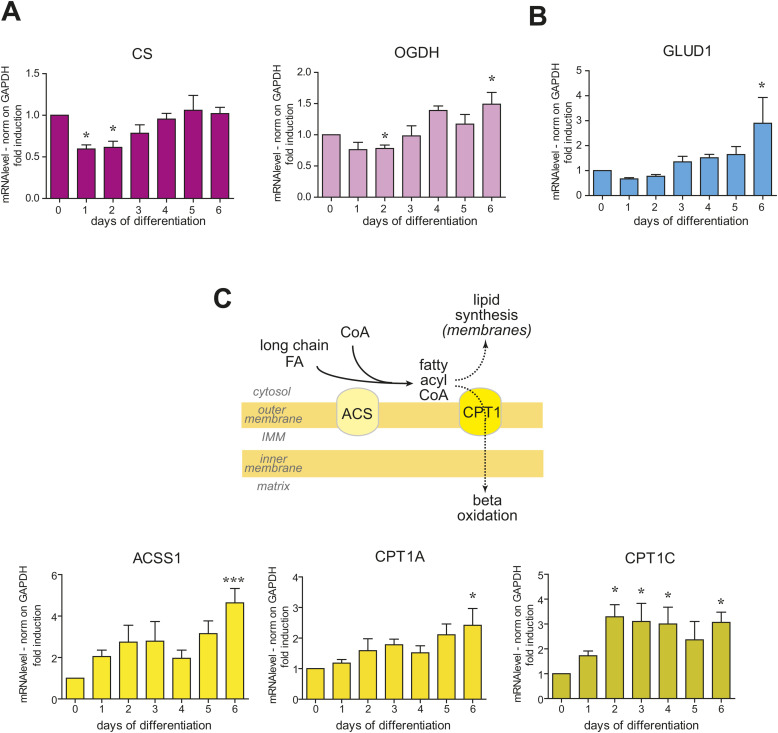
Upon hormonal stimulation, uterine endometrial stromal cells undergo a dramatic morpho-functional metamorphosis that allows them to secrete large amounts of matrix proteins, cytokines, and growth factors. This step, known as decidualization, is crucial for embryo implantation. We previously demonstrated how the secretory pathway is remodelled during this process. Here we show that hormonal stimulation rapidly induces the expression of many mitochondrial genes, encoded in both the mitochondrial and the nuclear genomes. Altogether, the mitochondrial network quadruples its size and establishes more contacts with the ER. This new organization results in the increased respiratory capacity of decidualized cells. These findings reveal how achieving an efficient secretory phenotype requires a radical metabolic rewiring.


Conflict of interest statement

The authors declare that they have no conflict of interest.

Figures

Figure S1.
Figure S1.. Mitochondrial dynamics in decidualized cells.
(A) Analysis of decidualization markers. Real-time qPCR analysis of known decidualization markers (prolactin and IGFBP1). The samples correspond to RNAs collected on different days of in vitro decidualization of T-HESC, with seven independent replicates. Results were normalized on GAPDH mRNA and represented as mean ± SEM. One-way ANOVA followed by Dunnett’s multiple comparison tests on day 0 was performed. (B) Despite their elongation, the mitochondria of decidualized cells are highly dynamic. Live fluorescence imaging of the mitochondrial network in a decidualized cell. Representative time-lapse acquisition after MitoTracker Red staining. Details showing events of mitochondrial transport (a, b), fission (c, d), and fusion (e, f) events are shown in the lower panels. 60× magnification; bar: 20 μm.
Figure 1.
Figure 1.. Decidualization entails mitochondria network enlargement.
(A) Mitochondria reorganize during decidualization. Proliferative and decidualized cells were fixed and immunostained for HLA-1, to visualize the plasma membrane (cyan), and for the mitochondrial marker TOM20 (red). Note the enlargement of the cell volume and the clear expansion of the mitochondrial network in decidualized EnSCs. 100× magnification, bar: 20 μm. (B) Mitochondrial volume significantly increases upon decidualization. Immunofluorescence-based morphometric analysis of total cell volume (HLA-1) and of the mitochondrial network (TOM20), in three independent experiments (see the Materials and Methods section for details). Results are expressed as absolute volumes and relative mitochondria abundance. The plots show mean ± SEM and individual values of each group, t test. (C, D) Decidualization increases the expression of mitochondrial proteins. Western blot assays (C) and densitometric quantification (D) of different mitochondrial proteins localized in diverse mitochondrial subcompartments. The protein extracts corresponding to the same number of cells (100,000) were loaded in each lane under reducing conditions (see the Materials and Methods section for details). MW markers are shown on the left. Images were quantified with Image J and normalized first on H3 for loading, and then on day 0 for each staining. The graphs show the mean (+/− SEM) of a minimum of three independent experiments. One-way ANOVA followed by Dunnett’s multiple comparison test on day 0 was performed.
Figure 2.
Figure 2.. Decidualization reshapes the mitochondrial network and its contacts with the ER.
(A) Decidualization reshapes the mitochondrial network morphology. Three-dimensional representation of the mitochondrial network of proliferative and decidualized T-HESCs (days 0 and 6 of hormonal stimulation, respectively). The reconstruction was performed with Arivis 4D software based on representative immunofluorescences of TOM20 at 100× magnification. Scale bar: 10 μm. (B, C) Mitochondria elongate during decidualization. Morphometric analyses of mitochondrial elongation: analysis of the main axis. (B) Mitochondria were grouped in arbitrary length classes, based on their main axes. Results were expressed in proportion to the total number of mitochondria analyzed in two independent replicates (≥25 cells for each condition). Kolmogorov-Smirnov test. (C) Fold change of the relative frequency of mitochondria belonging to different length classes. The results are expressed as log2. (D) Transmission electron microscopy reveals close interactions between ER and mitochondria. Transmission electron microscopy of proliferative (D0, left) and decidualized (D6, right) T-HESCs. Details including contacts between ER and mitochondria are shown for both panels with the same magnification factor (3.5x). Representative images of three independent replicates. Scale bar: 1 μm. (E, F) ER and mitochondria increase their association during decidualization. TEM-based analyses of MERCs. (E) Classification of mitochondria based on the number of contact sites established with the ER. Results are expressed in proportion with the total number of mitochondria analyzed for each condition, t test. (F) Analysis of the total length of the MERCs established by each mitochondrion, normalized over the size of the mitochondrion itself (i.e., the perimeter of the object in TEM images), t test.
Figure S2.
Figure S2.. Miotchondria-ER contact sites increase in decidualized cells.
(A) Transmission electron microscopy of proliferative (D0, left) and decidualized (D6, right) T-HESCs. Yellow arrowheads indicate points in which mitochondria could have crossed the sectioning plane. Red arrowheads indicate mitochondria with morphological abnormalities. (B, C) Morphological analysis of mitochondria based on the TEM images acquired in three independent biological replicates confirmed mitochondrial elongation in decidualized cells. (B, C) The elongation of individual objects is expressed as Roundness (panel (B)) and aspect ratio (AR, i.e., the ratio between the major and the minor axes of the ellipse best fitting the object shape) (panel (C)). The plots show the mean ± SEM and the individual values (D0 = proliferative cells; D6 = decidualized cells), t test. (D) Mitochondria preferentially associate with the smooth ER. Co-immunofluorescence of mitochondria (stained by Mitotracker Red), PDI (rough ER), and RTN4 (smooth and rough ER). Details of the proximity of ER markers and mitochondria are shown. Scale bar: 20 μm.
Figure S3.
Figure S3.. Decidualization reduces glycolysis.
Analysis of ECAR measurements referred to Fig 3. Data are mean ± SD, 14 technical replicates for each experimental condition were analyzed.
Figure 3.
Figure 3.. Decidualization entails a switch in EnSCs’ energy metabolism.
(A) Analysis of OCR measurement of one representative experiment in proliferative (D0) and decidualized (D6) T-HESCs, in basal condition and after sequential addition of oligomycin (O), FCCP, and antimycin/rotenone (A/R). 14 technical replicates for each experimental condition were analyzed. (A, B) Quantification of basal respiration, ATP production, spare respiratory capacity, and maximal respiration in (A). Data in bar plots are mean ± SD, t test. (A, C) Cell energy phenotype plot showing mitochondrial respiration (oxygen consumption rate, OCR) versus glycolysis (extracellular acidification rate, ECAR) rates of proliferative (D0) and decidualized (D6) T-HESCs in (A).
Figure 4.
Figure 4.. Decidualization reshapes the transcriptional pattern of mitochondrial genes.
(A) Time-course over-representation analysis for the genes up-regulated (DEG UP) or down-regulated (DEG DOWN) at different time points. MitoCarta terms associated with different biological functions of mitochondria were analyzed. Statistical significance of the over-representation analysis is graphically represented by the different sizes of the circles. (B) Heatmap of genes differentially expressed during the decidualization program. Normalized expression values were z-scaled and represented as a color gradient. Genes were selected and grouped based on the biological functions mediated by their products. Mitochondrial-encoded OXPHOS genes were considered a separate group based on the peculiarity of their expression mechanisms. (C) qRT-PCR analysis of genes involved in oxidative phosphorylation. The samples correspond to RNAs collected on different days of in vitro decidualization of T-HESC, with a minimum of six independent replicates. Results were normalized on GAPDH mRNA and represented as mean ± SEM. One-way ANOVA followed by Dunnett’s multiple comparison tests on day 0 was performed.
Figure S4.
Figure S4.. Decidualization entails modulation of genes for lipid methabolism and calcium homeostasis.
(A) PISD, a key enzyme in phosphatidylethanolamine production, is induced during decidualization. Real-time qPCR analysis of phosphatidylserine decarboxylase (PISD). The samples correspond to RNAs collected at different days of in vitro decidualization of T-HESC, with six independent replicates. Results were normalized on GAPDH mRNA and represented as mean ± SEM. One-way ANOVA followed by Dunnett’s multiple comparison tests on day 0 was performed. On the left, schematic representation of the metabolic pathway in which PISD is involved. (B) Almost all components of the mitochondrial calcium uniporter complex (MCU) are up-regulated during decidualization. Real-time qPCR analysis of the different MCU components. The samples correspond to RNAs collected on different days of in vitro decidualization of T-HESC, with five independent replicates. Results were normalized on GAPDH mRNA and represented as mean ± SEM. One-way ANOVA followed by Dunnett’s multiple comparison tests on day 0 was performed. On the left, schematic representation of the MCU structure.
Figure S5.
Figure S5.. Mitochondrial metabolic pathway transcriptional remodelling during decidualization.
(A, B, C) Pattern of expression of key enzymes involved in different mitochondrial metabolic pathways ((A): Krebs cycle; (B): glutamine metabolism; (C): fatty acid import and oxidation) during decidualization. The samples correspond to RNAs collected on different days of in vitro decidualization of T-HESC, with six independent replicates. Results were normalized on GAPDH mRNA and represented as mean ± SEM. One-way ANOVA followed by Dunnett’s multiple comparison tests on day 0 was performed.
Figure 5.
Figure 5.. Nuclear translocation of PGC-1α is an early event in T-HESC decidualization.
(A) Immunofluorescence of PGC-1α at early time points of decidualization. Nuclei were counter-stained with DAPI to verify the nuclear translocation of the transcription factor. Images representative of two independent replicates. 60× magnification; scale bar: 20 μm. The graph at the bottom right represents the quantification of the nuclear translocation of PGC-1α: the bars show the average intensity of PGC-1α immunostaining in the nucleus, ± SEM (ctrl 42 cells, 6 h 66 cells, 72 h 50 cells). One-way ANOVA followed by Dunnett’s multiple comparison tests on day 0 was performed. (B) qRT-PCR analysis of key transcription factors involved in mitochondria biogenesis. The samples correspond to RNAs collected on different days of in vitro decidualization of T-HESC, with a minimum of four independent replicates. Results were normalized on GAPDH mRNA and represented as mean ± SEM. One-way ANOVA followed by Dunnett’s multiple comparison tests on day 0 was performed.

References

    1. Abrisch RG, Gumbin SC, Wisniewski BT, Lackner LL, Voeltz GK (2020) Fission and fusion machineries converge at ER contact sites to regulate mitochondrial morphology. J Cell Biol 219: e201911122. 10.1083/jcb.201911122 - DOI - PMC - PubMed
    1. Abu Shelbayeh O, Arroum T, Morris S, Busch KB (2023) PGC-1α is a master regulator of mitochondrial lifecycle and ROS stress response. Antioxidants (Basel) 12: 1075. 10.3390/antiox12051075 - DOI - PMC - PubMed
    1. Aebi M (2013) N-linked protein glycosylation in the ER. Biochim Biophys Acta 1833: 2430–2437. 10.1016/j.bbamcr.2013.04.001 - DOI - PubMed
    1. Albrecht ED, Pepe GJ (2010) Estrogen regulation of placental angiogenesis and fetal ovarian development during primate pregnancy. Int J Dev Biol 54: 397–408. 10.1387/ijdb.082758ea - DOI - PMC - PubMed
    1. Alfarouk KO, Ahmed SBM, Elliott RL, Benoit A, Alqahtani SS, Ibrahim ME, Bashir AHH, Alhoufie STS, Elhassan GO, Wales CC, et al. (2020) The pentose phosphate pathway dynamics in cancer and its Dependency on intracellular pH. Metabolites 10: 285. 10.3390/metabo10070285 - DOI - PMC - PubMed