. 2024 Oct 4;15(1):8601.
doi: 10.1038/s41467-024-52908-z.

Self-assembling nanoparticle engineered from the ferritinophagy complex as a rabies virus vaccine candidate

Affiliations

Self-assembling nanoparticle engineered from the ferritinophagy complex as a rabies virus vaccine candidate

Dan Fu et al. Nat Commun. .

Abstract

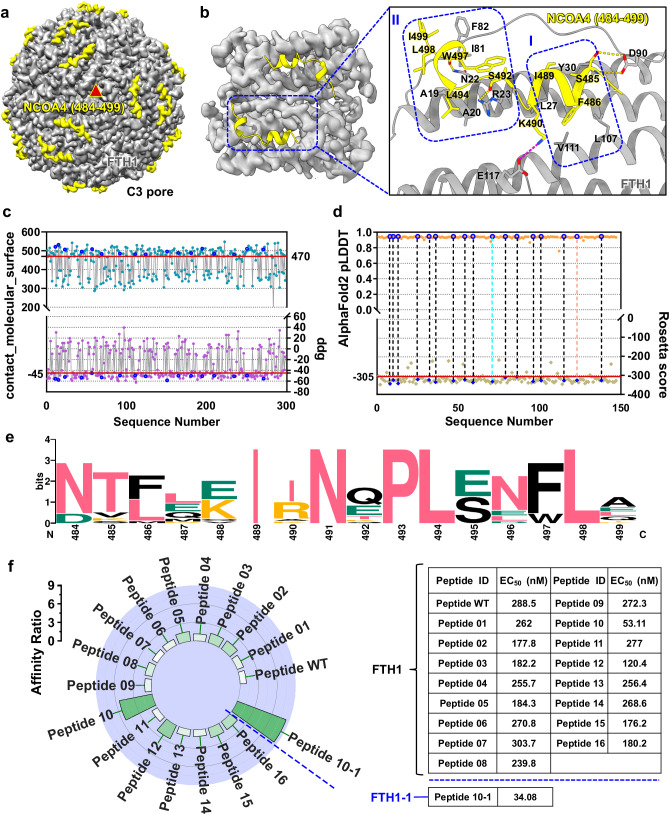
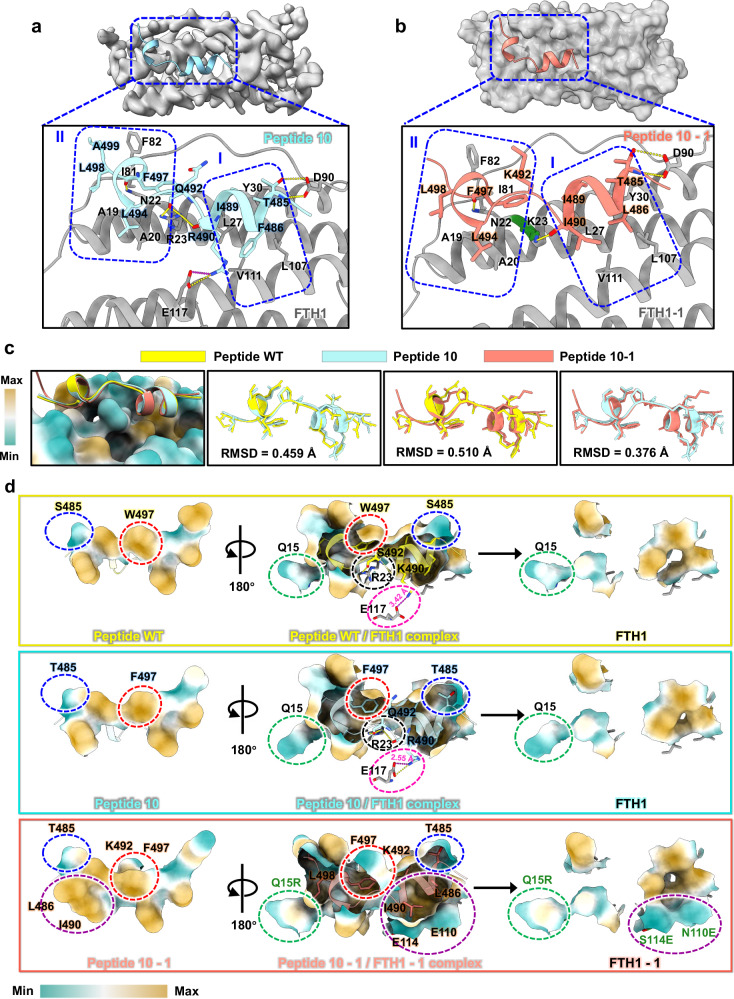
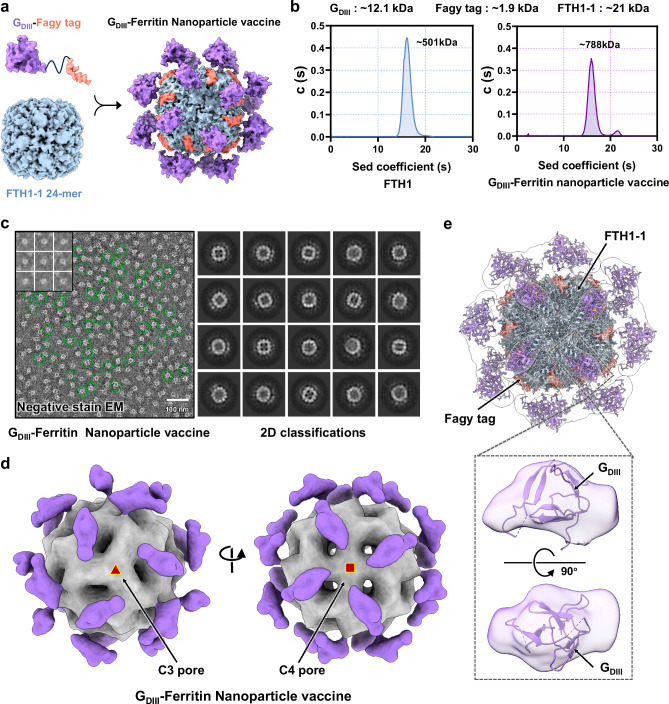
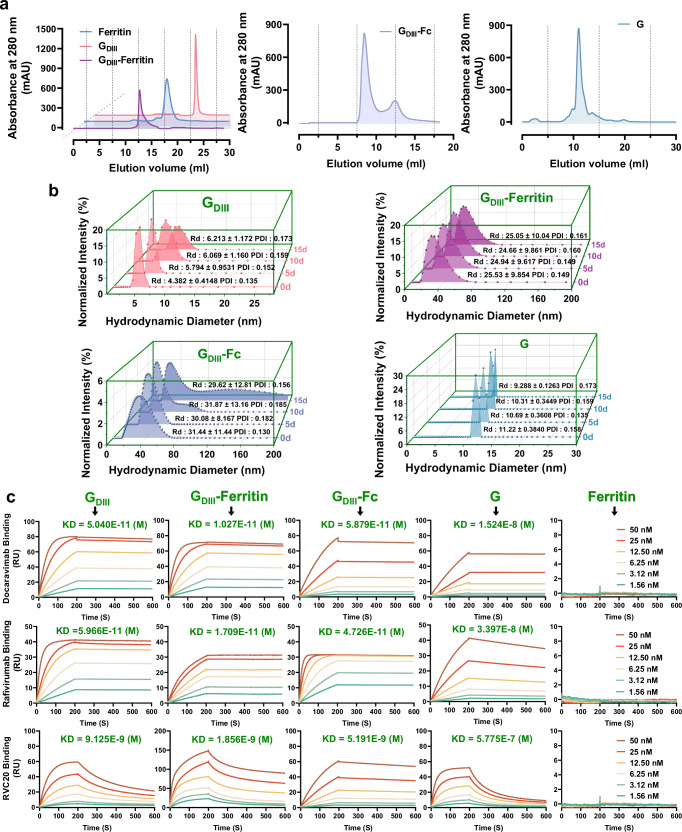
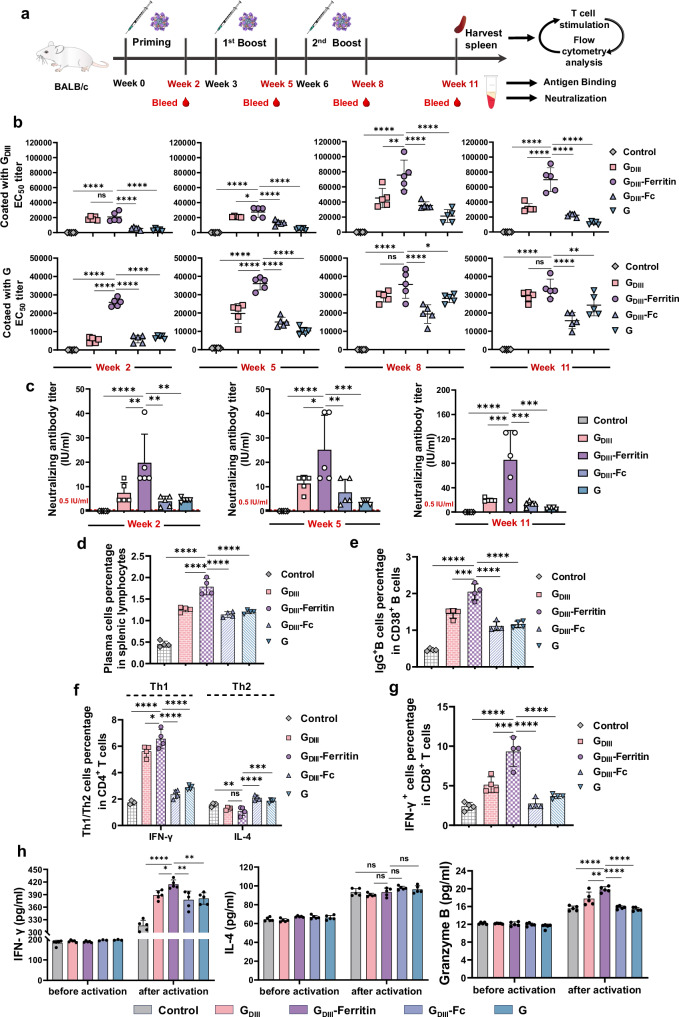
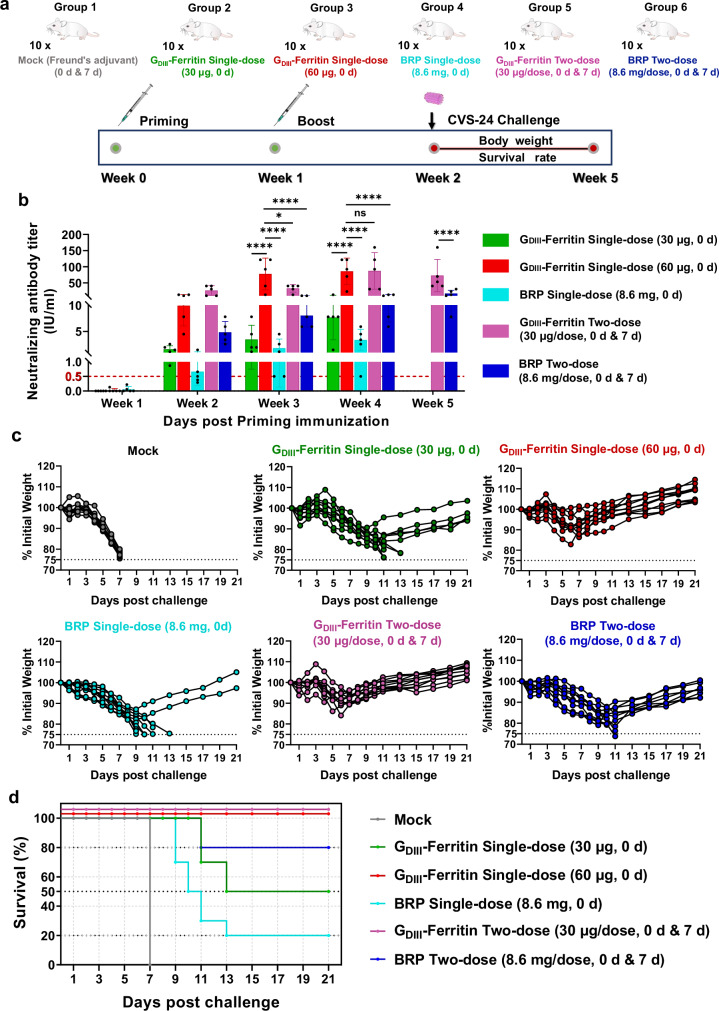
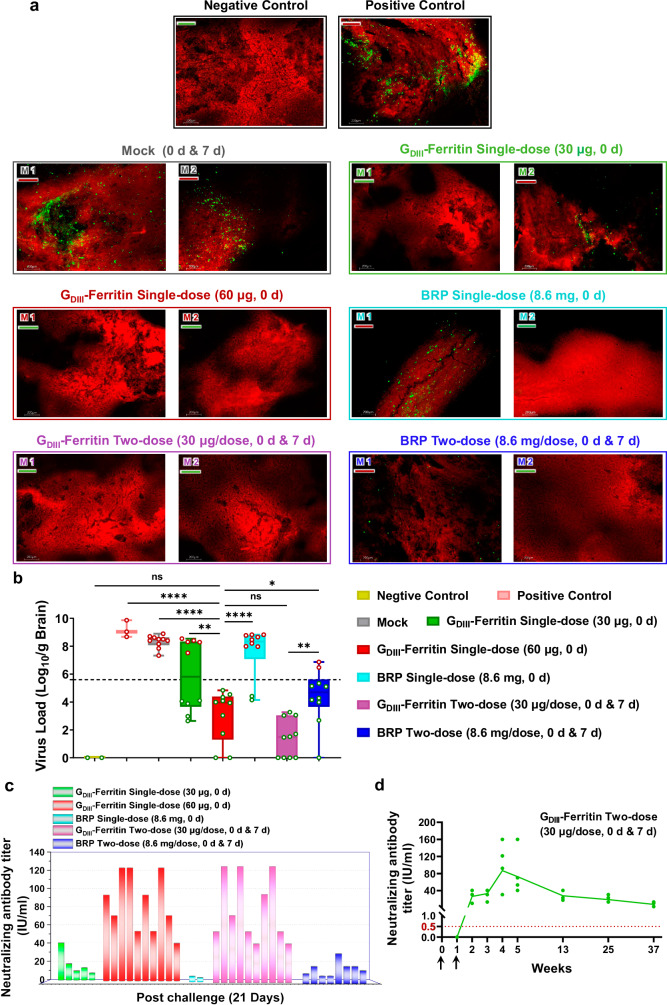
Over the past decade, there has been a growing interest in ferritin-based vaccines due to their enhanced antigen immunogenicity and favorable safety profiles, with several vaccine candidates targeting various pathogens advancing to phase I clinical trials. Nevertheless, challenges associated with particle heterogeneity, improper assembly and unanticipated immunogenicity due to the bulky protein adaptor have impeded further advancement. To overcome these challenges, we devise a universal ferritin-adaptor delivery platform based on structural insights derived from the natural ferritinophagy complex of the human ferritin heavy chain (FTH1) and the nuclear receptor coactivator 4 (NCOA4). The engineered ferritinophagy (Fagy)-tag peptide demonstrate significantly enhanced binding affinity to the 24-mer ferritin nanoparticle, enabling efficient antigen presentation. Subsequently, we construct a self-assembling rabies virus (RABV) vaccine candidate by noncovalently conjugating the Fagy-tagged glycoprotein domain III (GDIII) of RABV to the ferritin nanoparticle, maintaining superior homogeneity, stability and immunogenicity. This vaccine candidate induces potent, rapid, and durable immune responses, and protects female mice against the authentic RABV challenge after single-dose administration. Furthermore, this universal, ferritin-based antigen conjugating strategy offers significant potential for developing vaccine against diverse pathogens and diseases.


Conflict of interest statement

Y.G., D.F., and P.Y. declare the following competing interests: patent has been filed for the Fagy-tag and self-assembly nanoparticle system presented here. All other authors declare no competing interests.

Figures

Fig. 1
Fig. 1. Engineering, characterization, and screening of peptide adapters based on the structure of the NCOA4/FTH1 complex.
a Front view of the 24-mer single-particle cryo-EM density map of the NCOA4 (484–499)/FTH1 complex at the central point of threefold symmetry axes. NCOA4 (484–499) colored yellow and FTH1 colored gray. b Structural analysis of the NCOA4 (484–499)/FTH1 complex. Residues comprising hydrophobic cores I and II are enclosed. Interface residues are labeled and represented as sticks. Hydrogen bonds are depicted with yellow dashed lines, and salt bridges are depicted with magenta dashed lines. c After designing sequences using ProteinMPNN, Rosetta score, Rosetta binding energy (ddg) values and packing (contact_molecular_surface) were calculated by Rosetta. Red lines serve as baselines, indicating the median values of ddg and contact_molecular_surface. Sequences falling within the threshold defined by the two red lines are excluded. The blue circles represent the values of ddg and contact_molecular_surface for sequences that have undergone subsequent experimental characterization. d Precise sequence screening based on the Rosetta score and the AlphaFold2 pLDDT. The red line represents the baseline, indicating the median value of the Rosetta score. The blue circles highlight the evaluation values of the Rosetta score and the AlphaFold2 pLDDT for sequences that have undergone subsequent experimental characterization. e Amino acid conservation analysis of all peptide sequences utilized for experimental characterization using WebLogo. f Analysis of the binding affinity between the engineered peptide and ferritin. The affinity of various designed peptides was compared to that of the wild-type peptide, with the affinity of the wild-type peptide for FTH1 (EC50 = 288.5 nM) set as the baseline value of 1. The increase in affinity of the designed peptides relative to the baseline value is depicted, with a color gradient from white to green indicating an increase in affinity from low to high. The table on the right displays specific EC50 values characterizing the binding affinities of various peptides. The EC50 values were obtained through nonlinear regression dose-response stimulation analysis of ELISA data using GraphPad Prism 8.0.2 software with the log(agonist) vs. Response-variable slope (four parameters) model. Each value represents the average of three repeated experiments.
Fig. 2
Fig. 2. Structural analysis of high-affinity peptide adapter models and evaluation of engineering precision.
a Structural analysis of the Peptide 10/FTH1 complex. Specific details of the interactions at the binding interface are presented in the enlarged panel below. Residues contributing to the formation of hydrophobic cores I and II are enclosed. Peptide 10 is colored pale turquoise, and FTH1 is colored gray. b Structural analysis of the Peptide 10-1/FTH1-1 complex. The specific details of these interactions are further elucidated in the enlarged panel below. Residues contributing to the formation of hydrophobic cores I and II are enclosed. Peptide 10-1 is colored salmon, and FTH1-1 is presented as an opaque surface in gray. The mutated residues on FTH1-1 that are involved in these interactions are colored in deep green. c Structure alignment between the initial models and the high-affinity peptide models. The RMSD values for the alignment of different peptides are displayed. Ferritin is presented on the surface, and the binding interface is color coded according to hydrophobic properties (from weak to strong: cyan–white–maroon). Peptide WT is colored yellow, Peptide 10 is colored pale turquoise, and Peptide 10-1 is colored salmon. d The impact of key residue mutations on the binding affinity of the peptide for ferritin. Specific details of the critical interactions involved in stabilizing the complex structure are highlighted with dashed outlines in different colors. Residues involved in hydrophobic interactions are displayed on the surface. The sequence is colored according to hydrophobic properties (weak to strong: cyan–white–maroon). The residues that were mutated in FTH1-1 and participate in interactions are highlighted in deep green. Hydrogen bonds are represented by yellow dashed lines, and salt bridges are represented by magenta dashed lines.
Fig. 3
Fig. 3. The antigen presentation efficiency and performance mode of GDIII-Ferritin nanoparticle vaccine.
a Schematic representation of a fusion protein comprising multiple copies of Fagy-tagged GDIII antigens, an FTH1-1-based 24-meric nanoparticle, and a GDIII-Ferritin nanoparticle vaccine complex. b The states of ferritin and GDIII-Ferritin in solution were confirmed by analytical ultra-centrifugation (AUC) assay. The calculated molecular weights corresponding to each peak in AUC, where they are labeled above the curve. “Sed” stands for sedimentation. Experiments were conducted independently in triplicates. c Negative stain EM image of the GDIII-Ferritin nanoparticle vaccine. Raw image (left panels) and 2D classifications (right panels). The top left corner of the left panel is a representative image of particle picking. The green circles highlight representative vaccine particles. The 644 negative stain EM images of GDIII-Ferritin nanoparticle vaccine show similar antigen delivery efficiency and particle dispersion. d 3D reconstruction electron density map of the GDIII-Ferritin nanoparticle vaccine from negative stain EM data. The left panel shows a map of positive projection with threefold symmetry axes at the center. The right panel shows a map of positive projection with fourfold symmetry axes at the center. The entire map is displayed on an opaque surface, the delivery core is shaded in gray, and the spikes are colored in medium purple. e Fitting of the GDIII-Ferritin density map to the RABV GDIII structure (PDB: 6TOU) model and the Peptide 10-1/FTH1-1 structure model (PDB: 8WIE). The positions of GDIII, ferritin, and the Fagy tag are all indicated. The lower panel provides an enlarged view of the spike region of the GDIII-Ferritin density map fitted to the GDIII structure model. The map is displayed in transparent surface form.
Fig. 4
Fig. 4. Stability and antigenic evaluation of the rabies subunit vaccines.
a Chromatographic purification profiles of the four vaccines. Ferritin is shown as a steel blue curve, GDIII is shown as a rose-red curve, GDIII-Ferritin in a purple curve, GDIII-Fc is shown as a conch curve, and G is shown as a blue-gray curve. b Changes in the hydrodynamic particle size distribution of the four vaccines over 15 days of storage at 4 °C. c SPR kinetic tests for the binding affinity between the four vaccines, scaffold ferritin protein and three GDIII epitope-specific neutralizing antibodies (Docaravimab, Rafivirumab, and RVC20). Sensor grams were obtained using a Biacore T200 instrument at six different concentrations (ranging from 50 to 1.56 nM for each analyte, using twofold dilution). KD: dissociation equilibrium constant calculated as Kd/Ka; smaller values generally indicate stronger binding, as indicated in the respective graphs. All the curves were best fitted using GraphPad Prism 8.0.2.
Fig. 5
Fig. 5. Immunogenicity assessment of the rabies subunit vaccines.
a Schematic representation of the mouse immunization process (n = 5). b Titers of GDIII/G-specific serum-binding antibodies induced by different vaccines at 2, 5, 8, and 11 weeks after priming immunization. The upper panel shows the antigen GDIII. The lower panel shows the antigen G (n = 5). c Titers of neutralizing antibodies in mouse sera from different immunization groups at 2, 5, and 11 weeks after priming immunization (n = 5). The titers plotted were from rabies live virus (CVS-11) neutralization experiments. d Statistical analysis of the frequency of antibody-producing cells (CD138+ plasma cells) in splenic lymphocytes induced by vaccines (n = 4). The gating strategy is shown in Supplementary Fig. 10a. e Statistical analysis of the frequency of IgG-specific memory B cells located in the spleen germinal centers (GCs) induced by the vaccines (n = 4). The gating strategy is shown in Supplementary Fig. 10a. f Statistical analysis of the frequency of CD4+ IFN-γ+ Th1 and CD4+ IL-4+ Th2 cells, presented as a percentage of total CD4+ T cells, reflecting the activation status of different functional T-cell subsets (n = 4). The gating strategy is shown in Supplementary Fig. 12a. g Statistical analysis of the frequency of CD8+ IFN-γ+ cytotoxic T lymphocytes, presented as a percentage of total CD8+ T cells, reflecting the activation status of cytotoxic effector T cells (n = 4). The gating strategy is shown in Supplementary Fig. 12a. h Determination of characteristic cytokines secreted by T cells isolated from the spleens of experimental mice before and after activation (n = 5). The concentrations of serum cytokines were calculated by fitting the OD450 values obtained from ELISA to the regression line equation. All spleen lymphocytes used for cell typing were derived from mouse spleens 5 weeks after the second booster immunization. In (bh), all experiments were conducted independently in triplicates, all the data represented as mean ± SEM and were analyzed using one-way ANOVA followed by Tukey’s multiple comparison post hoc test. ns (not significant), *p < 0.05, **p < 0.01, ***p < 0.001, ****p < 0.0001. Source data are provided as a Source Data file.
Fig. 6
Fig. 6. Evaluation of the protective efficacy of the GDIII-Ferritin nanoparticle vaccine.
a Schematic representation of the vaccination strategies and rabies virus challenge protocols for different groups of experimental mice. (n = 10/group). Group 1 (Mock) served as the negative control and received two subcutaneous immunizations with Freund’s adjuvant; Group 2 was the GDIII-Ferritin nanoparticle vaccine single-dose (30 μg, 0 d) group that received a single subcutaneous immunization; Group 3 was the GDIII-Ferritin nanoparticle vaccine single-dose (60 μg, 0 d) group that received a single subcutaneous immunization; Group 4 was the commercial rabies vaccine BRP single-dose (8.6 mg, 0 d) group that received a single subcutaneous immunization. Group 5 was the GDIII-Ferritin nanoparticle vaccine two-dose (30 μg/dose, 0 d and 7 d) group that received two subcutaneous immunizations; Group 6 was the commercial rabies vaccine BRP two-dose (8.6 mg/dose, 0 d and 7 d) group that received two subcutaneous immunizations. All the experimental mice underwent intracranial rabies virus challenge on day 14 post priming immunization. b Virus neutralizing antibody titers (VNATs) in the sera of mice within 28 days full-dose vaccine immunization (n = 5). Experiments were conducted independently in triplicates. Data represented as mean ± SEM and were analyzed using one-way ANOVA followed by Tukey’s multiple comparison post hoc test. ns (not significant), *p < 0.05, **p < 0.01, ****p < 0.0001. c Weight changes in mice during challenge with the rabies virus CVS-24 strain were recorded for 21 days. d The survival rates of the infected mice were calculated during 21 days post challenge. Source data are provided as a Source Data file.
Fig. 7
Fig. 7. Evaluation of the protective efficacy of the GDIII-Ferritin nanoparticle vaccine.
a Representative images of direct immunofluorescence localization of the virus in animal brain tissues from control or experimental mice by DFA. Bright apple-green fluorescent spots represent the RABV. Brain tissue slices from deceased mice are labeled with a red underscore, and slices from surviving mice are labeled with a green underscore. b Quantification of rabies virus (CVS-24) nucleoprotein genomic RNA in mouse brains determined by qRT-PCR (n = 10). The virus load in the brain of deceased mice was quantified on the day of death, while in surviving mice, it was assessed on the 21st day post challenge. The brain tissue of healthy mice was used as a negative control, and the non-immune mice injecting with equal virus were used as a positive control (red spots indicate samples from deceased mice, while green spots represent samples from surviving mice, with a dotted line distinguishing between deceased and surviving mice). Experiments were conducted independently in triplicates. Data represented as mean ± SEM. Data were shown as box-and-whiskers plots (box indicates lower and upper quartiles with bar at median and whiskers spanning minimum and maximum data points) with individual data points and analyzed using one-way ANOVA followed by Tukey’s multiple comparison post hoc test. ns (not significant), *p < 0.05, **p < 0.01, ****p < 0.0001. c Serum samples of surviving mice were collected at 21 days post challenge, and the neutralizing antibody levels were tested by FAVN. d Serum neutralizing antibody titers monitoring within 9 months after two doses of GDIII-Ferritin nanoparticle vaccine (30 μg/dose) (n = 5). To evaluate the duration of antiviral protection of the GDIII-Ferritin nanoparticle vaccine. Source data are provided as a Source Data file.

Similar articles

Cited by

References

    1. Munro, H. N. & Linder, M. C. Ferritin: structure, biosynthesis, and role in iron metabolism. Physiol. Rev.58, 317–396 (1978). - PubMed
    1. Harrison, P. M. & Arosio, P. The ferritins: molecular properties, iron storage function and cellular regulation. Biochim. Biophys. Acta (BBA) Bioenerg.1275, 161–203 (1996). - PubMed
    1. Bhaskar, S. & Lim, S. Engineering protein nanocages as carriers for biomedical applications. NPG Asia Mater.9, e371 (2017). - PMC - PubMed
    1. Chattopadhyay, S., Chen, J. Y., Chen, H. W. & Hu, C. J. Nanoparticle vaccines adopting virus-like features for enhanced immune potentiation. Nanotheranostics1, 244–260 (2017). - PMC - PubMed
    1. Gomes, A. C., Mohsen, M. & Bachmann M. F. Harnessing nanoparticles for immunomodulation and vaccines. Vaccines5, 6 (2017). - PMC - PubMed

Publication types

MeSH terms