. 2024 Oct 4;15(1):8622.
doi: 10.1038/s41467-024-52875-5.

Plekhg5 controls the unconventional secretion of Sod1 by presynaptic secretory autophagy

Affiliations

Plekhg5 controls the unconventional secretion of Sod1 by presynaptic secretory autophagy

Amy-Jayne Hutchings et al. Nat Commun. .

Abstract

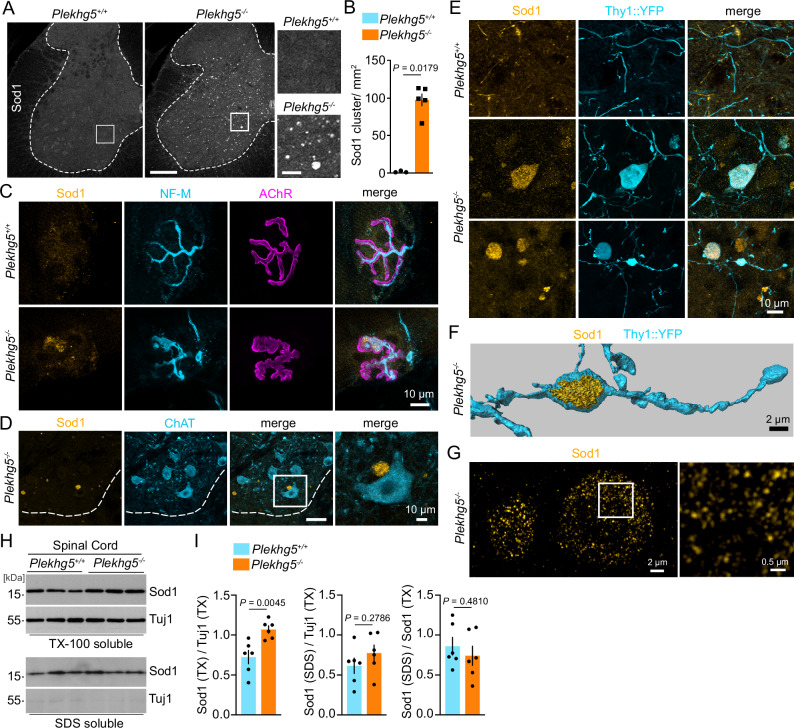
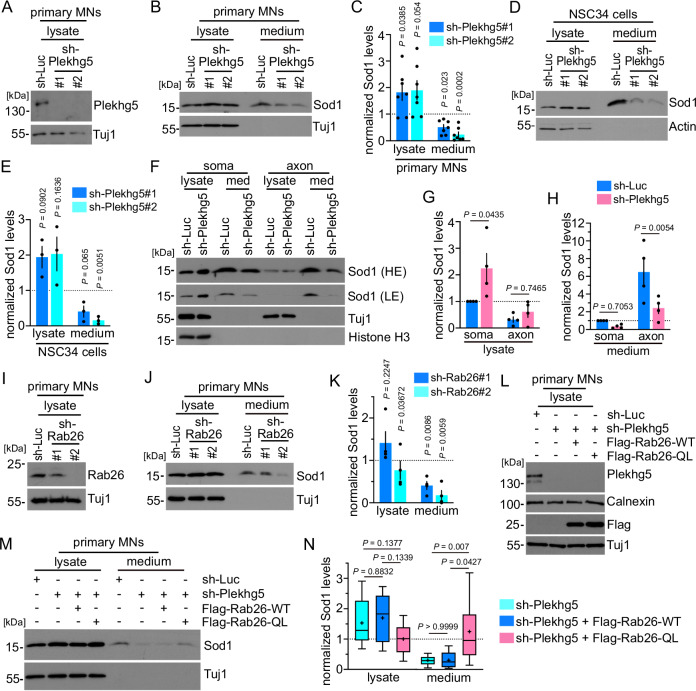
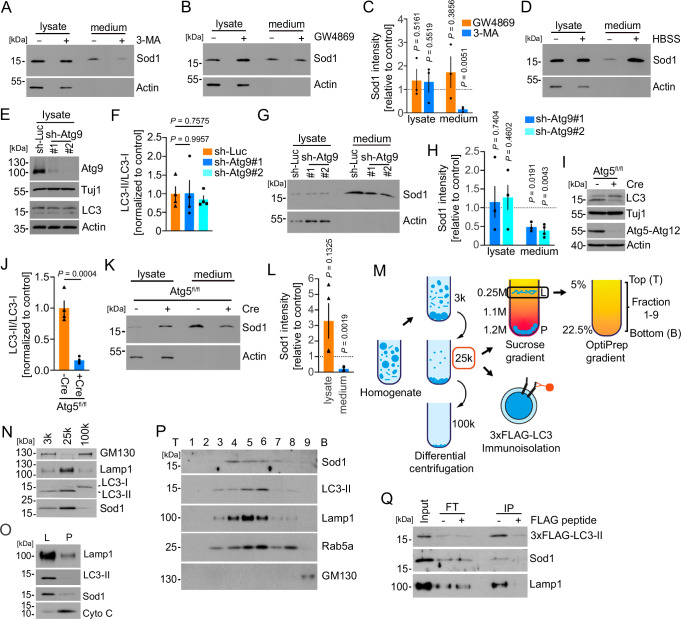
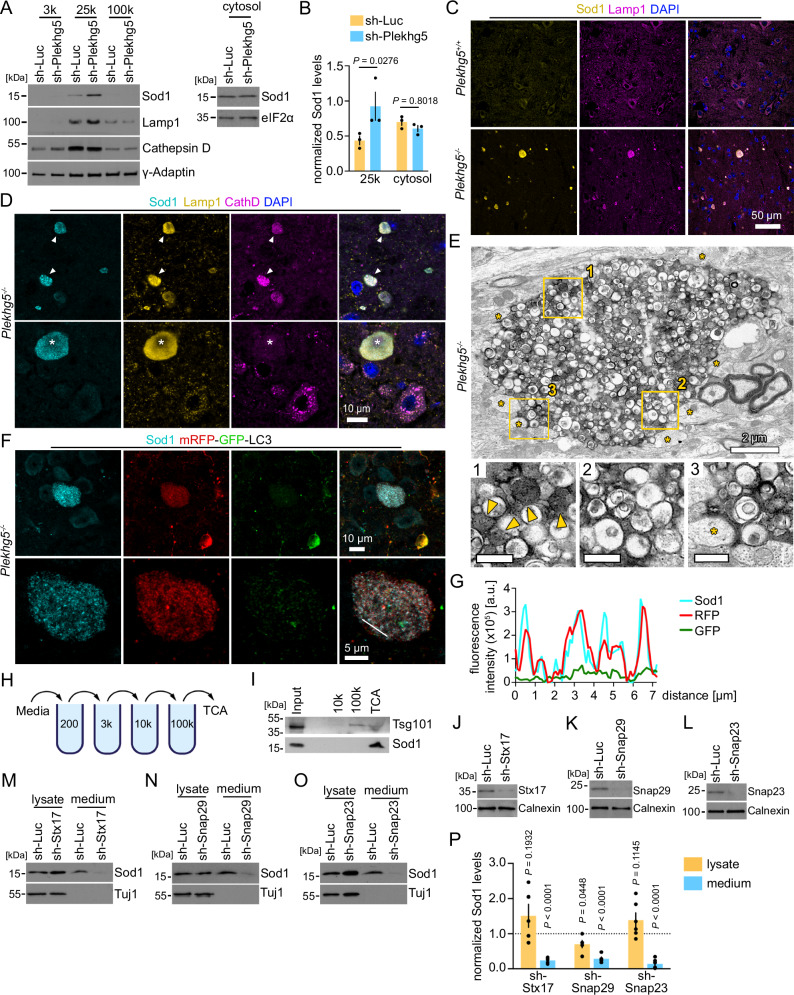
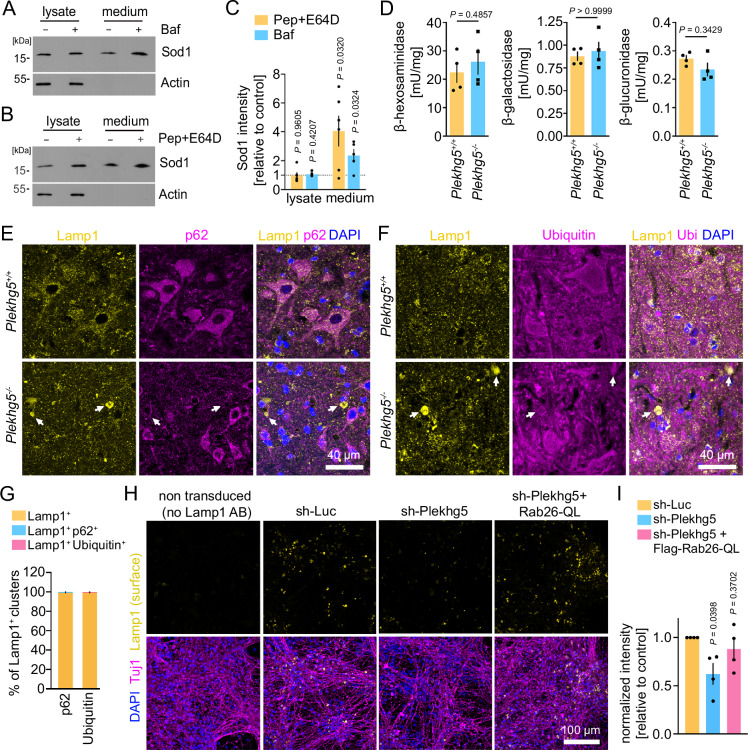
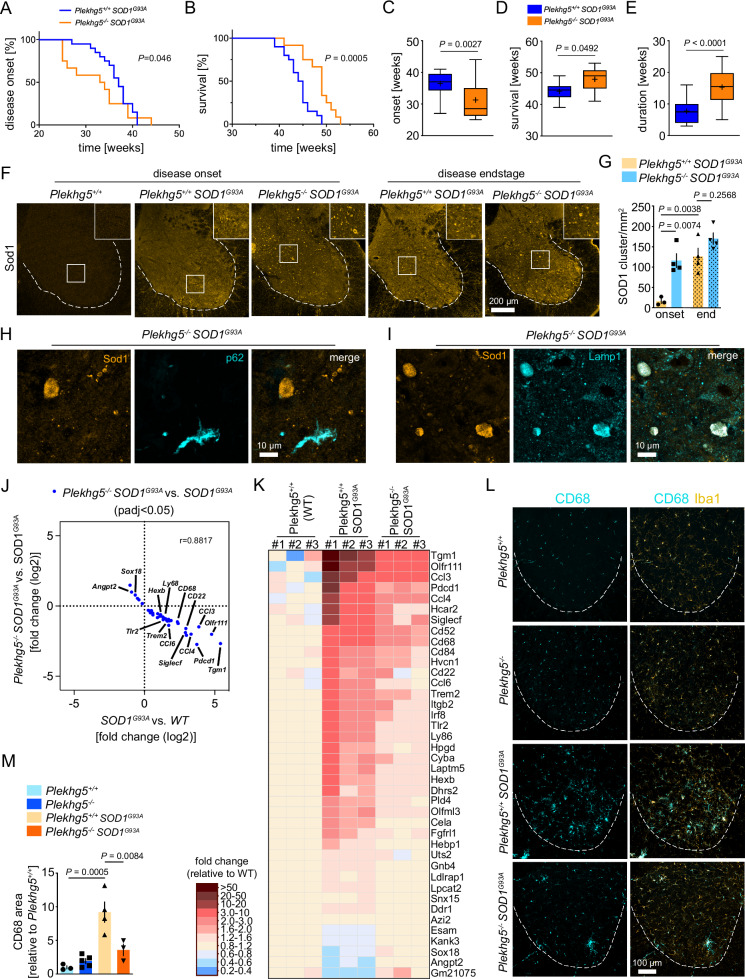
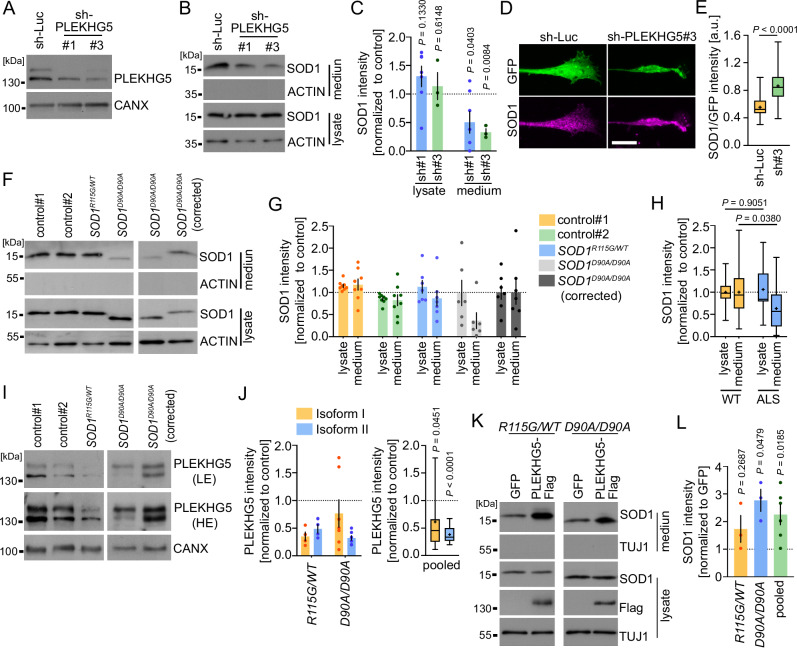
Increasing evidence suggests an essential function for autophagy in unconventional protein secretion (UPS). However, despite its relevance for the secretion of aggregate-prone proteins, the mechanisms of secretory autophagy in neurons have remained elusive. Here we show that the lower motoneuron disease-associated guanine exchange factor Plekhg5 drives the UPS of Sod1. Mechanistically, Sod1 is sequestered into autophagosomal carriers, which subsequently fuse with secretory lysosomal-related organelles (LROs). Exocytosis of LROs to release Sod1 into the extracellular milieu requires the activation of the small GTPase Rab26 by Plekhg5. Deletion of Plekhg5 in mice leads to the accumulation of Sod1 in LROs at swollen presynaptic sites. A reduced secretion of toxic ALS-linked SOD1G93A following deletion of Plekhg5 in SOD1G93A mice accelerated disease onset while prolonging survival due to an attenuated microglia activation. Using human iPSC-derived motoneurons we show that reduced levels of PLEKHG5 cause an impaired secretion of ALS-linked SOD1. Our findings highlight an unexpected pathophysiological mechanism that converges two motoneuron disease-associated proteins into a common pathway.


Conflict of interest statement

The authors declare no competing interests.

Figures

Fig. 1
Fig. 1. Plekhg5 regulates the secretion of Sod1.
A Representative images of spinal cord cross sections from Plekhg5+/+ and Plekhg5−/− mice stained for Sod1. Numerous accumulations of Sod1were present in spinal cord cross sections from Plekhg5−/− mice. Scale bar: 200 µm. Scale bar, inset: 40 µm. B Quantification of Sod1 accumulations in spinal cord cross sections. Plekhg5+/+ mice, n = 3; Plekhg5−/− mice, n = 5; biological replicates. 7 sections were analyzed per mouse. Mann-Whitney test, one-tailed. C NMJ within the gastrocnemius visualized by BTX and NF-M staining. Note the Sod1 accumulation at the axon terminal of Plekhg5−/− mice. The images are representative of at three biological replicates. D Spinal cord cross-section of Plekhg5−/− stained for Sod1 and ChAT showing a Sod1 accumulation close to the soma of a MN. The images are representative of two biological replicates. Scale bar: 40 µm. Scale bar, inset: 10 µm. E Spinal cord cross-sections of Plekhg5−/− Thy1::YFP mice stained for Sod1 and GFP reveal the localization of Sod1 accumulations in distal parts of axons. The images are representative of three biological replicates. F Imaris 3D reconstruction of the image shown in the lower panel of E. G SIM microscopy of Sod1 accumulations in the spinal cord of Plekhg5-deficient mice. At high resolution Sod1 accumulations appeared as clusters of individual Sod1+ structures. The images are representative of three biological replicates. H Accumulation of Triton-X-100 soluble Sod1 in spinal cords of Plekhg5−/− mice. Spinal cord homogenates were separated into Triton-X-100-soluble and SDS-soluble fractions and analyzed by Western blot. I Quantification of the Sod1 levels in the Triton-X-100-soluble and SDS-soluble fractions of Plekhg5−/− and Plekhg5+/+ mice. n = 6 biological replicates; t-Test, two-tailed. Data are mean ± SEM. Source data are provided as a source data file.
Fig. 2
Fig. 2. Plekhg5-mediates the unconventional secretion of Sod1 via Rab26.
A Western blots showing the knockdown of Plekhg5 in MNs (sh-RNA-1 = #1; sh-RNA-2 = #2). B Reduced Sod1 levels in the medium of Plekhg5-depleted MNs as shown by Western blot. C Quantifications of the Sod1 intensities upon knockdown of Plekhg5 in MNs. n = 7 biological replicates. One sample t-test, two-tailed. D Western blots showing reduced Sod1 levels in the medium of Plekhg5-depleted NSC34 cells. E Quantifications of the Sod1 intensities upon knockdown of Plekhg5 NSC34 cells. n = 3 biological replicates. One sample t-test, two-tailed. F Western blot showing the Sod1 levels in the somatodendritic and axonal compartments upon Plekhg5 knockdown. LE low exposure, HE high exposure. Quantifications of the Sod1 intensities in lysates (G) and media (H) of the somatodendritic and axonal compartments upon knockdown of Plekhg5 in MNs. n = 4 biological replicates. Two-Way ANOVA, Šídák’s multiple comparisons test. I Western blot showing the knockdown of Rab26 in MNs (sh-RNA-1 = #1; sh-RNA-2 = #2). J Western blots showing reduced Sod1 levels in the medium of Rab26-depleted MNs. K Quantifications of the Sod1 intensities upon knockdown of Rab26 in MNs. n = 4 biological replicates. One sample t-test, two-tailed. L Western blot of MN lysates showing the knockdown of Plekhg5 and simultaneous expression of Flag-Rab26-WT or Flag-Rab26-QL. M Expression of Flag-Rab26-QL restores the reduced Sod1 medium levels after Plekhg5 knockdown as shown by Western blot. N Quantifications of the Sod1 intensities upon knockdown of Plekhg5 and simultaneous expression of Flag-Rab26-WT or Flag-Rab26-QL in MNs. sh-Luc, n = 12; sh-Plekhg5-E, n = 12; sh-Plekhg5-E+Flag-Rab26-WT, n = 5, sh-Plekhg5-E+Flag-Rab26-QL, n = 12; biological replicates. One-way ANOVA; Tukey’s multiple comparisons test. Box bounds are defined by the 25th and 75th percentiles. Extending whiskers represent data points within 1.5 times the interquartile range from lower and upper quartiles. Lines and crosses denote the median and mean. Sod1 secretion was calculated as the ratio between the amount of Sod1 in the medium and in the lysate. Sod1 levels in the lysates were adjusted to Tuj1 (MNs) or Actin (NSC34 cells). The normalized Sod1 intensities were set to 1 in each experiment Data are mean ± SEM. Source data are provided as a Source Data file.
Fig. 3
Fig. 3. Sod1 is secreted in an autophagy-dependent manner.
Western blots of lysates and media from NSC34 cells treated with 3-MA (A), and GW4869 (B) for 8 h. C Quantification of the Sod1 intensities upon exposure to 3-MA or GW4869. n = 3; biological replicates. One-Sample t-test, two-tailed. D Western blot of the lysate and medium from NSC34 cells treated for 1 h with HBSS. The images are representative of four biological replicates. E Western blot showing similar LC3-II/ LC3-I ratios upon knockdown of Atg9 in MNs (sh-RNA-1= #1; sh-RNA-2 = #2). F Quantification of the LC3-II/LC3-I ratios normalized to the control. n = 4 biological replicates. Repeated measures one-way ANOVA. Dunnett’s multiple comparisons test. G Western blots showing reduced Sod1 levels in the medium of MNs upon knockdown of Atg9 in MNs. H Quantification of the Sod1 intensities. Lysate n = 4, medium n = 3 (sh-Atg9#1); Lysate n = 4, medium n = 4 (sh-Atg9#2); biological replicates. One-sample t-test, two-tailed. I Western blot showing a reduced LC3-II/LC3-I ratio in Atg5 depleted MNs. J Quantification of the LC3-II/LC3-I ratios normalized to the control. n = 4 biological replicates. t-test, two-tailed. K Depletion of Atg5 in MNs results in a reduced secretion of Sod1 as shown by Western blot. L Quantification of the Sod1 intensities. n = 4 biological replicates. unpaired t-test, two-tailed. M Membrane fractionation scheme. NP Western blots showing the distribution of Sod1 and the indicated membrane markers in the different membrane fractions. T, top; B, bottom. The images are representative of two biological replicates. Q LC3-positive membranes were immunoisolated and the presence of Sod1 was determined by Western blot. FT flowthrough, IP immunoprecipitation. The images are representative of two biological replicates. Quantification of Sod1 secretion was calculated as the ratio between the amount of Sod1 in the medium and in the lysate. Sod1 levels in lysates were adjusted to Actin. The normalized Sod1 intensities were set to 1 in each experiment Data are mean ± SEM. Source data are provided as a Source Data file.
Fig. 4
Fig. 4. Sod1 accumulates in autolysosomal structures within the spinal cord of Plekhg5-deficient mice.
A Western blots showing an enrichment of Sod1 in the 25k membrane fraction upon Plekhg5 knockdown in NSC34 cells. B Quantification of the Sod1 intensities. The Sod1 intensity of the 25k pellet was normalized to γ-Adaptin, the cytosolic fraction was normalized to eIF2α. n = 3 biological replicates. Two-way ANOVA; Sidak’s multiple comparison test. C Sod1 accumulations in Plekhg5−/− mice stained positive for the endosomal/lysosomal marker Lamp1. Co-staining of spinal cord cross sections for Sod1, Lamp1, and DAPI. The images are representative of three biological replicates. D A subset of Sod1+Lamp1+ vesicle clusters showed immunoreactivity for the lysosomal marker CathepsinD. Arrowheads point to CathepsinD+ vesicle clusters. The asterisk labels a CathepsinD- vesicle cluster. The images are representative of three biological replicates. E Electron microscopic micrograph of a vesicle cluster in the spinal cord of Plekhg5−/− mice. Postsynaptic spines adjacent to the vesicle cluster are labeled by asterisks. Electron-dense organelles are highlighted by arrowheads. The images are representative of two biological replicates. F Co-staining of Sod1 and mRFP-GFP-LC3 in spinal cord cross-sections from Plekhg5−/− CAG:::mRFP-GFP-LC3 mice. The images are representative of three biological replicates. G Line scan of the vesicles shown in the lower panel of F. H Scheme for differential centrifugations of extracellular vesicles. I Enrichment of Sod1 in the TCA fraction of medium from NSC34 cells as shown by Western blot. The images are representative of two biological replicates. Western blots showing the knockdown of Stx17 (J), Snap29 (K), and Snap23 (L) upon simultaneous expression of two sh-RNAs in MNs. The images are representative of three biological replicates. Western blots show that the Sod1 secretion is blocked upon knockdown of Stx17 (M), Snap29 (N), and Snap23 (O). P Quantification of the Sod1 intensities. sh-Stx17, n = 4; sh-Snap29, n = 6; sh-Snap23, n = 6, biological replicates. One-sample t-test, two-tailed. Quantification of Sod1 secretion was calculated as the ratio between the amount of Sod1 in the medium and in the lysate. Sod1 levels in the lysates were adjusted to Tuj1. The normalized Sod1 intensities were set to 1 in each experiment. Data are mean ± SEM. Source data are provided as a Source Data file.
Fig. 5
Fig. 5. Sod1 accumulates in Plekhg5-deficient mice due to impaired secretion of lysosomal-related organelles, but not due to lysosomal dysfunction.
Elevated Sod1 levels in the medium upon lysosomal dysfunction. Western blots of lysates and media from NSC34 cells treated with Bafilomycin A1 (Baf) (A) or Pepstatin A and E64D (B) for 8 h. C Quantification of the Sod1 intensities. Pep+E64D, n = 6; Baf, n = 5; biological replicates. One-Sample t-test, two-tailed. Quantification of Sod1 secretion was calculated as the ratio between the amount of Sod1 in the medium and in the lysate Sod1 levels in the lysates were adjusted to Actin. The normalized Sod1 intensities were set to 1 in each experiment. D Quantification of the activity of the lysosomal enzymes ß-hexosaminidase, ß-galactosidase, and ß-glucuronidase in spinal cord lysates reveals no difference between Plekhg5+/+ and Plekhg5−/− mice. n = 4 biological replicates. Mann–Whitney test, two-tailed. Lamp1 accumulations in Plekhg5−/− mice stained negative for p62 (E) and Ubiquitin (F). Co-staining of spinal cord cross sections from Plekhg5−/− and Plekhg5+/+ mice labeled for Lamp1, p62 and DAPI (E) and Lamp1, Ubiquitin and DAPI (F). Arrows point to Lamp1+ vesicle clusters. G Quantification of the overlap between the immunoreactivity of the Lamp1+ accumulations with p62 or Ubiquitin. Five spinal cord cross sections of three animals were analyzed. n = 3 biological replicate. H Expression of Flag-Rab26-QL restored the reduced Lamp1 surface levels in MNs upon depletion of Plekhg5. I Quantification of the Lamp1 intensity normalized to the number of nuclei. Each dot represents the mean of at least 5 images quantified. n = 4 biological replicate. One sample t-test, two-tailed. Data are mean ± SEM. Source data are provided as a Source Data file.
Fig. 6
Fig. 6. Depletion of Plekhg5 in SOD1G93A mice prepones the disease onset but extends the survival.
Kaplan–Meier plots showing the onset of weight loss (A) and survival (B) of Plekhg5−/− Sod1G93A mice compared to Plekhg5+/+ Sod1G93A. Log-rank (Mantel Cox) test. Average disease onset (C), survival (D), and duration (E). A, C Plekhg5+/+ Sod1G93A, n = 20. Plekhg5−/− Sod1G93A, n = 16. B, D, E Plekhg5+/+ Sod1G93A, n = 20. Plekhg5−/− Sod1G93A, n = 12; biological replicates. Two-tailed t-test. Box bounds are defined by min to max. Whiskers represent data points within 1.5 IQR. Lines and crosses denote the median and mean. F Sod1 staining of spinal cord cross sections revealed an accelerated accumulation of Sod1 in Sod1G93A mice upon depletion of Plekhg5. G Quantification of Sod1 accumulations. Onset: Plekhg5+/+ Sod1G93A, n = 3; Plekhg5−/− Sod1G93A, n = 4; biological replicates. Endstage: Plekhg5+/+ Sod1G93A, n = 4; Plekhg5−/− Sod1G93A, n = 4; biological replicates. One-way ANOVA; Tukey’s Multiple Comparisons. Sod1 accumulations in Plekhg5 −/− Sod1G93A mice stain negative for p62 (H) but positive for Lamp1 (I). The images are representative of three biological replicates. J Scatterplot showing the magnitude of change (fold change, log2) of the transcripts significantly altered in SOD1G93A vs. wildtype (WT) mice and significantly altered in SOD1G93A mice vs. Plekhg5−/− SOD1G93A. n = 3 biological replicates. Pearson correlation, r = −0.9390. K Heat Map showing the relative expression levels of transcripts significantly altered in SOD1G93A vs. Plekhg5+/+ (WT) mice and significantly altered in SOD1G93A mice vs. Plekhg5−/−SOD1G93A. The expression levels are shown as fold change of the normalized read counts adjusted to the mean levels of Plekhg5+/+ (WT) mice. L Staining for Iba1 and CD68 in spinal cord cross-sections revealed a reduced microglial neuroinflammation in Plekhg5−/− Sod1G93A mice. M Quantification of the CD68 immunoreactivity area. Plekhg5+/+, n = 3; Plekhg5−/−, n = 5; Plekhg5+/+ Sod1G93A, n = 4; Plekhg5−/− Sod1G93A, n = 3; biological replicates. One-way ANOVA; Tukey’s Multiple Comparisons. Data are mean ± SEM. Source data are provided as a Source Data file.
Fig. 7
Fig. 7. PLEKHG5 drives the secretion of mutant ALS-linked SOD1 in human iPSC-derived MNs.
A Western blot showing the knockdown of PLEKHG5 in hiPSC-derived MNs (sh-RNA-1 = #1; sh-RNA-3 = #3). The images are representative of two biological replicates. B Western blot showing reduced SOD1 levels in the medium of PLEKHG5-depleted MNs. C Western blot quantification of the SOD1 intensities. One sample t-test, two-tailed. sh#1, n = 6; sh#3 n = 3; biological replicates. D Immunoreactivity of SOD1 in axon terminals of control or PLEKH5-depleted hiPSC-derived MNs. Scale bar: 10 µm. E Quantification of the SOD1 intensity normalized to GFP. sh-Luc, n = 48; sh-PLEKHG5, n = 52. Three biological replicates. Two-tailed test, unpaired. F Western blots showing reduced SOD1 levels in the medium of iPSC-derived MNs with mutant ALS-linked SOD1. G, H Western blot quantification of the SOD1 intensity. G Individual data: control#1, n = 8; control#2, n = 8; SOD1R115G/WT, n = 7; SOD1D90A/D90A, n = 6; SOD1D90A/D90A (corrected); biological replicates. H Pooled data: WT, n = 23; ALS, n = 13; biological replicates. Two-way ANOVA, Sidak’s multiple comparison test. I Western blots showing reduced PLEKHG5 levels in the lysates of SOD1D90A/D90A and SOD1R115G/WT MNs. J Western blot quantification of the PLEKHG5 intensity relative to CANX. SOD1R115G/WT, n = 4; SOD1D90A/D90A, n = 7. Pooled, n = 11; biological replicates. One sample t-test, two-tailed. LE low exposure, HE high exposure. K Expression of Flag-Plekhg5 (Isoform 1) caused an increase in the media of mutant ALS-linked SOD1 as shown by Western blot. L Western blot quantification of the SOD1intensities. SOD1R115G/WT, n = 3; SOD1D90A/D90A, n = 3; Pooled, n = 6; biological replicates. One sample t-test, two-tailed. Quantification of SOD1 secretion was calculated as the ratio between the amount of SOD1 in the medium and in the lysate. The SOD1 levels in the lysates were adjusted to CANX. The SOD1 or PLEKHG5 levels of SOD1R115G/WT MNs were normalized to the mean value of both controls. The intensities of SOD1D90A/D90A MNs were normalized to their corrected counterpart. The normalized SOD1 intensities were set to 1 in each experiment. Data are mean ± SEM. Box bounds are defined by min to max. Whiskers represent data points within 1.5 IQR. Lines and crosses denote the median and mean. Source data are provided as a Source Data file.

References

    1. Komatsu, M. et al. Loss of autophagy in the central nervous system causes neurodegeneration in mice. Nature441, 880–884 (2006). - DOI - PubMed
    1. Hara, T. et al. Suppression of basal autophagy in neural cells causes neurodegenerative disease in mice. Nature441, 885–889 (2006). - DOI - PubMed
    1. Luningschror, P. & Sendtner, M. Autophagy in the presynaptic compartment. Curr. Opin. Neurobiol.51, 80–85 (2018). - DOI - PubMed
    1. Vijayan, V. & Verstreken, P. Autophagy in the presynaptic compartment in health and disease. J. Cell Biol.216, 1895–1906 (2017). - DOI - PMC - PubMed
    1. Hill, S. E. & Colon-Ramos, D. A. The Journey of the Synaptic Autophagosome: A Cell Biological Perspective. Neuron105, 961–973 (2020). - DOI - PubMed

Publication types

MeSH terms

Associated data