. 2024 Oct 4;15(1):8623.
doi: 10.1038/s41467-024-52829-x.

Postnatal supplementation with alarmins S100a8/a9 ameliorates malnutrition-induced neonate enteropathy in mice

Affiliations

Postnatal supplementation with alarmins S100a8/a9 ameliorates malnutrition-induced neonate enteropathy in mice

Lisa Perruzza et al. Nat Commun. .

Abstract

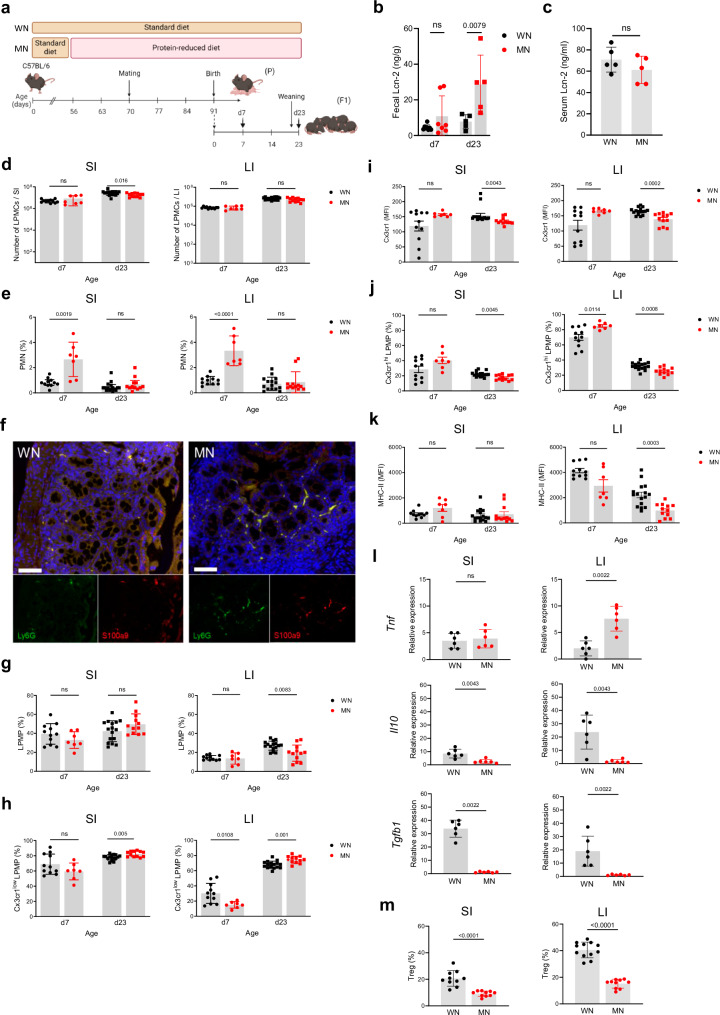
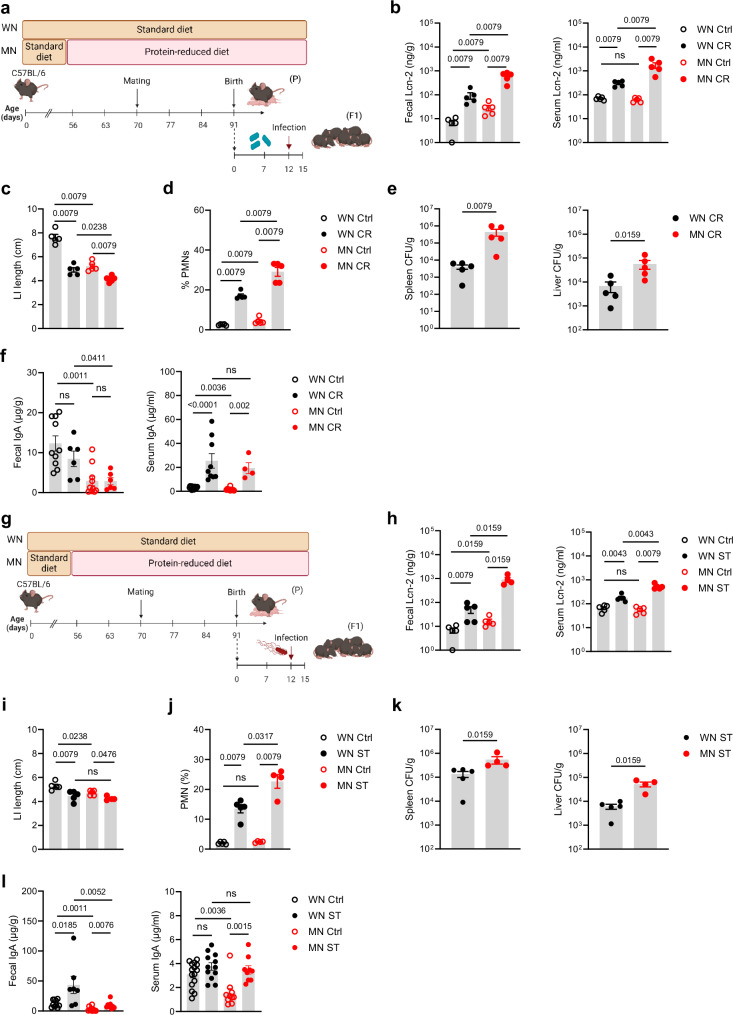
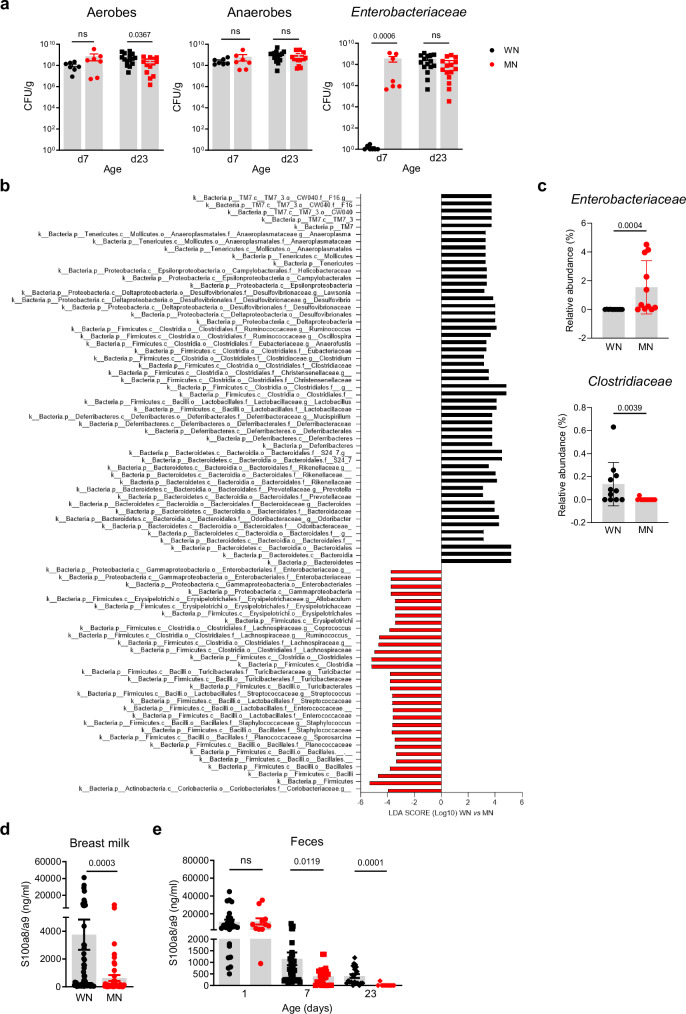
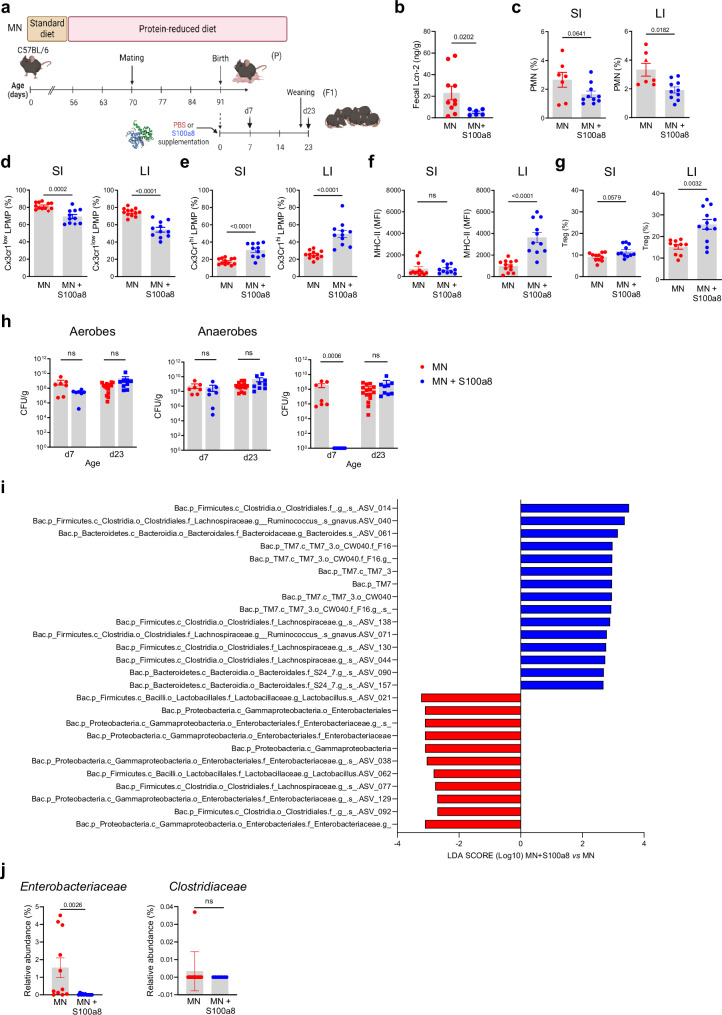
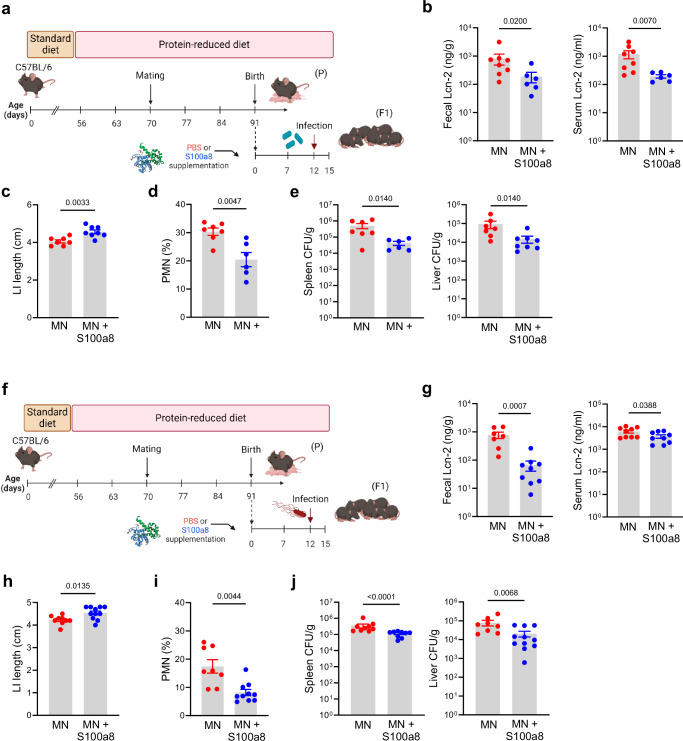
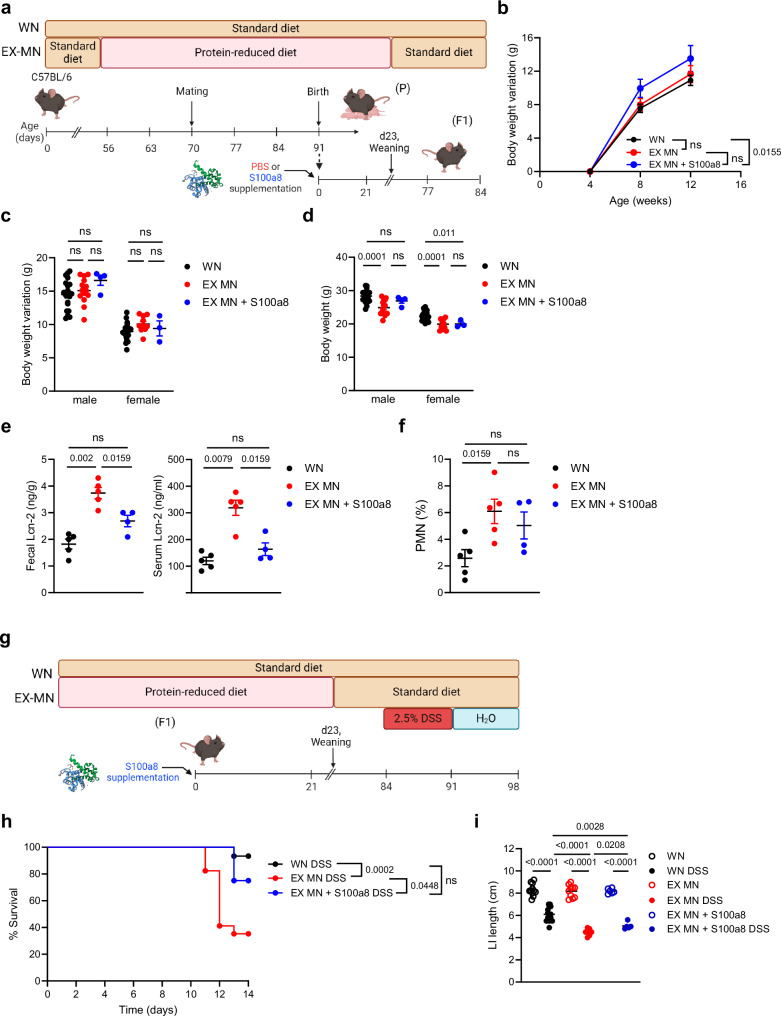
Malnutrition is linked to 45% of global childhood mortality, however, the impact of maternal malnutrition on the child's health remains elusive. Previous studies suggested that maternal malnutrition does not affect breast milk composition. Yet, malnourished children often develop a so-called environmental enteropathy, assumed to be triggered by frequent pathogen uptake and unfavorable gut colonization. Here, we show in a murine model that maternal malnutrition induces a persistent inflammatory gut dysfunction in the offspring that establishes during nursing and does not recover after weaning onto standard diet. Early intestinal influx of neutrophils, impaired postnatal development of gut-regulatory functions, and expansion of Enterobacteriaceae were hallmarks of this enteropathy. This gut phenotype resembled those developing under deficient S100a8/a9-supply via breast milk, which is a known key factor for the postnatal development of gut homeostasis. We could confirm that S100a8/a9 is lacking in the breast milk of malnourished mothers and the offspring's intestine. Nutritional supply of S100a8 to neonates of malnourished mothers abrogated the aberrant development of gut mucosal immunity and microbiota colonization and protected them lifelong against severe enteric infections and non-infectious bowel diseases. S100a8 supplementation after birth might be a promising measure to counteract deleterious imprinting of gut immunity by maternal malnutrition.


Conflict of interest statement

F.G. is the founder of MV BioTherapeutics, a company developing mucosal vaccines and biotherapeutics. All remaining authors declare no conflicts of interest.

Figures

Fig. 1
Fig. 1. The offspring of MN mothers develops an inflammatory gut mucosal phenotype lacking regulatory functions.
a Experimental setup. b, c Lcn-2 levels in fecal samples collected at d7 and d23(WN d7: n = 8, MN d7: n = 7; d23: n = 5 per group) (b) and serum samples collected at d23 after birth (n = 5 per group) (c) from the WN and MN offspring. d Number of LPMCs isolated from the SI and LI of WN and MN mice at d7 (WN: n = 11, MN: n = 7) and d23 (WN: n = 16, MN: n = 12). ek Flow cytometric analysis of myeloid cells isolated from the SI and LI of WN and MN mice at d7 (WN: n = 11, MN: n = 7) and d23 (WN: n = 11, MN: n = 7). e, g Proportions of polymorphonuclear neutrophils (PMNs) (e) and lamina propria macrophages (LPMPs) (g) from LPMCs. f Representative images of LI tissue samples from d7 WN mice (left) and d7 MN mice (right) immunostained for Ly6G (green), S100a9 (red) and nuclei (DAPI; blue). Lower panels, single color stainings of Ly6G and S100a9 respectively. Scale bars, 50 µm. h Proportion of Cx3cr1low LPMPs from LPMPs. i Expression of Cx3cr1 on Cx3cr1low LPMPs plotted as mean fluorescence intensity (MFI). j Proportion of Cx3cr1hi LPMPs from LPMPs. k Expression of MHC-II on Cx3cr1hi LPMPs plotted MFI. l Expression of indicated genes in LPMCs isolated from the SI and LI at d23 (n = 6 mice each group). m Proportion of Tregs from LMPCs isolated from the SI and LI at d23 (SI: n = 10 mice each group; LI: WN: n = 6 mice, MN: n = 8 mice). Bars represent means ± SEM. Exact p-values are displayed, ns, not significant (two-tailed MWU-tests). Panel a was created in BioRender under license number BioRender.com/c00z263.
Fig. 2
Fig. 2. The early-life enteropathy established under maternal malnutrition aggravates subsequent enteric infections.
a Experimental setup of the C. rodentium infection model. bf The offsprings of the MN and WN group were infected at d12 after birth with C. rodentium (CR) or treated with PBS (control, Ctrl). Biosamples were harvested 10 days post infection (p.i.). g Experimental setup of the S. typhimurium infection model. hl The offsprings of the MN and WN group were infected at d12 after birth with S. typhimurium (ST) or treated with PBS (Ctrl). Biosamples were harvested 3 days p.i. b, h Fecal and serum Lcn-2 levels, respectively (n = 5 each group). c, i LI length (n = 5 each group). d, j Proportions of PMNs from LI LMPCs (n = 5 each group). e, k Bacterial load in spleens and livers of infected mice plotted as colony-forming units (CFU) per organ weight (n = 5 each group). f, l Fecal (Ctrl groups: n = 10, infected groups MN: n = 6-9) and serum total IgA levels (Ctrl WN: n = 15, Ctrl MN: n = 10; infected groups: WN: n = 9, MN: n = 4 (CR) or n = 9 (ST)), respectively. Plots represent means ± SEM. Exact p-values are displayed, ns, not significant (two-tailed MWU-tests). Panel a and g were created in BioRender under license number BioRender.com/z09x085.
Fig. 3
Fig. 3. Development of gut dysbiosis and S100a8/a9 deficiency under maternal malnutrition.
a Abundance of total bacteria cultivated under aerobic and anaerobic conditions and of Enterobacteriaceae in fecal samples (LI plus cecum contents) collected from the offspring of WN and MN dams at indicated time points (d7: n = 7 each group, d23: n = 15 each group). Bars represent means ± SEM. Exact p-values are displayed, ns, not significant (two-tailed MWU-tests). CFU, colony-forming units. b Linear discriminant analysis (LDA) effect size (LEfSe) in the WN versus MN group (each n = 11) on relative abundances of gut microbiota in cecum contents collected at d23. Plotted are LDA scores for discriminative features >3.6 at phylum, class, family and genus levels. c Relative abundance of Enterobacteriaceae and Clostridiaceae in d23 cecum contents of the WN and MN offspring (n = 11 each group). d S100a8/a9 levels in breast milk of WN and MN dams collected during d1-d7 after delivery (WN: n = 63, MN: n = 49). e S100a8/a9 levels in the offspring’s feces at d1 (WN: n = 26, MN: n = 11), d7 (WN: n = 43, MN: n = 13) and d23 (WN: n = 21, MN: n = 12). Bars represent means ± SEM. Exact p-values are displayed, ns, not significant (two-tailed MWU-tests).
Fig. 4
Fig. 4. Nutritional S100a8 supply after birth promotes healthy development of intestinal immunity and gut microbiome under maternal malnutrition.
a Experimental setup. Pups of MN dams were fed 5 µg of S100a8 within 24 h after birth (S100a8) or control treated with PBS (Ctrl). b Lcn-2 levels in fecal samples at d23 (MN: n = 10 mice, MN+S100a8: n = 6 mice). cg Flow cytometric analysis of LPMCs isolated from the SI and LI at d7 (MN: n = 7, MN+S100a8: n = 10) and d23 (MN: n = 12, MN+S100a8: n = 11). ce Proportions of PMNs at d7 from LPMCs (c) and Cx3cr1low LPMPs (d) and Cx3cr1hi LPMPs (e) at d23 from LPMPs. f Expression of MHC-II on Cx3cr1hi LPMPs (MFI). g Proportions of Tregs from LPMCs at d23. h Abundance of total bacteria cultivated under aerobic and anaerobic conditions and of Enterobacteriaceae in fecal samples (LI plus cecum contents) collected at indicated time points from S100a8-treated and PBS-treated MN mice (d7: n = 7 each group, d23: MN: n = 15, MN+S100a8: n = 9). CFU, colony forming units. i LDA scores for relative bacterial abundances in d23 cecum contents with discriminative features >3.6 at phylum, class, family and genus levels between S100a8-supplemented versus not supplemented MN mice (n = 7-11 each group). j Relative abundance of Enterobacteriaceae and Clostridiaceae in d23 cecum content (n = 11 mice per group). Bars represent means ± SEM. Exact p-values are displayed, ns, not significant (two-tailed MWU-tests). Panel (a) was created in BioRender under license number BioRender.com/p20q301.
Fig. 5
Fig. 5. S100a8 supplementation after birth lowers the risk of severe early-life enteric infections under malnutrition conditions.
a Experimental setup of the C. rodentium infection model with S100a8 supplementation. be Neonatally S100a8-treated and untreated mice from MN dams were infected at d12 with C. rodentium (CR) or treated with PBS (Ctrl). Biosamples were harvested 10 days p.i. (MN: n = 8, MN+S100a8: n = 6-8). f Experimental setup of the S. typhimurium infection model with S100a8 supplementation. gj Neonatally S100a8- treated and untreated mice from MN dams were infected with S. typhimurium at d12 (ST) or treated with PBS (Ctrl). Biosamples were harvested 3 days p.i. (MN: n = 8, MN+S100a8: n = 11). b, g Fecal and serum Lcn-2-levels, respectively. c, h LI length. d, i Proportions of PMNs from LI LMPCs. e, j Bacterial load in spleens and livers of infected mice plotted as CFU per organ weight. Plots represent means ± SEM. Exact p-values are displayed, ns, not significant (two-tailed MWU-tests). Panel a and f were created in BioRender under license number BioRender.com/i12p840.
Fig. 6
Fig. 6. Lifelong colitis susceptibility is a sequela of maternal malnutrition and preventable by supplementing S100a8 after birth.
a Experimental setup of the follow-up of the group of WN mice, not supplemented former MN mice (EX-MN) and postnatally S100a8-supplemented former MN mice (EX-MN + S100a8). bf WN mice, EX-MN and EX-MN + S100a8 were all weaned onto standard diet and monitored till the age of 84 days. b Body weight variations over time from 4 weeks until d84 (WN: n = 29, EX-MN: n = 11 and EX-MN+S100a8: n = 7). c, d Body weight variations from 4 weeks until d84 (c) and absolute body weight at d84 (d), respectively separated by gender (WN male: n = 20, WN female: n = 24, EX-MN male: n = 14, EX-MN female: n = 10, EX-MN+S100a8 male: n = 4 and EX-MN+S100a8 female: n = 3). e Lcn-2 levels in feces and serum at d84 (WN: n = 5, EX-MN: n = 5, EX-MN+S100a8: n = 4). f Proportions of PMNs from LI LPMCs (WN: n = 5, EX-MN: n = 5, EX-MN+S100a8: n = 4). Plots represent means ± SEM. Exact p-values are displayed, ns, not significant (one-way ANOVA, post hoc Tukey’s multiple comparison test). g Experimental setup in the DSS-induced colitis model. hi Colitis was induced in all experimental groups at d84 by daily enteral treatment with 2.5% DSS for 7 days. Control animals were treated with PBS. Subsequently, all mice were enterally treated with water until d98. h Survival of colitis until 14 days after start of DSS treatment (WN: n = 15, EX-MN: n = 17, EX-MN+S100a8: n = 8). Exact p-values are displayed, ns, not significant (Mantel-Cox test). i LI length at d98 (WN Ctrl: n = 11, WN DSS: n = 14; EX-MN: n = 10, EX-MN DSS: n = 13, both EX-MN+S100a8 groups: n = 6). Plots represent means ± SEM. Exact p-values are displayed, ns, not significant (one-way ANOVA, post hoc Tukey’s multiple comparison test). Panel (a and g) created in BioRender under license number BioRender.com/c14y754.

Similar articles

References

    1. WHO. Fact sheets - Malnutrition. https://www.who.int/news-room/fact-sheets/detail/malnutrition (2021).
    1. Black, R. E. et al. Maternal and child undernutrition: global and regional exposures and health consequences. Lancet371, 243–260 (2008). - PubMed
    1. UNICEF/WHO/WB The UNICEF/WHO/WB Joint Child Malnutrition Estimates (JME) group released new data for 2021. https://www.who.int/news/item/06-05-2021-the-unicef-who-wb-joint-child-m... (2021).
    1. UNICEF. As the war in Ukraine continues, millions of children In the Middle East and North Africa at increased risk of malnutrition amid food price hikes.https://www.unicef.org/press-releases/war-ukraine-continues-millions-chi... (2022).
    1. Guerrant, R. L., Oriá, R. B., Moore, S. R., Oriá, M. O. B. & Lima, A. A. M. Malnutrition as an enteric infectious disease with long-term effects on child development. Nut. Rev.66, 487–505 (2008). - PMC - PubMed

Publication types

MeSH terms