. 2024 Oct 4;15(1):8593.
doi: 10.1038/s41467-024-52637-3.

The double-edged role of FASII regulator FabT in Streptococcus pyogenes infection

Affiliations

The double-edged role of FASII regulator FabT in Streptococcus pyogenes infection

Clara Lambert et al. Nat Commun. .

Abstract

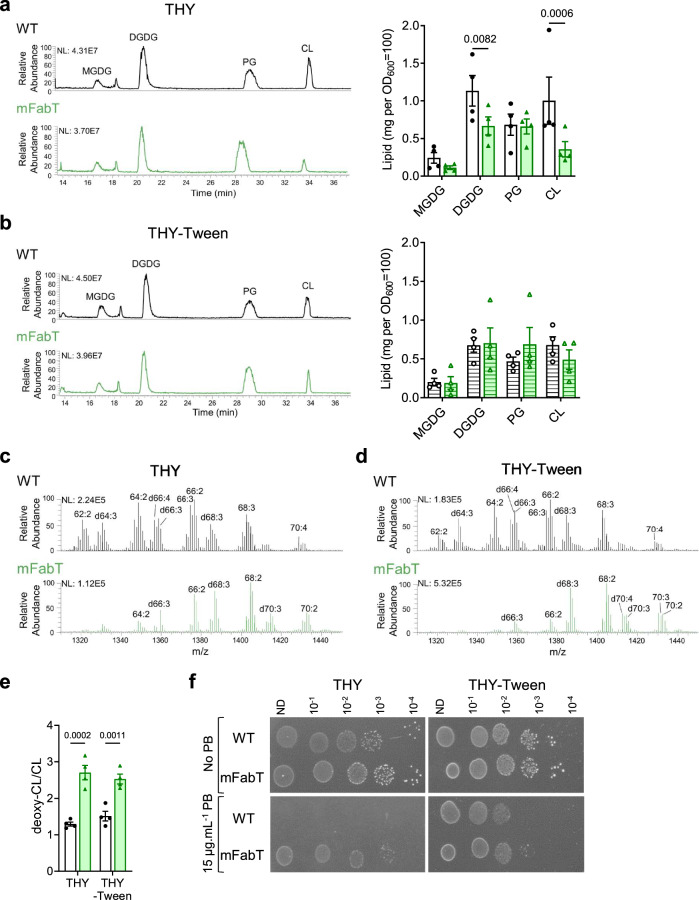
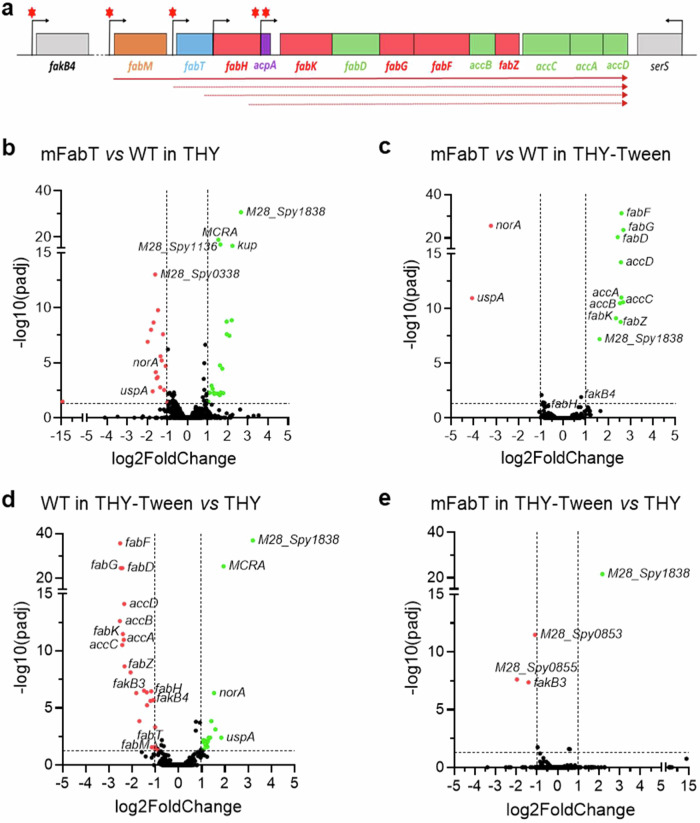
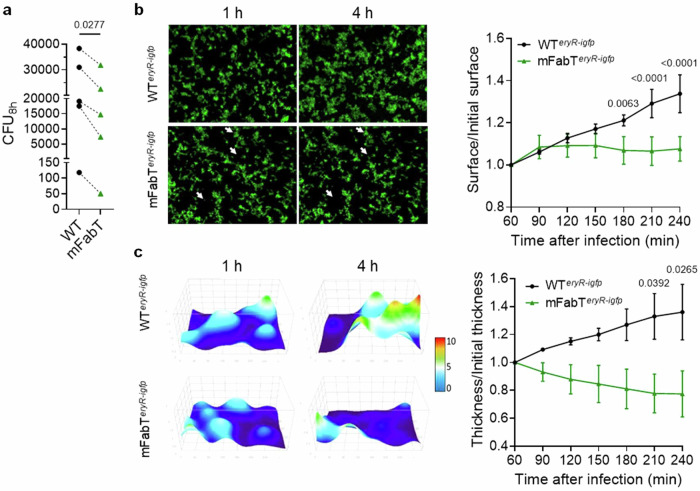
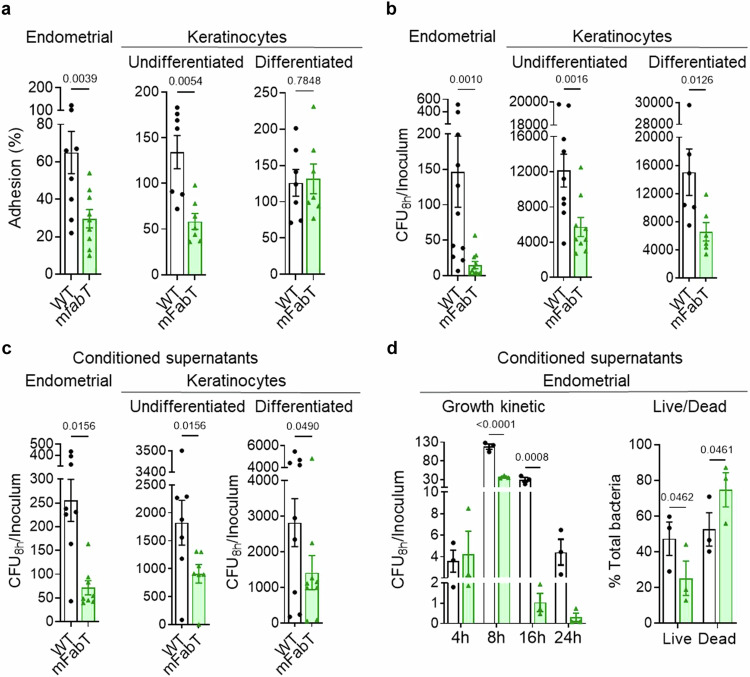
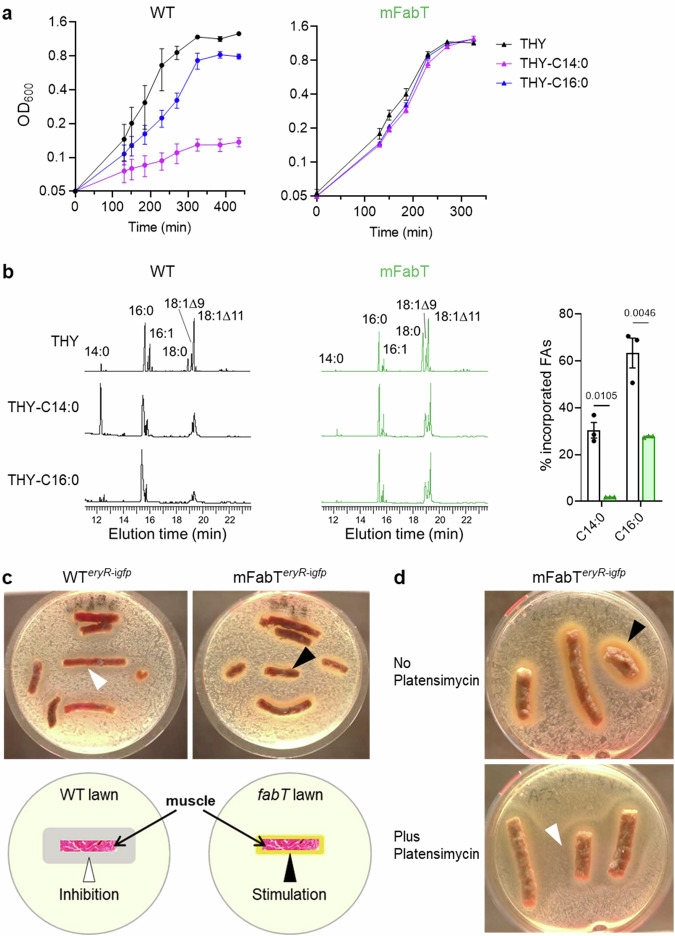
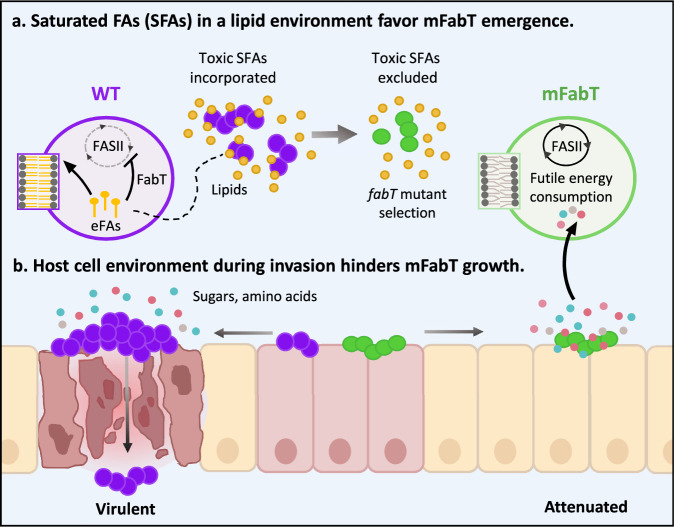
In Streptococcus pyogenes, the type II fatty acid (FA) synthesis pathway FASII is feedback-controlled by the FabT repressor bound to an acyl-Acyl carrier protein. Although FabT defects confer reduced virulence in animal models, spontaneous fabT mutants arise in vivo. We resolved this paradox by characterizing the conditions and mechanisms requiring FabT activity, and those promoting fabT mutant emergence. The fabT defect leads to energy dissipation, limiting mutant growth on human tissue products, which explains the FabT requirement during infection. Conversely, emerging fabT mutants show superior growth in biotopes rich in saturated FAs, where continued FASII activity limits their incorporation. We propose that membrane alterations and continued FASII synthesis are the primary causes for increased fabT mutant mortality in nutrient-limited biotopes, by failing to stop metabolic consumption. Our findings elucidate the rationale for emerging fabT mutants that improve bacterial survival in lipid-rich biotopes, but lead to a genetic impasse for infection.


Conflict of interest statement

The authors declare no competing interests.

Figures

Fig. 1
Fig. 1. FA differences in WT and mFabT strains impact lipid content and composition.
a, b HPLC-MS profiles represent the main lipid classes in WT and mFabT grown in indicated media to OD600 = 0.5; lipid profiles and quantifications by class. Lipid concentrations correspond to milligrams extracted from OD600 = 100 equivalents. MGDG, monoglucosyldiacylglycerol; DGDG, diglucosyldiacylglycerol; PG, phosphatidylglycerol; CL, cardiolipin (Supplementary Table 3). c, d, e CL species in WT and mFabT, showing putative deoxidized cardiolipin species (deoxy-CL, designated by a ‘d’ preceding acyl chain features; see Supplementary Table 2); a, b, N = 4, c, d, N = 3, where N corresponds to the number of extractions from independent samples used to identify the lipid species. e Represents proportions of CL and putative deoxy CL in WT and mFabT, as presented in (c, d). a, b, e 2-way ANOVA, Bonferroni post-test. a, b, e Data are presented as mean values +/- SEM. ad NL, normalization level. Significant p-values are shown. WT, white bars; mFabT, green bars. Hatched bars indicate that culture medium contained Tween 80. f Polymyxin B sensitivity. WT and mFabT were precultured to OD600 = 0.5 in THY or THY-Tween and dilutions were spotted on the same respective solid medium supplemented or not with polymyxin B (PB). Plates are representative of 3 independent experiments. Source data for a, b, and e, are provided as a Source Data file.
Fig. 2
Fig. 2. FabT regulon in the presence of eFAs and genetic organization of the GAS FASII genes.
a Schematic representation of the GAS FabT regulon, comprising genes of the FASII locus and fakB4. Gene positions with names below are represented. Red asterisks, putative FabT binding sites; bent arrows, transcription start sites; solid arrow, transcript defined by RT-PCRs; dotted arrows, transcripts from previously reported start sites. be Volcano plots of differentially expressed genes, compared as indicated. See Supplementary Table 4 for a complete list. Volcano plots were constructed using GraphPad Prism, by plotting the negative base 10 logarithm of the p-value on the y axis, and the log of the fold change (base 2) on the x axis. P-values for comparisons of peak intensities were calculated by two-sided T-test. Statistical significance was validated by the one-sided Wald test. Padj: calculated p-values were adjusted for multiple testing using the false discovery rate controlling procedure (see Methods section). Gene expression was considered modified in a given condition when the absolute value of log2-Foldchange (FC) was greater than or equal to 1, with an adjusted p-value ≤ 0.05. Data points with low p-values (highly significant) appear at the top of the plot. Source data for b, c, d, and e are provided as a Source Data file.
Fig. 3
Fig. 3. The mFabT strain grows poorly on human tissue ex vivo.
a Comparison of GAS WT and mFabT cfus after 8 h growth in static conditions in the presence of human decidua tissue. Bacterial multiplication at the tissue surface in flow conditions (live imaging); b left, Visualization of WTeryR-igfp and mFabTeryR-igfp multiplication in 2D. Poor mFabT growth led to nearly identical images at 1 and 4 h, with some differences highlighted by white arrowheads; right, ratios over time of areas covered by the two strains. c left, 3D-surface heat map of bacterial layer thickness at 1 and 4 h. The x, y, and z axes are scaled, color code in µm; right, ratios over time of bacterial layer mean thickness of WTeryR-igfp and mFabTeryR-igfp strains on decidual tissue. Determinations were based on N = 5 for (a), N = 3 for (b, c), where N corresponds to the number of independent biological replicates performed per condition. For b and c, representative results are shown, and data are presented as mean values +/- SEM. Statistical analyses were done for (a), by a two-sided T test; for (b) and (c), by 2-way ANOVA, Bonferroni post-test. Significant p-values are shown. WT, black symbols or lines; mFabT, green symbols or lines. Source data for (a), (b), and (c) are provided as a Source Data file.
Fig. 4
Fig. 4. The mFabT strain displays adhesion and growth defects in the presence of human cells or in conditioned cell supernatant.
ad Comparison of WT and mFabT strain adhesion and growth capacities in the presence of human cells, or conditioned supernatants. Endometrial cells, undifferentiated keratinocytes, and differentiated keratinocytes, and their respective conditioned supernatants were used as specified. a Adhesion; b, c, growth (cfu.mL−1). d, left, Bacterial growth kinetics in endometrial conditioned supernatants; right, Live/Dead bacteria assessment after 8 h growth in conditioned supernatants. Growth experiments were started with 103 bacteria per ml. Determinations were based on N = 9, 7, 7 for a (left to right), N = 11, 9, 6 for (b) (left to right), N = 8, 7, 9 for (c) (left to right), and N = 3 for (d). In each case N corresponds to the number of independent biological replicates performed per condition. Analyses were done as follows: a, b Wilcoxon test for endometrial samples, two-sided T-test for keratinocytes; c Wilcoxon test for endometrial cells and undifferentiated keratinocytes, two-sided T-test for differentiated keratinocytes; d 2-way ANOVA, Bonferroni post-test. Significant p-values are shown. ac Outliers were searched using ROUT method (GraphPad), with Q = 1%. All graphs are presented as mean values +/- SEM. WT, white bars; mFabT, green bars. Source data for (a), (b), (c), and (d) are provided as a Source Data file.
Fig. 5
Fig. 5. The mFabT strain is more energy-consuming than the WT strain.
Metabolomic analysis of conditioned supernatants inoculated with WT or mFabT after 8 or 16 h incubation. Carbohydrate and amino acid consumption by the two strains are compared (see Supplementary Fig. 5 for metabolite levels in noninfected samples, and Supplementary Table 5 for further amino acid results). N = 3, 2-way ANOVA, Bonferroni post-test; Significant p-values are shown. Strains and growth times are at right.
Fig. 6
Fig. 6. Continued FASII activity in the mFabT mutant leads to lower eFA incorporation.
Membrane FA profiles were compared in WT and mFabT strains grown in THY-C17:1 (100 µM), containing or not the FASII-inhibitor platensimycin (1 µg/mL−1). Left, Representative FA profiles; right, quantified proportions of major FAs. Both strains grew in C17:1 regardless of the presence of platensimycin (Supplementary Table 6). N = 3, where N corresponds to the number of independent biological replicates used in analyses. Data are presented as mean values +/- SEM; 2-way ANOVA, Bonferroni post-test was performed. Significant p-values are shown. WT (black lines, white bars) and mFabT (green lines and bars). Source data are provided as a Source Data file.
Fig. 7
Fig. 7. The eFA incorporation defect of mFabT confers a selective advantage in saturated eFA environments, and in a simulated muscle biotope.
a Growth of WT (left), and mFabT (right) in THY supplemented with 100 μM saturated FAs, C14:0 or C16:0 and BSA 0.025%. b, Left, Incorporation of exogenous C14:0 and C16:0 from cultures described in (a). Right, Percent C14:0 and C16:0 incorporation from growth experiments. In (a) and (b), data are presented as mean values +/- SEM based on 3 biological replicates; b 2-way ANOVA, Bonferroni post-test. Significant p-values are shown. WT (black lines, white bars) and mFabT (green lines and bars). c, d Strains were spread on solid BHI medium. Pellets of organic ground bovine meat (~15% fat), used as muscle source, were placed on the bacterial lawns. Plates were photographed 36 h after incubation at 37 °C. Arrowheads indicate zones of inhibition (white) or growth (black) around muscle sources. c, Upper WTeryR-igfp and mFabTeryR-igfp strains were grown in BHI Ery 5, and plated on the same solid medium. Lower, schematic representation of GAS strain growth inhibition and stimulation by muscle. d mFabTeryR-igfp was grown in BHI Ery 5 medium containing C17:1 as FA source, without or with platensimycin to turn off FASII. Cultures were then plated on respectively the same solid medium. For c and d, N = 4 and N = 2 respectively, corresponding to biologically independent experiments. Source data for (a) and (b) are provided as a Source Data file.
Fig. 8
Fig. 8. Model for emergence of fabT mutants that are attenuated for virulence.
a Saturated FAs (SFAs) in a lipid environment favor mFabT emergence. Toxic FAs may be present in initial GAS contacts with the host. Counter-selection would lead to emergence of FA-insensitive fabT mutants, conferring a growth advantage. In a proof of concept, we show that fabT mutants are selected in an SFA environment. b Host cell environment during invasion hinders mFabT growth. Compared to the WT, fabT mutant bacteria fail to develop and die more rapidly when exposed to human cells; they are also impaired for adhesion. Longer SFAs and continued FASII activity in fabT mutants provokes a state of futile bacterial metabolism where metabolite uptake is stimulated, but does not lead to improved growth. Thus, fabT mutants in GAS populations may confer a survival advantage at the inoculation site, but do not withstand host cell infection conditions. Mauve and green circles, WT and mFabT cocci; zoom is on phospholipids. Small yellow circles and lines, lipids and eFA hydrolysis products respectively, small red, blue, pink circles, sugars and amino acid residues.

References

    1. Jerga, A. & Rock, C. O. Acyl-Acyl carrier protein regulates transcription of fatty acid biosynthetic genes via the FabT repressor in Streptococcus pneumoniae. J. Biol. Chem.284, 15364–15368 (2009). - DOI - PMC - PubMed
    1. Lambert, C. et al. Acyl-AcpB, a FabT corepressor in Streptococcus pyogenes. J. Bacteriol.205, e0027423 (2023). - DOI - PMC - PubMed
    1. Lambert, C., Poyart, C., Gruss, A. & Fouet, A. FabT, a bacterial transcriptional repressor that limits futile fatty acid biosynthesis. Microbiol. Mol. Biol. Rev.86, e0002922 (2022). - PMC - PubMed
    1. Zou, Q., Zhu, L. & Cronan, J. E. The Enterococcus faecalis FabT transcription factor regulates fatty acid synthesis in response to exogenous fatty acids. Front. Microbiol.13, 877582 (2022). - DOI - PMC - PubMed
    1. Eraso, J. M. et al. Genomic landscape of intrahost variation in group A Streptococcus: repeated and abundant mutational inactivation of the fabT gene encoding a regulator of fatty acid synthesis. Infect. Immun.84, 3268–3281 (2016). - DOI - PMC - PubMed

Publication types

MeSH terms