. 2024 Oct 4;14(1):416.
doi: 10.1038/s41398-024-03113-5.

Deciphering autism heterogeneity: a molecular stratification approach in four mouse models

Affiliations

Deciphering autism heterogeneity: a molecular stratification approach in four mouse models

Caroline Gora et al. Transl Psychiatry. .

Abstract

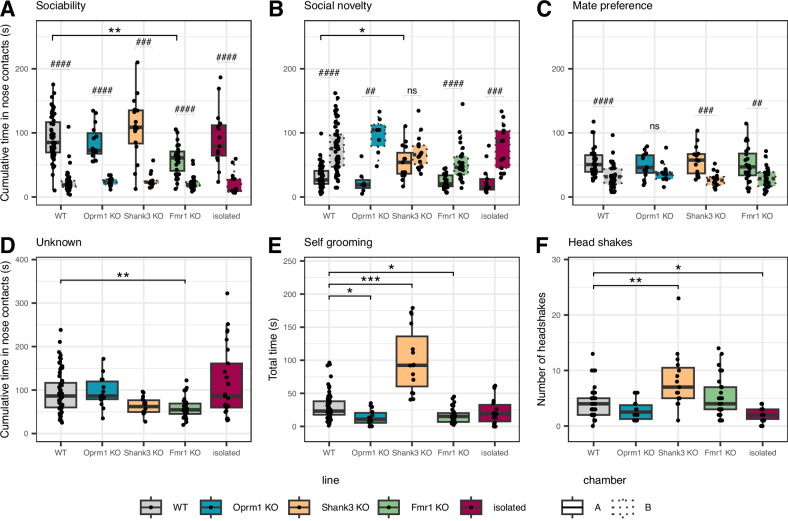
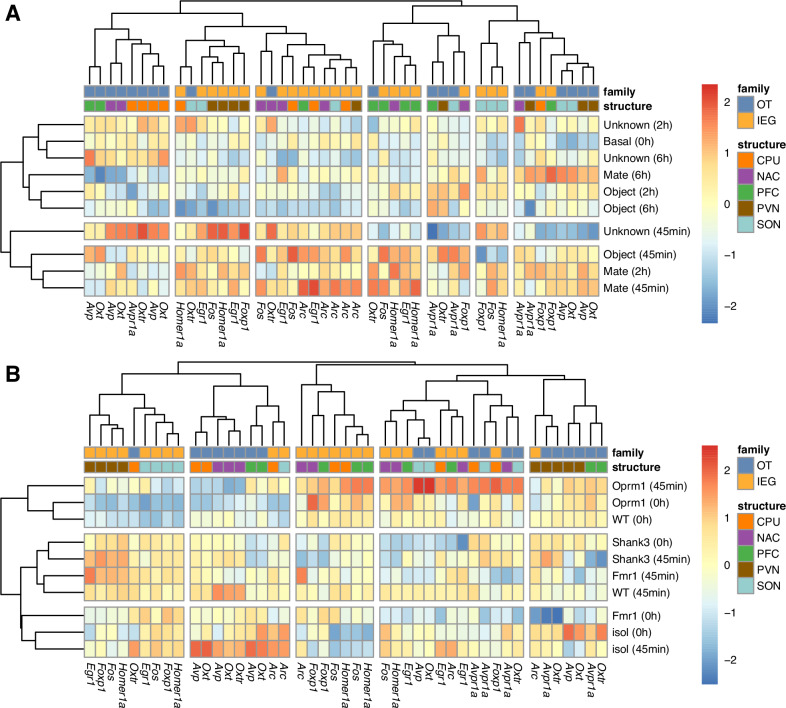
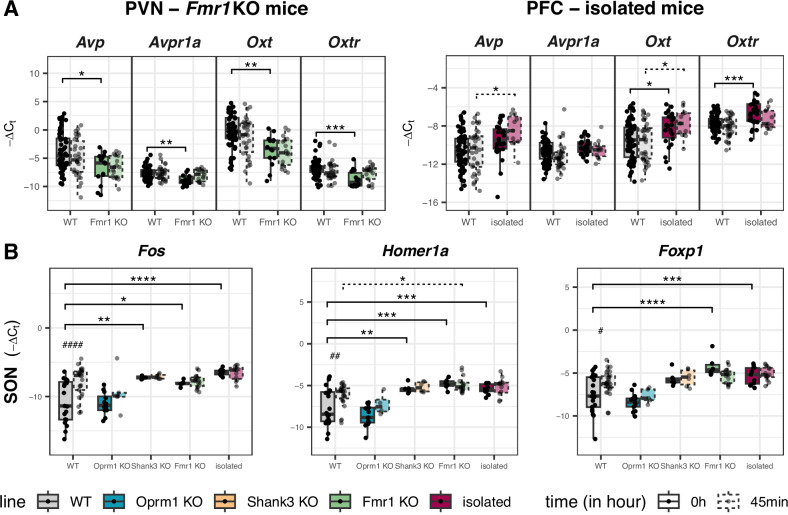
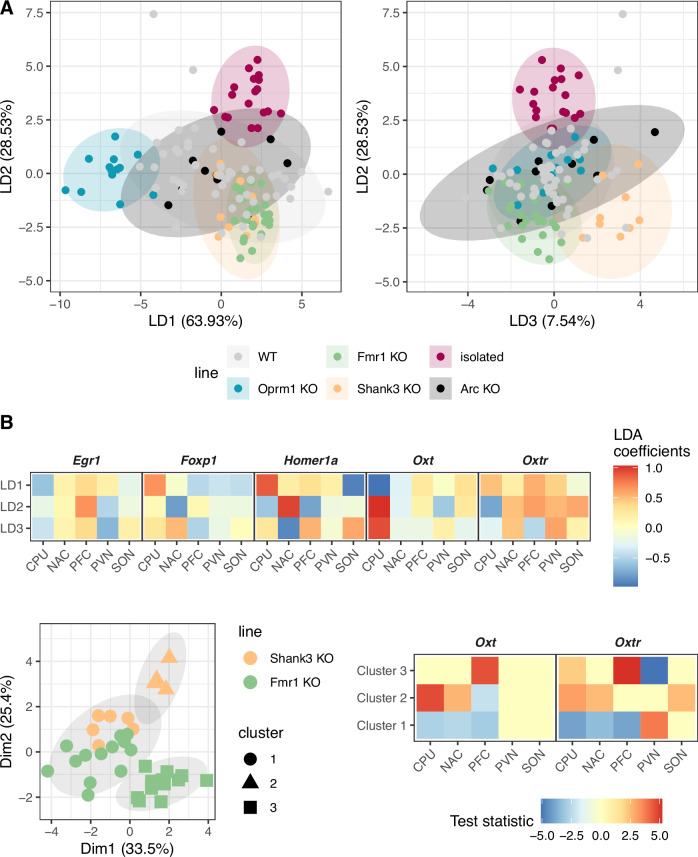
Autism spectrum disorder (ASD) is a complex neurodevelopmental condition characterized by impairments in social interaction and communication, as well as restrained or stereotyped behaviors. The inherent heterogeneity within the autism spectrum poses challenges for developing effective pharmacological treatments targeting core features. Successful clinical trials require the identification of robust markers to enable patient stratification. In this study, we identified molecular markers within the oxytocin and immediate early gene families across five interconnected brain structures of the social circuit. We used wild-type and four heterogeneous mouse models, each exhibiting unique autism-like behaviors modeling the autism spectrum. While dysregulations in the oxytocin family were model-specific, immediate early genes displayed widespread alterations, reflecting global changes across the four models. Through integrative analysis, we identified Egr1, Foxp1, Homer1a, Oxt, and Oxtr as five robust and discriminant molecular markers that allowed the successful stratification of the four models. Importantly, our stratification demonstrated predictive values when challenged with a fifth mouse model or identifying subgroups of mice potentially responsive to oxytocin treatment. Beyond providing insights into oxytocin and immediate early gene mRNA dynamics, this proof-of-concept study represents a significant step toward the potential stratification of individuals with ASD. This work has implications for the success of clinical trials and the development of personalized medicine in autism.


Conflict of interest statement

The authors declare no competing interests.

Figures

Fig. 1
Fig. 1. All four models exhibited distinct behavioral features along the autism spectrum.
In the sociability (A), the social novelty (B) or mate preference (C) phases of the three-chambered test, the cumulative time in nose contacts of Oprm1, Fmr1, Shank3 KO and isolated mice are compared to WT animals. In the sociability phase, Fmr1 KO mice exhibit reduced time spent in nose contact with an unknown WT mouse (chamber A) compared to WT mice, but not with the object (chamber B). In the social novelty phase, Shank3 KO mice display no preference for the novel mice (unknown WT mouse, chamber B) over the familiar mouse (already explored for 10 min in the precedent phase, chamber A). Oprm1 KO mice show a lack of preference for the cage mate (chamber A) over the familiar mouse (already explored for 10 min in the precedent phase, chamber B). In the reciprocal social interaction tests, the cumulative time in nose contacts with a genotype-, sex- and age-matched unknown mouse (D) is reduced in Fmr1 KO mice (green), but not in Oprm1 (blue), Shank3 KO (yellow) and isolated (burgundy) mice, compared to WT animals (gray). In motor stereotypies, the time spent in self-grooming (E) is increased in Shank3 KO mice and reduced in Oprm1 and Fmr1 KO animals, while the number of head shakes (F) is increased in Shank3 KO mice and reduced in isolated mice, compared to WT mice. Data are presented as individual data, mean ± sd (Table S2). Kruskal–Wallis tests followed by Dunn post hoc tests were performed with stars as line effect and hash as chamber effect (p = adjusted p-value with Benjamini–Hochberg correction). * or # p < 0.05, ** or ## p < 0.01, *** or ### p < 0.001, **** or #### p < 0.0001.
Fig. 2
Fig. 2. Egr1, Foxp1, Homer1a, Oxt and Oxtr are the most discriminant mRNAs in WT mice and models with ASD-like features.
Hierarchical clustering of the OT (blue) and IEG (orange) mRNAs under basal conditions and 45 min, 2 or 6 h following interactions with an unknown mouse (SI unknown), a cage mate (SI mate) or an object (NSI object) in WT animals A identifies three clusters among the different interactions and time points: one cluster with SI unknown at 45 min, one with SI mate at 45 min, 2 h and NSI object at 45 min, and one cluster with the other conditions. mRNAs and structures were separated in 7 clusters (1 to 7 from left to right). Clusters 1 and 2 mainly discriminate mRNAs induced by SI unknown at 45 min in the OT family in the NAC, CPU and PFC and IEGs in the PVN and SON, respectively. Clusters 4 and 7 highlight mRNAs that are not induced by SI unknown at 45 min compared to NSI object and SI mate, while cluster 6 shows the mRNAs that are induced by both social stimuli. Clusters 3 and 5 represent mRNAs induced by SI mate and NSI object or NSI object, respectively. Hierarchical clustering under basal conditions and following SI unknown at 45 min in Oprm1, Fmr1, Shank3 KO, isolated and WT animals B reveals that Oprm1 KO mice clustered with WT under basal conditions, where IEGs were not induced in the PVN and SON (cluster 1) but were upregulated in other brain regions (clusters 3–4). In contrast, Fmr1 KO mice at basal conditions clustered with isolated mice, showing upregulation of the OT family and Arc (cluster 2) and lower IEG expression (cluster 3) in the NAC, CPU, and PFC. Following SI unknown, Fmr1 KO mice clustered with Shank3 KO mice and WT exposed to SI unknown at 45 min, marked by higher levels of IEGs in the PVN and SON (cluster 1). Blue and red indicate low and high expression levels, respectively. All data, mean and statistical values are represented in Figs. S6–S8, S10, S11, S14, S15 and Tables S3, S4. CPU, caudate putamen; NAC nucleus accumbens, PFC prefrontal cortex, PVN paraventricular nucleus, SON supraoptic nucleus.
Fig. 3
Fig. 3. Dysregulations are model-specific for the OT family and widespread across models for IEGs.
Dysregulations in the OT family are rather specific to a model when comparing induced 45 min after social interaction with an unknown mouse (SI unknown, dashed lines) over basal conditions (solid lines) in Oprm1 (blue), Shank3 KO (yellow), Fmr1 KO (green) and isolated (burgundy) mice, compared to WT mice (gray). In the PVN (A), Fmr1 KO mice exhibit reduced levels of Oxt, Avp, Oxtr and Avpr1a mRNAs under basal conditions, compared to WT mice, while in the PFC, Avp, Oxt and Oxtr mRNAs are up-regulated in isolated mice (burgundy), compared to WT mice. In the SON, among the IEGs (B), Fos, Foxp1 and Homer1a levels were not induced 45 min after SI unknown over basal conditions across the four mouse models for different reasons in these models. While they remained at basal levels following SI unknown in Oprm1 KO mice, they were already induced under basal conditions in the other three models. Data are presented as individual data, mean ± sd (Table S4). Linear models followed by post hoc tests based on estimated marginal means were performed with stars as line effect and hash as basal vs SI unknown 45 min effect (p = adjusted p-value with Tukey correction). * or #p < 0.05, ** or ##p < 0.01, *** or ###p < 0.001. PFC prefrontal cortex, PVN paraventricular nucleus, SON supraoptic nucleus.
Fig. 4
Fig. 4. Stratification of the four models using the five molecular markers Egr1, Foxp1, Homer1a, Oxt and Oxtr.
Linear discriminant analysis (LDA; A) revealed that Oprm1 (blue, LD1 component) and isolated (burgundy; LD2 component) mice clustered apart from the other two models. LD3 component discriminates between Shank3 KO (yellow) and Fmr1 KO (green) mice. While challenged with WT (gray) and Arc KO mice (black), the stratification predicted that both mice were similar to Fmr1 KO mice, followed by Oprm1 KO mice for WT mice and Shank3 KO mice for Arc KO mice. The heatmap with LDA coefficients (B) indicates that the five molecular markers, Egr1, Foxp1, Homer1a, Oxt and Oxtr, contributed to the stratification of the models. Hierarchical Clustering on Principal Components (HCPC; C) revealed three subgroups among Shank3 KO and Fmr1 KO mice (left panel). Cluster 1, which contains Shank3 KO and Fmr1 KO mice, displays lower levels of Oxt and Oxtr in the CPU, NAC and PFC, as well as increased levels of Oxtr in the PVN. Blue, red and white indicate low, high levels or no significant contribution, respectively. PFC prefrontal cortex, NAC nucleus accumbens, CPU caudate putamen, PVN paraventricular nucleus, SON supraoptic nucleus.

Similar articles

Cited by

References

    1. Lord C, Brugha TS, Charman T, Cusack J, Dumas G, Frazier T, et al. Autism spectrum disorder. Nat Rev Dis Primers. 2020;6:5. - PMC - PubMed
    1. American Psychiatric Association. Diagnostic and statistical manual of mental disorders. 5th ed. American Psychiatric Association; 2013.
    1. Kaufmann WE, Kidd SA, Andrews HF, Budimirovic DB, Esler A, Haas-Givler B, et al. Autism spectrum disorder in fragile X syndrome: cooccurring conditions and current treatment. Pediatrics. 2017;139:S194–S206. - PMC - PubMed
    1. Asta L, Persico AM. Differential predictors of response to early start Denver model vs. early intensive behavioral intervention in young children with autism spectrum disorder: a systematic review and meta-analysis. Brain Sci. 2022;12:1499. - PMC - PubMed
    1. McCracken JT, McGough J, Shah B, Cronin P, Hong D, Aman MG, et al. Risperidone in children with autism and serious behavioral problems. N Engl J Med. 2002;347:314–21. - PubMed