. 2024 Oct 5;15(1):8631.
doi: 10.1038/s41467-024-52762-z.

Concerted transcriptional regulation of the morphogenesis of hypothalamic neurons by ONECUT3

Affiliations

Concerted transcriptional regulation of the morphogenesis of hypothalamic neurons by ONECUT3

Maja Zupančič et al. Nat Commun. .

Abstract

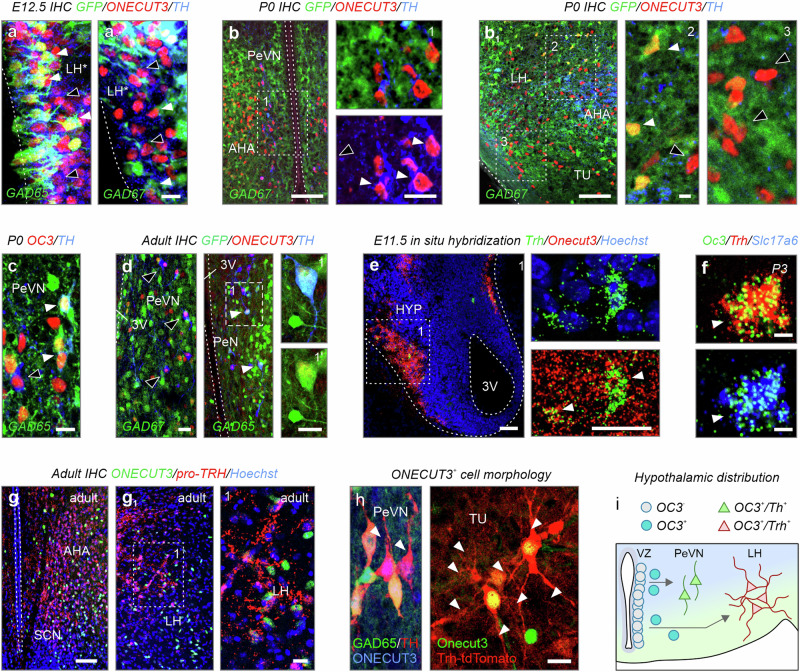
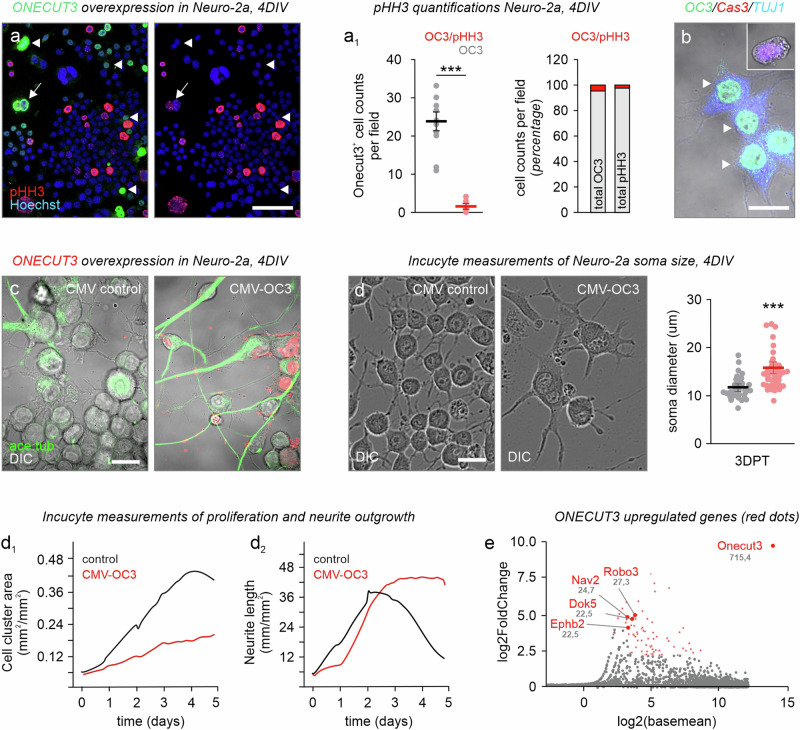
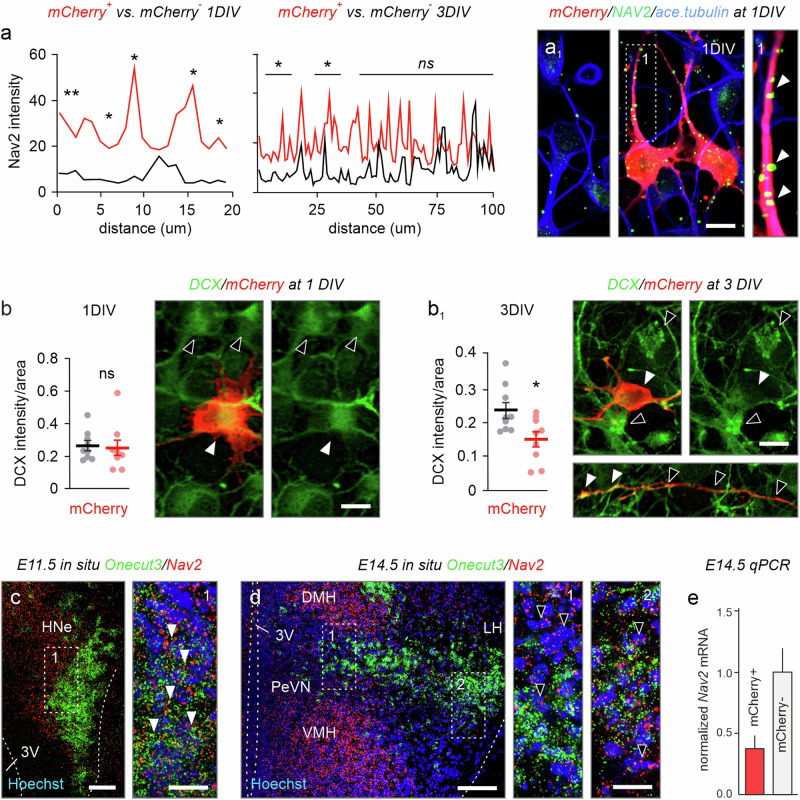
Acquisition of specialized cellular features is controlled by the ordered expression of transcription factors (TFs) along differentiation trajectories. Here, we find a member of the Onecut TF family, ONECUT3, expressed in postmitotic neurons that leave their Ascl1+/Onecut1/2+ proliferative domain in the vertebrate hypothalamus to instruct neuronal differentiation. We combined single-cell RNA-seq and gain-of-function experiments for gene network reconstruction to show that ONECUT3 affects the polarization and morphogenesis of both hypothalamic GABA-derived dopamine and thyrotropin-releasing hormone (TRH)+ glutamate neurons through neuron navigator-2 (NAV2). In vivo, siRNA-mediated knockdown of ONECUT3 in neonatal mice reduced NAV2 mRNA, as well as neurite complexity in Onecut3-containing neurons, while genetic deletion of Onecut3/ceh-48 in C. elegans impaired neurocircuit wiring, and sensory discrimination-based behaviors. Thus, ONECUT3, conserved across neuronal subtypes and many species, underpins the polarization and morphological plasticity of phenotypically distinct neurons that descend from a common pool of Ascl1+ progenitors in the hypothalamus.


Conflict of interest statement

The authors declare no competing interests.

Figures

Fig. 1
Fig. 1. ONECUT3 expression in the developing mouse embryo.
a Whole-mount immunohistochemistry at E8.5 suggested the lack of ONECUT3 expression. b ONECUT3+ neurons were sparsely detected at E9.5 in the spinal cord (arrowheads) with limited presence in the diencephalon (open arrowheads). cc1 Whole-mount immunolabelling at E10.5 revealed ONECUT3 protein expression (arrowheads) throughout the central nervous system. d ONECUT3 was localized outside the hypothalamic proliferative zone (that is SOX2+). Open arrowheads mark ONECUT3+/SOX2 cells. e, e1 ONECUT3+ neuronal processes (arrowheads) at E9.5 were seen in Tau-mGFP (e) and tdTomato reporter mice (e1). f, g The processes (arrowheads) of ONECUT3+ neurons, likely axons, coursed throughout the entire central nervous system by E10.5, as visualized by transgene constructs. Projections (GAP43+) in the spinal cord of the whole mount embryo (f, f1) and within the mesencephalon (g) were noted. Asterisks label the ONECUT3+ region. h In Onecut3-mCherry mice, mCherry exhibited a near-complete overlap with ONECUT3 protein (in green). i Whole-mount 3D imaging of Onecut3-mCherry brains at E14.5 revealed the co-localization of mCherry with Onecut3 protein throughout the forebrain, mid-, and hindbrain. j Expression of Onecut3 in the hypothalamus decreased with age, as was determined by qPCR and plotted as means ± s.e.m. (n = 2/group). For anatomical analysis, immunohistochemistry was performed >3 per developmental age. Source data are provided as a Source Data file. 3V third ventricle, CTX cortex, den diencephalon, E embryonic day, HB hindbrain, HNe hypothalamic neuroepithelium, HYP hypothalamus, IHC immunohistochemistry, LV lateral ventricle, MB midbrain, mes mesencephalon, NT neural tube, OC3 ONECUT3, pros prosencephalon, rhom rhombencephalon, SEP septum, sp spinal cord, tel telencephalon, VZ ventricular zone. Scale bars = 100 µm (ac, e, f, h, i), 50 µm (d, e1, f1, g), 20 µm (h1).
Fig. 2
Fig. 2. Neurochemical heterogeneity of ONECUT3+ neurons within the hypothalamus.
a, b1 Onecut3+ hypothalamic neurons belong to the Ascl1 progeny, as supported by both UMAP visualization of single-cell RNA-seq data (scRNA-seq; a) and in situ hybridization on E11.5 (b, b1). In situ hybridizations were repeated at least two times. c, c1 When probed for neurotransmitter and neuropeptide identity in an open-label scRNA-seq dataset combined from E15.5-P23, Onecut3+ neurons formed two distinct groups marked by either Slc32a1/Th or Slc17a6/Trh expression. UpSet plot (c) depicts co-expression frequency amongst Onecut3+ neurons with Slc1716, Slc32a1, Gad1, and Gad2. Onecut3-expressing Slc32a1/Th+ and Slc17a6/Trh+ populations were highlighted on UMAP plots (c1). E embryonic day, HNe hypothalamic neuroepithelium, Th tyrosine hydroxylase, Trh thyrotropin-releasing hormone, UMAP uniform manifold approximation, and projection. Scale bars = 100 µm (b), 50 µm (b1), 20 µm (1, 2).
Fig. 3
Fig. 3. Trh and Th in Onecut3+ hypothalamic neurons.
ad2 Hypothalamic expression of Onecut3 and Trh and/or Th across different developmental stages, as shown by in situ hybridization. At E14.5, Onecut3+/Trh+ double-labeled neurons were found in the preoptic (a), anterior (a1), and tuberal (a2) hypothalamus. Note the increasing density of Onecut3+/Trh+ neurons in the lateral direction (a1, a2). A similar pattern was maintained in the adult preoptic (bb2), anterior (cc2), and tuberal (dd2) hypothalamus. Onecut3+/Trh+ neurons are concentrated in the lateral preoptic area (b1), retrochiasmatic (c1), and tuberal nuclei (d2). Onecut3+/Th+ neurons were restricted to the PeVN. Pink arrowheads mark Onecut3+/Trh+ neurons, whereas blue arrowheads point to Onecut3+/Th+ neurons. Asterisks mark prospective hypothalamic regions. In situ hybridizations were repeated at least two times. 3V third ventricle, AHA anterior hypothalamic area, DMH dorsomedial hypothalamus, E embryonic day, LH lateral hypothalamus, LPO lateral preoptic area, MPO medial preoptic area, MZ mediolateral zone, P postnatal day, PeVN periventricular nucleus, RCH retrochiasmatic nucleus, TU tuberal nucleus, VMH ventromedial hypothalamus, scale bars = 100 µm (ad1), 20 µm (insets).
Fig. 4
Fig. 4. Neurotransmitter identity of ONECUT3+ neurons.
a, a1 Immunohistochemistry in GAD65-GFP and GAD67-GFP mice at E12.5 demonstrated that a subpopulation of ONECUT3+ neurons co-expressed Gad1/Gad2 in the hypothalamic neuroepithelium (arrowheads). Open arrowheads point to GFP/ONECUT3+ cells. b, b1 Immunohistochemistry in GAD67-GFP mice at P0. ONECUT3+/GFP+ neurons were observed within both anterior (b) and lateral (b1) areas (arrowheads). Note the absence of GFP in ONECUT3+/TH+ periventricular neurons (open arrowheads). c ONECUT3+/TH+ neurons expressed GAD65 in the PeVN (arrowheads) at birth. d Immunohistochemistry in adult GAD67-GFP (left) and GAD65-GFP (right) transgenic mice. Onecut3+/TH+ neurons were GFP+ in GAD65-GFP (arrowheads) but not in GAD67-GFP mice (open arrowheads). e, f Early embryonic (E11.5) and postnatal in situ hybridization revealed the presence of Onecut3+/Trh+ neurons (arrowheads) within the hypothalamus. gg1 Immunolabelling for pro-TRH in adult hypothalamus. h The morphology of ONECUT3+ neurons in GAD65-GFP and Trh-tdTomato reporter mice (arrowheads denote processes). i Scheme outlining differential neurotransmitter expression in hypothalamic territories, and the positions of ONECUT3+ neurons within. Blue-to-green gradient indicates a transition from GABA to glutamate territories. In situ hybridizations and immunohistochemistry were repeated at least two times. 3V third ventricle, AHA anterior hypothalamic area, ARC arcuate nucleus, DMH dorsomedial hypothalamus, E embryonic day, IHC immunohistochemistry, LH lateral hypothalamus, MZ mediolateral zone, P postnatal day, PeVN periventricular nucleus, SCN suprachiasmatic nucleus, TU tuberal nucleus, VMH ventromedial hypothalamus; scale bars = 100 µm (b, b1, d, e, g), 20 µm (a, a1, and insets in b, b1, ch).
Fig. 5
Fig. 5. ONECUT3 overexpression induces the differentiation of Neuro-2a cells.
a, a1 Overexpression of ONECUT3 limited Neuro-2a cell proliferation as shown by a reduction in the mitotic marker pHH3 (n = 259 cells per condition over 11 fields imaged, p = 7,53E-07). b Cleaved caspase-3 (Cas3) was absent from transfected cells. c Neuro-2a cells three days post-transfection with mock (control; left) or CMV-Onecut3 (OC3) plasmid (right). Note the induction of stable processes (acetylated tubulin+, green) upon ONECUT3 overexpression. d Representative images of Neuro-2a somata (differential interference contrast; DIC) after 4 days in vitro (DIV). Cell body size was measured by tracing the diameter of the somata, and analyzed with an unpaired two-tailed Student’s t-test. (n = 47/group, p = 8,19508E-06). d1, d2 Live-cell imaging of the cell cluster area (b1) and neurite length (b2) over a period of five days. e Dot plot illustrating relative gene expression as measured by sequencing bulk mRNA of Neuro-2a cells four days post-transfection. The top target genes involved in cytoskeletal remodeling were marked in red. Data were assessed with unpaired two-tailed Student’s t-test and expressed as means ± s.e.m. ***p < 0.001 (a1, d). Source data are provided as a Source Data file. ace. tub. acetylated tubulin, CMV cytomegalovirus promoter, DIV days in vitro, OC3 Onecut3. Scale bars = 100 µm (a), 20 µm (bd).
Fig. 6
Fig. 6. NAV2 shapes ONECUT3-mediated neurite outgrowth in a TRIO-dependent fashion.
a Reconstruction of a protein-protein interaction network distinguished a pathway from ONECUT3 downstream to NAV2 within the signaling cassette supporting regulation of RhoA-mediated cytoskeletal dynamics. Note that arrows indicate an interaction, but not their directionality per se. b Changes in NAV2 protein levels after ONECUT3 overexpression. NAV2 signal intensity from the somata along neurites until their motile end tips were plotted. Data were acquired by Plot profiling in ImageJ (n = 68 cells/group). c NAV2 protein localization and distribution in the soma, along the process, and in pseudo-growth cones of Neuro-2a cells after ONECUT3 overexpression. Neuro-2a cells extended their neurites without forming classical synapse-like structures. d Pathway prediction downstream from ONECUT3, including NAV2 and its interacting partners known to trigger cytoskeletal remodeling to promote neuritogenesis. e, e1 Neurite outgrowth and branching were inhibited by ITX3, a Trio N-terminal RhoGEF domain inhibitor. Experiments were performed in triplicate. Representative DIC images at 3 days post-transfection showed the reduced length of processes upon ITX3 treatment (e). Neurite length and branching were measured by IncuCyte live-cell imaging (e1). A neurite mask (blue) was overlaid on the processes. Note that due to extensive proliferation, the difference in total neurite length was obscured in the first 2 days post-transfection until control cultures reached confluence (the experiment was performed twice). Data were evaluated by unpaired two-tailed Student’s t-test. *p < 0.05. Source data are provided as a Source Data file. ace. tub. acetylated tubulin, CMV cytomegalovirus promoter, DIV days in vitro, gc growth cone, OC3 ONECUT3. Scale bars = 100 µm (e), 20 µm (b, c).
Fig. 7
Fig. 7. Nav2 expression in developing hypothalamic neurons.
a, a1 NAV2 protein levels in primary hypothalamic neurons at 1 and 3 DIV. NAV2 levels were significantly higher in mCherry+ neurons from Onecut3-mCherry fetuses, as compared to other hypothalamic neurons at 1DIV (two-tailed Student’s t-test). A lesser difference was seen at 3DIV. NAV2 signal intensity was quantified along neurites using Plot profiling in ImageJ (n = 11 cells/group for 1DIV, n = 12 cells/group for 3DIV; p < 0.05), as exemplified in a1 (arrowheads mark NAV2+ substructures in the neurite). b, b1 DCX in mCherry+ hypothalamic neurons at 1DIV and 3DIV (open vs solid arrowheads). Differences in DCX expression were analyzed by quantifying immunofluorescence signal intensity within the soma (n = 9 for both 1DIV and 3DIV, p = 0.04). Data represent means ± s.e.m.; statistical differences between the groups were assessed by unpaired two-tailed Student’s t-test. c In situ hybridization revealed the co-existence of Onecut3 and Nav2 at E11.5 in mice (arrowheads). d, e Nav2 mRNA in Onecut3+ neurons in vivo at E14.5, as demonstrated by in situ hybridization (d) and qPCR (e) on mCherry+ (Onecut3+) hypothalamic neurons sorted from Onecut3-mCherry transgenic mice (n = 4 pooled embryos/sample) plotted as means ± s.e.m. In situ hybridizations were repeated at least two times. Source data are provided as a Source Data file. 3V third ventricle, DMH dorsomedial hypothalamus, E embryonic, HNe hypothalamic neuroepithelium, LH lateral hypothalamic area, PeVN periventricular nucleus, VMH ventromedial hypothalamus. Scale bars = 100 µm (a, b), 20 µm (a, b1; insets in c, d), 10 µm (b).
Fig. 8
Fig. 8. ONECUT3 loss-of-function in the PeVN of the mouse hypothalamus.
a siRNA-mediated Onecut3 (OC3) knock-down reduced ONECUT3 protein levels in the nuclei (open arrowheads) of Onecut3-mCherry+ neurons in the LH of neonatal mice. Mice were unilaterally injected in the LH on P4 and sampled on P10. ONECUT3 protein content was visualized by immunohistochemistry. a1 ONECUT3 (OC3) signal intensity was compared between the non-injected (ctrl) vs siRNA-injected hemispheres of mice (n = 4/group; p = 0.0431). Data from each mouse were interconnected. a2 The number of ONECUT3+ neurons that populated the LH did not differ as a result of siRNA injection (ns non-significant; n = 4 subjects/group). bb2 In situ hybridization revealed the downregulation of Nav2 mRNA after siRNA treatment (dotted lines denote the individual cells measured, n = 3 subjects/group, 15 cells; p = 0.0433 (b1) and 0.0363 (b2). c, c1 Knock-down of Onecut3 reduced neurite density, as measured by the area coverage of mCherry+ fibers in the LH, noting that Onecut3+ neurons were multipolar. The area occupancy of mCherry+ neurites, likely local dendrites, in the LH of Onecut3-mCherry mice, was compared between the non-injected (ctrl) vs siRNA-injected hemispheres (n = 4 mice; p < 0.05). Data from each mouse were interconnected. p = 0.0497, n.s. non-significant, two-tailed Student’s t-test. Scale bars = 250 µm (a), 20 µm (b), and 100 µm (c). Source data are provided as a Source Data file.
Fig. 9
Fig. 9. Loss of ceh-48 (Onecut homolog) reduces dendrite complexity and chemotaxis in C. elegans.
a Unc-53 mRNA levels from wild-type and ceh-48 mutants (n = 3 (ceh-48) and 4 (WT) collections of larvae/group; p = 0.0191). b, b1 Wild-type (N2; WT) and ceh-48 (tm237) C. elegans mutant worms were exposed to DiI to label their amphid neurons and their processes. Images were taken on a differential interference contrast background to demarcate anatomical structures, particularly sensory dendrites. Ceh-48 knockout led to the repositioning of amphid neurons (arrowheads) in relation to the terminal bulb (t), and the defasciculation of their dendrites (arrows). cc2 The length of amphid dendrites was increased in ceh-48 and unc-53 mutants, as compared to wild-type worms. For DiI uptake, n = 12 (WT) vs n = 16 (ceh-48) and n = 13 (unc-53) worms were used. p = 0.0000 and 0.0198 (c), p = 0.0000 and 0.0007 (c1), p = 0.0000 and 0.0062, 0.0058, 0.0092, and 0.0046 (c2). Data were expressed as means ± s.e.m.; ***p < 0.001, Student’s t-test. d Schematic representation of the chemotaxis experiment with EtOH (control plate) and benzaldehyde odor (vs EtOH; experimental plate). NaN3 was used to immobilize the worms. d1 Both ceh-48 and unc-53 mutants displayed reduced preference for benzaldehyde (experiments were performed in triplicates and pooled, n = 7184 (ceh-48), 9221 (N2) and 2459 (unc-53) worms analyzed; p = 0.001 (ceh-48 vs N2), 0.0000 (unc-53 vs N2), and 0.0769 (unc-53 vs ceh-48). Data were expressed as means ± s.e.m. Statistical differences between the groups were tested by two-tailed ANOVA; *p < 0.05, ***p < 0.001 (post-hoc test). Scale bars = 75 µm (b, b1), 20 µm (insert). Source data are provided as a Source Data file.

Similar articles

Cited by

References

    1. Sower, S. A., Freamat, M. & Kavanaugh, S. I. The origins of the vertebrate hypothalamic-pituitary-gonadal (HPG) and hypothalamic-pituitary-thyroid (HPT) endocrine systems: new insights from lampreys. Gen. Comp. Endocrinol.161, 20–29 (2009). - PubMed
    1. Maggi, R., Zasso, J. & Conti, L. Neurodevelopmental origin and adult neurogenesis of the neuroendocrine hypothalamus. Front. Cell Neurosci.8, 440 (2015). - PMC - PubMed
    1. Romanov, R. A. et al. Molecular design of hypothalamus development. Nature.10.1038/s41586-020-2266-0 (2020). - PMC - PubMed
    1. Yaghmaeian Salmani, B. et al. Selective requirement for polycomb repressor complex 2 in the generation of specific hypothalamic neuronal subtypes. Development149, dev200076 (2022). - PMC - PubMed
    1. van den Pol, A. N., Obrietan, K., Cao, V. & Trombley, P. Q. Embryonic hypothalamic expression of functional glutamate receptors. Neuroscience67, 419–439 (1995). - PubMed

Publication types

Substances