. 2024 Oct 4;10(1):87.
doi: 10.1038/s41523-024-00693-9.

Cancer risk assessment of premalignant breast tissues from patients with BRCA mutations by genome profiling

Affiliations

Cancer risk assessment of premalignant breast tissues from patients with BRCA mutations by genome profiling

Takeshi Hirose et al. NPJ Breast Cancer. .

Abstract

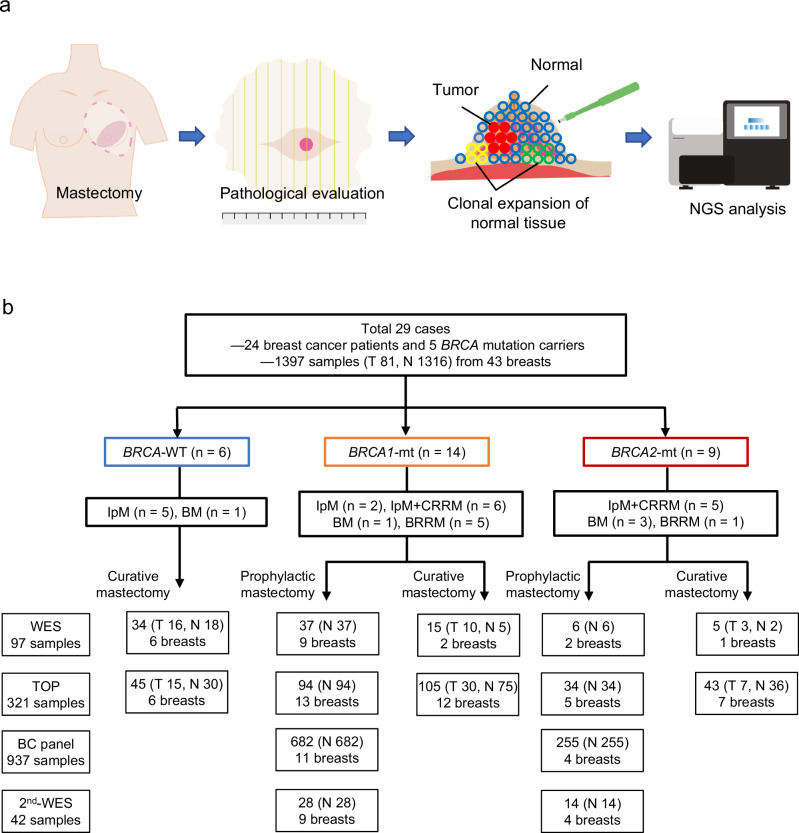
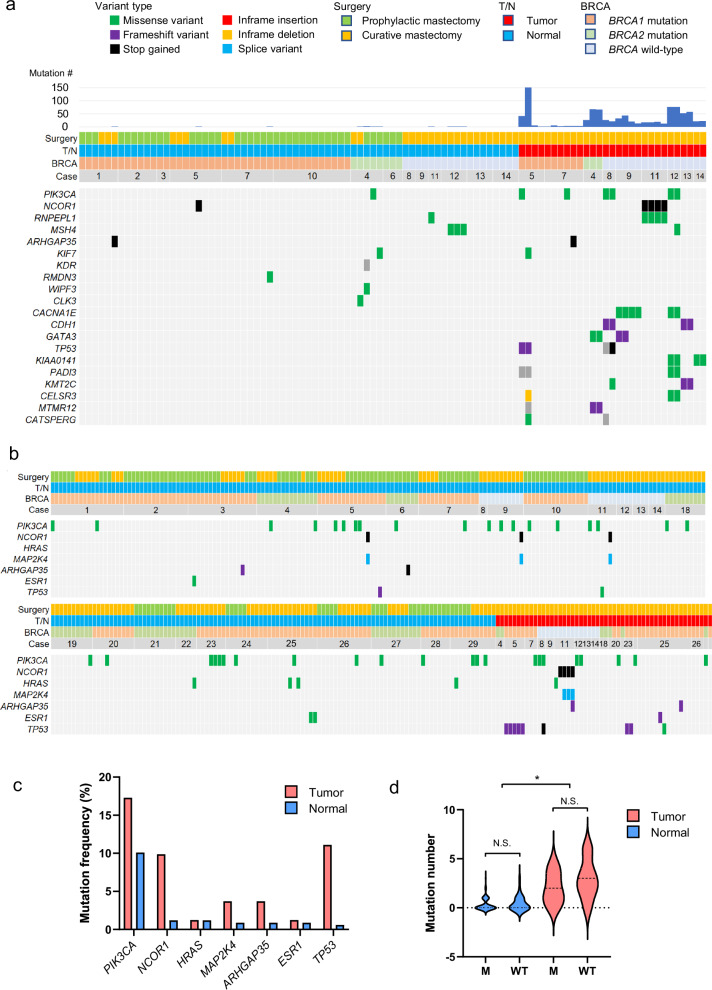
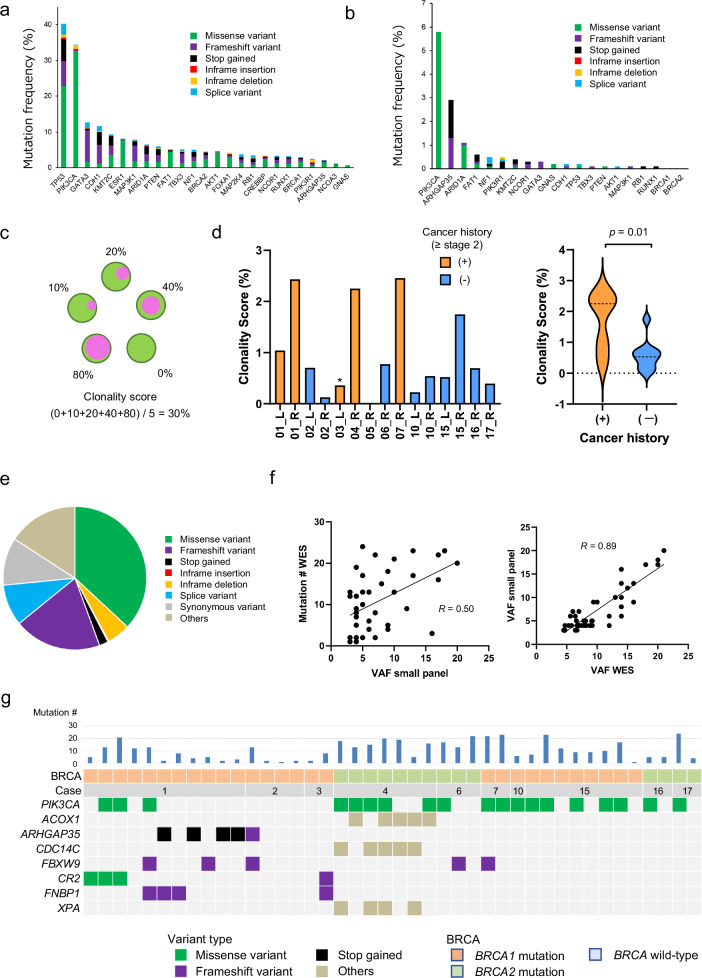
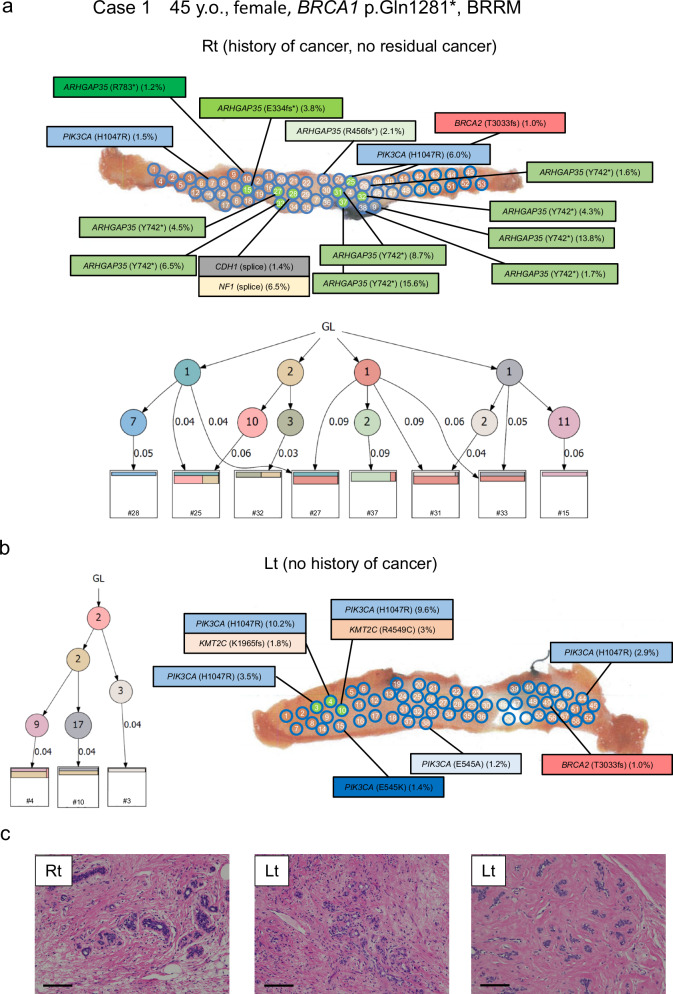
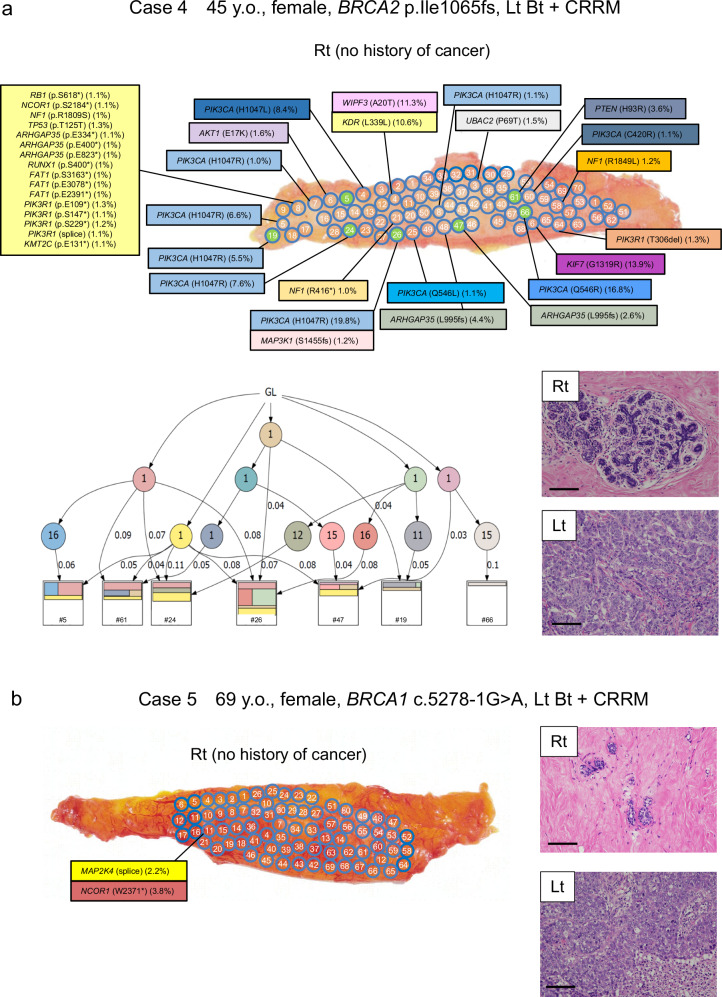
Patients with germline pathogenic variants of BRCA1/2 genes have a particular predisposition to develop breast cancer. No clinical test has been developed to accurately and quantitatively evaluate their risk of developing breast cancer. We hypothesized that aberrant cell clonal expansion may be initiated in normal breast tissues without manifesting pathologic changes. To assess the prevalence of clonal expansion in the normal breast, we collected normal breast tissue from 24 breast cancer patients who had undergone surgical resection and 5 carriers of pathogenic BRCA1/2 variant who had undergone prophylactic mastectomy. Whole-exome sequencing (WES) was conducted in 97 specimens from 14 individuals, and TOP panel, a gene panel targeting 464 genes, was conducted in 321 specimens from 26 individuals, including 8 individuals with germline pathogenic variants of BRCA1/2 genes. Recurrent oncogenic mutations within PIK3CA, ARHGAP35, HRAS, and NF1 were identified in normal breast tissue at considerable variant allelic frequencies (VAF), suggesting clonal expansion. In addition, 937 normal breast tissues were evaluated using the Breast Cancer Panel (BCP) targeting 25 genes to determine the exact prevalence and distribution of clonal expansion. To assess the clonal expansion, we developed the clonality score, which is the mean value of clonal cell fractions for samples obtained from a given breast. The average clonality score in macroscopically normal breast tissue was 0.95 (0-2.46), with a significant difference between cases with and without a history of breast cancer of stage 2 or more advanced stage (p = 0.01). Additional WES on 42 samples with relatively large clone size (VAF > 3%) confirmed that these cell clones harbored multiple mutations (10.7 mutations/sample), and the number of existing mutations was consistent with the clone size (R = 0.50). The results suggest that clonal changes occur in normal breast tissue of women at high risk for breast cancer even before cancer is detected pathologically and/or radiologically, and the clonality score shows the potential to be a valid method of evaluating clonal expansion for cancer-risk assessment that provides appropriate preventive options for patients at high risk for breast cancer.


Conflict of interest statement

The authors declare no competing interests.

Figures

Fig. 1
Fig. 1. Study overview.
a Schematic diagram of the study. Resected breasts from prophylactic mastectomy of BRCA1/2 carriers and curative mastectomy of patients with breast cancer are subjected to pathological and genomic analysis. Multisampling from breast tissue samples was performed to evaluate the molecular profiling of the tumor and to identify and assess clonal expansion of normal tissue. b Study profile. A total of 24 patients with breast cancer and 5 with BRCA1/2 mutations participated in the study. IpM ipsilateral mastectomy, BM bilateral mastectomy, BRRM bilateral risk-reducing mastectomy, CRRM contralateral risk-reducing mastectomy.
Fig. 2
Fig. 2. Mutational profile of macroscopically normal breast tissues and breast cancer tissues.
a Frequently mutated genes by WES with color coding of their alteration status for each tumor. The case number, BRCA status, sample origin, types of surgery, and total mutation number are shown at the top. b Frequently mutated genes by TOP panel with color coding of their alteration status for each tumor. The case number, BRCA status, sample origin, and types of surgery are shown at the top. The blank case numbers are 19, 22, 24, 27, and 29 in order. c Oncogenic mutations frequently identified in macroscopically normal breast tissues and breast cancer tissues. d The mutation number was compared between tumor and normal samples, and between samples with BRCA1/2 mutations and wild-type BRCA. The dotted lines in the violin plot indicate the average. N.S. not significant, *p < 0.05, student’s t test.
Fig. 3
Fig. 3. Mutational profile using BCP and its correlation with WES.
a The mutation frequency of the 25 breast cancer-related genes in the GENIE database. The mutation frequencies in the breast cancer cohort in GENIE database are indicated as bar graphs with the variant type categories. b The mutation frequency of the 25 breast cancer-related genes identified in macroscopically normal breast tissues. The mutation frequencies in macroscopically normal breast tissues of this study are indicated as bar graphs with the variant type categories. c The scheme depicts the concept of clonality score, which is defined as the average of the clonal cell fraction in the samples of individual breast. For instance, the clonality score of the breast in which the clonal cell fractions in five samples are 0, 10, 20, 40, and 80% is (0 + 10 + 20 + 40 + 80)/5 = 30%. d The clonality score for 15 individual breasts from 11 patients is shown as bar graphs on the left. *; this breast was resected one month after NAC. The clonality scores were compared between samples from breasts with and without a history of breast cancer, and revealed as violin plots on the right (average; 1.71 vs. 0.57, p = 0.01, student’s t test). e The distribution of the variant types of 451 mutations identified by WES in 42 macroscopically normal breast samples from 10 patients harboring mutations with VAF (>3%). f The correlation between the mutation number identified by WES and highest VAF values identified by BCP is shown on the left. The correlation between the highest VAF identified by WES and that by small panel is shown on the right. g Frequently mutated genes identified by WES in 42 macroscopically normal breast samples with color coding of their variant types. The case number, BRCA status, and total mutation number are shown at the top.
Fig. 4
Fig. 4. Mutational mapping and phylogenetic tree analysis following bilateral risk-reducing mastectomy.
a Case 1 is an analysis of bilateral risk-reducing mastectomy in a 45-year-old woman with BRCA1 p.Q1281*. She has a history of right breast cancer and underwent partial mastectomy followed by adjuvant chemoradiotherapy. In the right breast, 14 specimens from 53 samples had mutations in PIK3CA, ARHGAP35, CDH1, and NF1, and the clonality score was 2.42. Phylogenetic tree analysis of 8 samples (green highlighted) using WES data are shown. b Overall 6 of 58 samples in the left breast had mutations in PIK3CA, and the clonality score was 0.99. Phylogenetic tree analysis of 3 samples (green highlighted) using WES data are shown. c The representative microscopic images of breast tissue with hematoxylin and eosin (HE) staining. The left picture shows sclerosing adenosis. Magnification, ×100. Scale bars represent 200 μm. Lt left, Rt right, GL germline.
Fig. 5
Fig. 5. Mutational mapping and phylogenetic tree analysis following contralateral risk-reducing mastectomy.
a Case 4 was a 45-year-old woman with BRCA2 p.I1065fs who had left breast cancer, underwent total mastectomy of left breast, and underwent risk-reducing mastectomy of the right breast. and case 5 was a 69-year-old woman with BRCA1 c.5278-1 G > A. Although no cancer was identified in the right breast, 14 specimens from 68 samples had mutations in PIK3CA, ARHGAP35, and PIK3R1, and the clonality score was 2.29. Phylogenetic tree analysis of 7 samples (green highlighted) using WES data are shown. The representative microscopic images of breast tissue with HE staining. No pathological finding was observed in the right breast, while the tumor in the left breast was invasive ductal carcinoma. Magnification, ×100. Scale bars represent 200 μm. b Case 5 was a 69-year-old woman with BRCA1 c.5278-1 G > A who had left breast cancer, underwent total mastectomy of left breast, and underwent risk-reducing mastectomy of the right breast. In contrast to case 4, all 68 samples from case 5 had no mutation in the 25 genes. The representative microscopic images of breast tissues with HE staining are shown in the right. Extensive hyalinization and ductal and lobular atrophy were observed in the right breast. The tumor in the left breast was invasive ductal carcinoma. Magnification, ×100. Scale bars represent 200 μm. Lt left, Rt right, GL germline.

References

    1. Heer, E. et al. Global burden and trends in premenopausal and postmenopausal breast cancer: a population-based study. Lancet Glob. Health8, e1027–e1037 (2020). - DOI - PubMed
    1. Cancer Genome Atlas, N. Comprehensive molecular portraits of human breast tumours. Nature490, 61–70 (2012). - PMC - PubMed
    1. Ciriello, G. et al. Comprehensive molecular portraits of invasive lobular breast cancer. Cell163, 506–519 (2015). - DOI - PMC - PubMed
    1. Kakiuchi, N. & Ogawa, S. Clonal expansion in non-cancer tissues. Nat. Rev. Cancer21, 239–256 (2021). - DOI - PubMed
    1. Martincorena, I. et al. Tumor evolution. High burden and pervasive positive selection of somatic mutations in normal human skin. Science348, 880–886 (2015). - DOI - PMC - PubMed

LinkOut - more resources