. 2024 Oct 4;15(1):8624.
doi: 10.1038/s41467-024-53006-w.

MDM2 induces pro-inflammatory and glycolytic responses in M1 macrophages by integrating iNOS-nitric oxide and HIF-1α pathways in mice

Affiliations

MDM2 induces pro-inflammatory and glycolytic responses in M1 macrophages by integrating iNOS-nitric oxide and HIF-1α pathways in mice

Kelvin Ka-Lok Wu et al. Nat Commun. .

Abstract

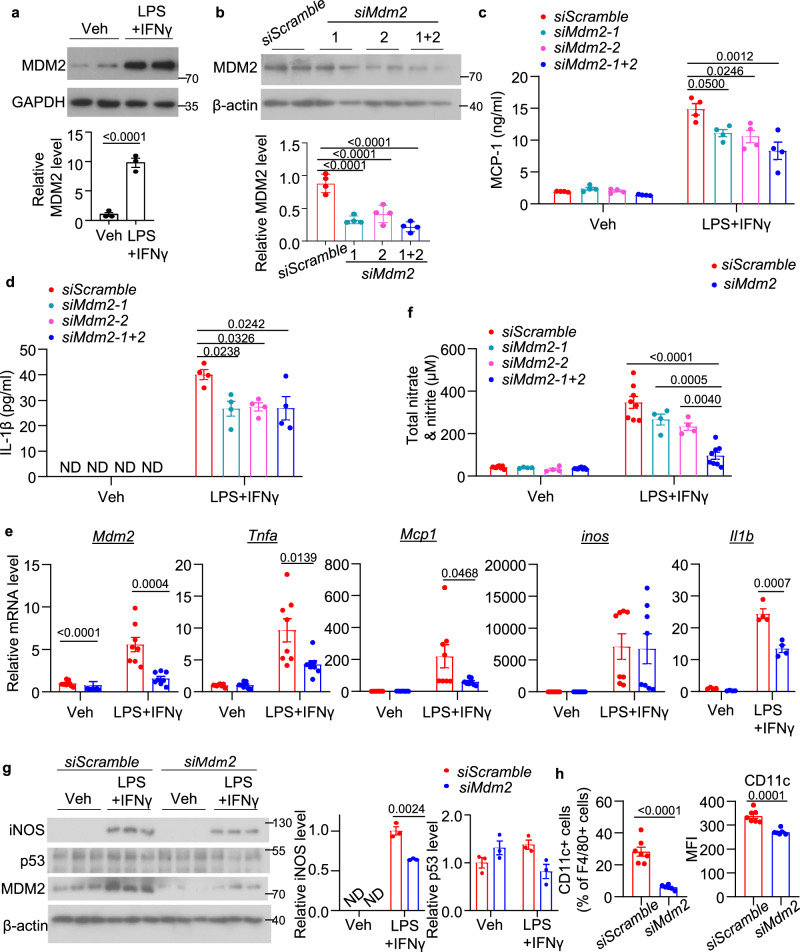
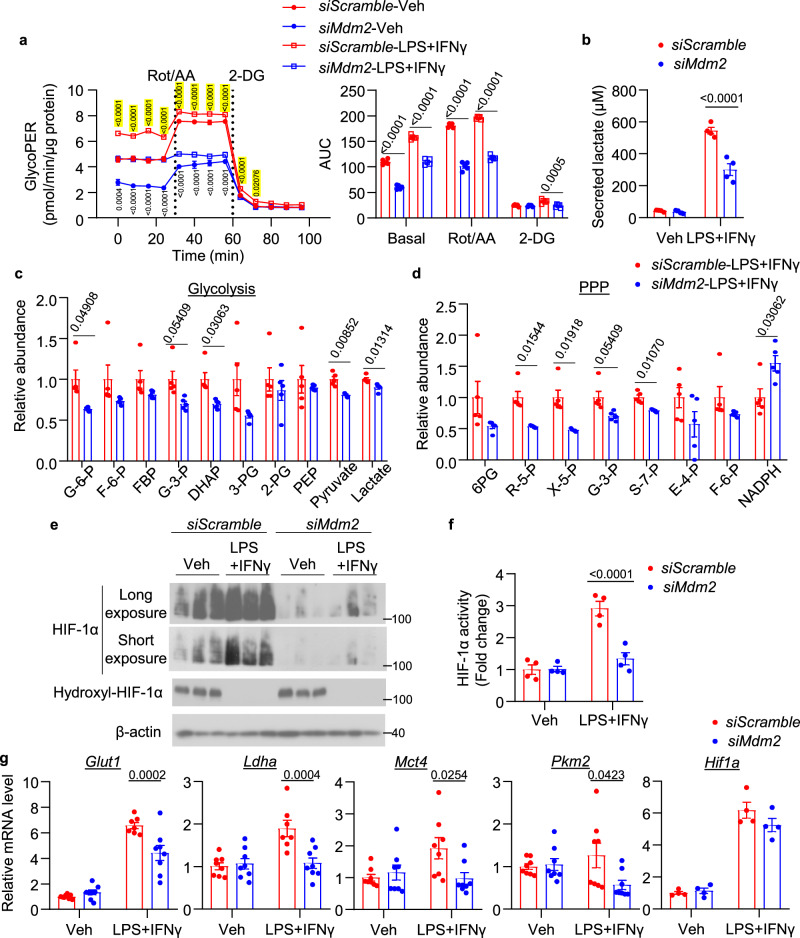
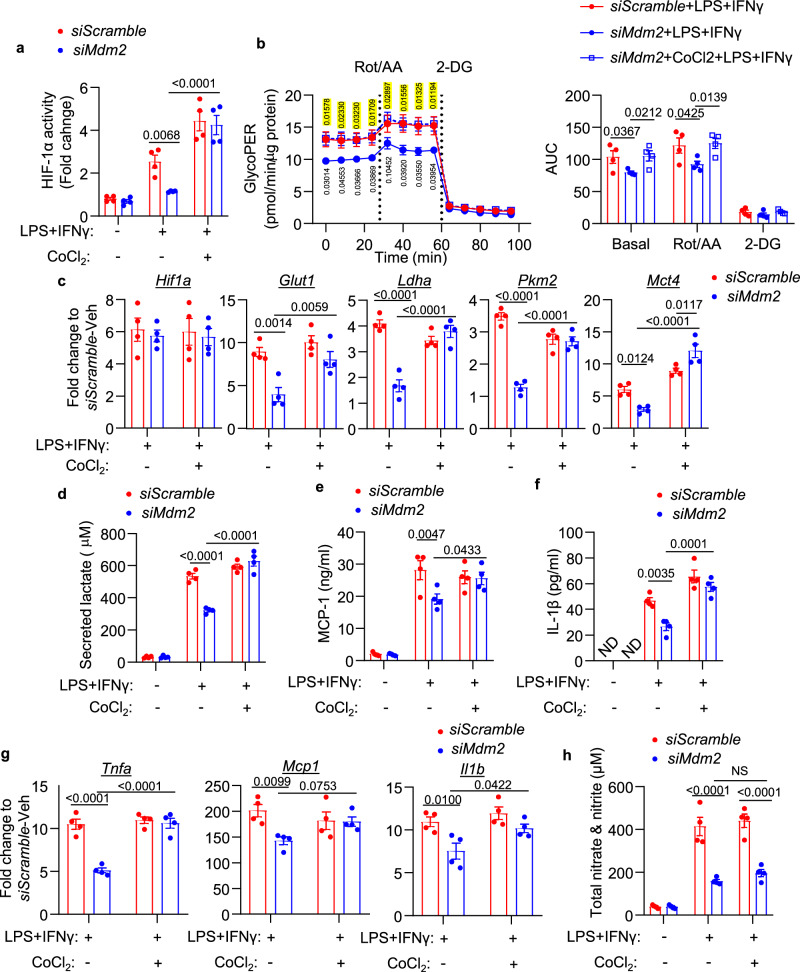
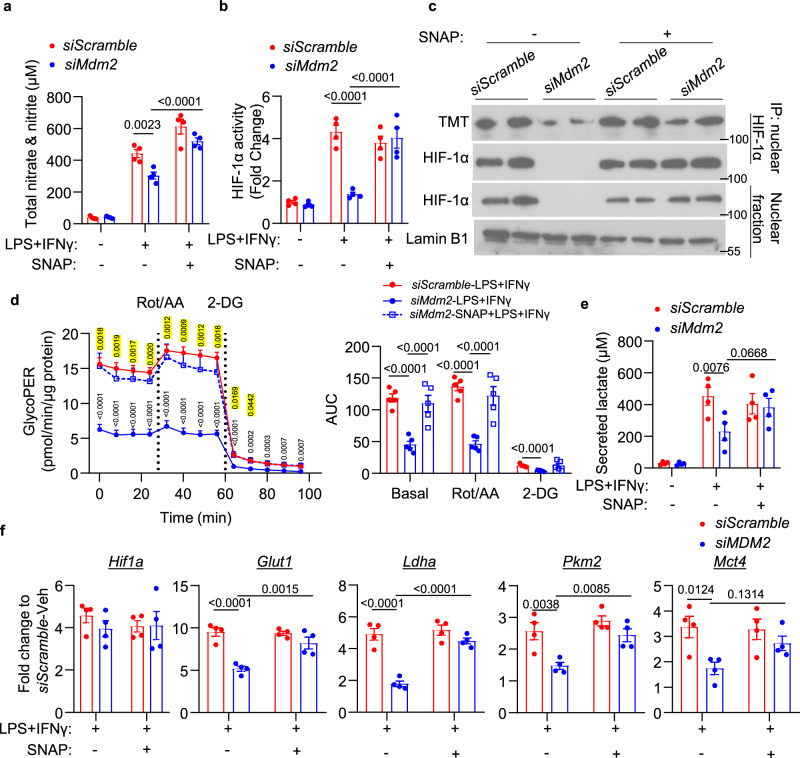
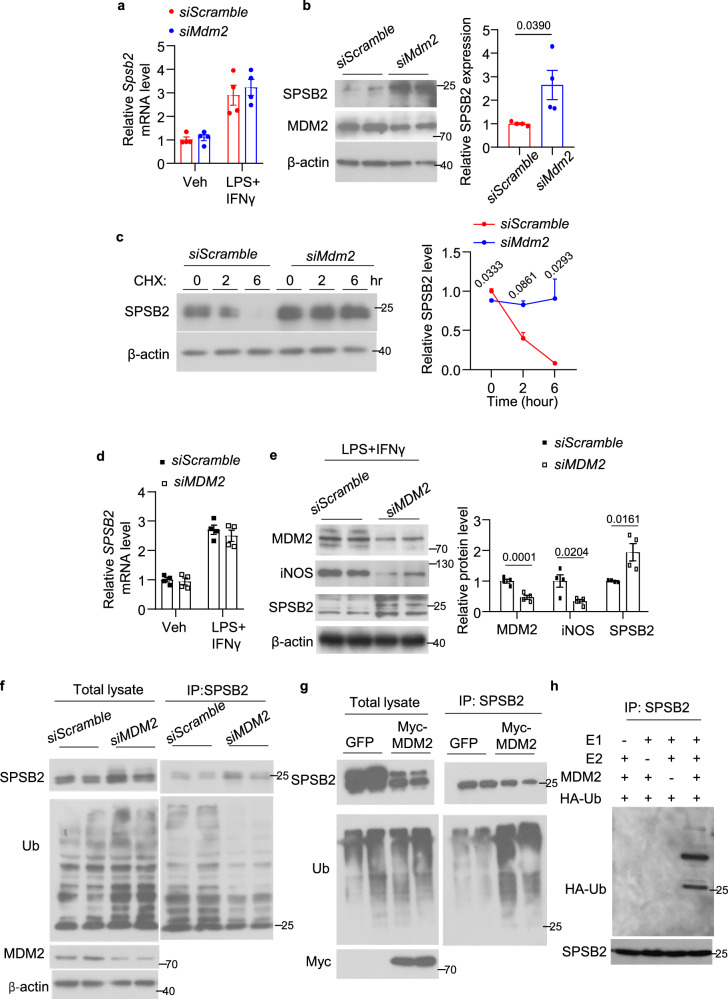
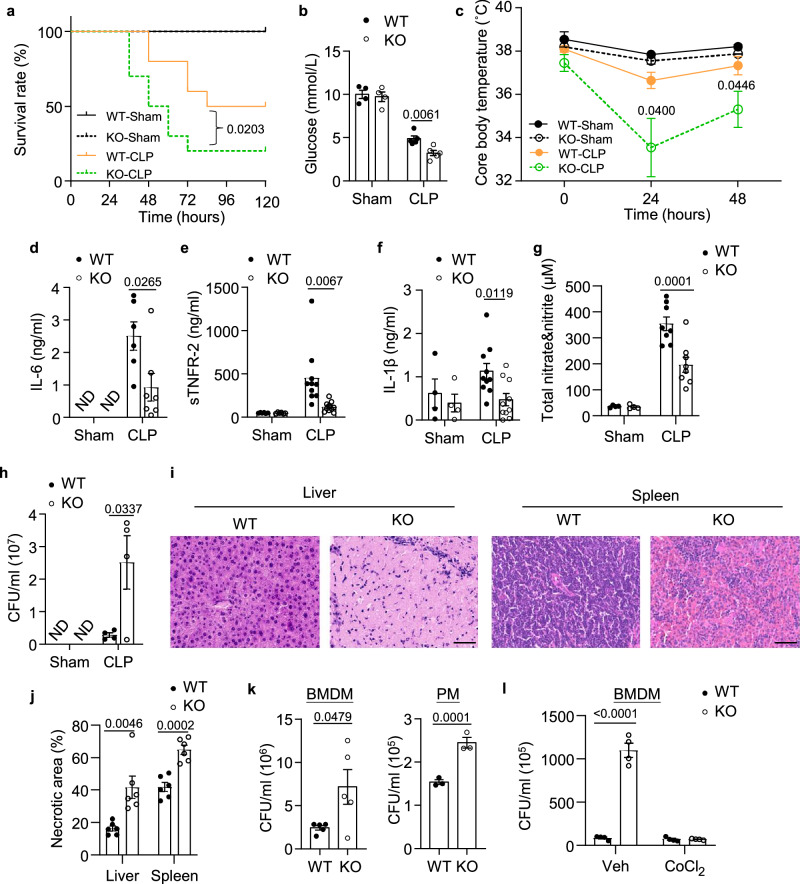
M1 macrophages induce protective immunity against infection, but also contribute to metabolic and inflammatory diseases. Here we show that the E3 ubiquitin ligase, MDM2, promotes the glycolytic and inflammatory activities of M1 macrophage by increasing the production of IL-1β, MCP-1 and nitric oxide (NO). Mechanistically, MDM2 triggers the ubiquitination and degradation of E3 ligase, SPSB2, to stabilize iNOS and increases production of NO, which s-nitrosylates and activates HIF-1α for triggering the glycolytic and pro-inflammatory programs in M1 macrophages. Myeloid-specific haplodeletion of MDM2 in mice not only blunts LPS-induced endotoxemia and NO production, but also alleviates obesity-induced adipose tissue-resident macrophage inflammation. By contrast, MDM2 haplodeletion induces higher mortality, tissue damage and bacterial burden, and also suppresses M1 macrophage response, in the cecal ligation and puncture-induced sepsis mouse model. Our findings thus identify MDM2 as an activator of glycolytic and inflammatory responses in M1 macrophages by connecting the iNOS-NO and HIF-1α pathways.


Conflict of interest statement

The authors declare no competing interests.

Figures

Fig. 1
Fig. 1. siRNA-mediated silencing of Mdm2 diminishes M1 polarization in BMDM.
a Immunoblotting analysis of MDM2 and GAPDH in the primary mouse peritoneal macrophages upon LPS and IFNγ or vehicle (Veh) treatment for 20 h. The lower panel is the densitometric analysis for relative abundance of MDM2 normalized with GAPDH. n = 3. (b-f) Bone marrow-derived macrophages (BMDM) were transfected with siRNA against Mdm2 (siMdm2) or scramble (siScramble) control, followed by LPS and IFNγ stimulation for 20 h. b Immunoblotting analysis of MDM2 and β-actin in the transfected BMDM. The lower panel is the densitometric analysis for relative abundance of MDM2 normalized with β-actin. n = 4. c MCP-1 and d IL-1β levels in cell culture supernatant. n = 4. e QPCR analysis of the genes related to M1 macrophage polarization in the BMDM as indicated. n = 8. f Total nitrate & nitrite in culture medium. n = 4 for siMdm2-1 and siMdm2-2. n = 8 for siScramble and siMdm2-1 + 2. g Immunoblotting analysis of iNOS, MDM2, p53 and β-actin in the BMDM. The right panel is the densitometric analysis of iNOS and p53 normalized with β-actin. n = 3. h Flow cytometry analysis of F4/80 and CD11c-double positive cells. The right panel is the mean fluorescence intensity. siScramble: n = 7, siMdm2: n = 6. Data are displayed as mean ± SEM. Statistical significance was examined using one-way ANOVA with Tukey post-hoc test. N number represents the number of biological replicates. ND Not detected.
Fig. 2
Fig. 2. Knockdown of MDM2 expression dampens glycolysis and HIF-1α activation in mouse M1 macrophages.
BMDM were transfected with siMdm2 or siScramble, followed by with LPS and IFNγ for 20 h. a Glycolytic stress test was performed using Seahorse XF analyzer. Rotenone/Antimycin A (Rot/AA) and 2-deoxyglucose (2-DG) were added to inhibit mitochondrial functions and glycolysis respectively. Glycolytic proton efflux rate (GlycoPER) was measured at the basal condition and during the treatments as indicated. n = 4. P values of siScramble-LPS + IFNγ vs siMdm2-LPS + IFNγ are above the curve and highlighted in yellow while siScramble-veh vs siMdm2-veh are below the curve. b Lactate level in the conditioned medium. n = 4 biological replicates. c, d Relative abundance of metabolites in (c) glycolysis and (d) pentose phosphate pathway determined by UPLC-MS/MS. n = 5. e Immunoblotting analysis of HIF-1α, hydroxyl-HIF-1α and β-actin. n = 3. f HIF-1α transcriptional activity in the nuclear fraction of the BMDM. n = 4. g QPCR analysis of the glycolytic genes normalized with β-actin. n = 8 for Glut1, Ldha, Mct4 and Pkm2. n = 4 for Hif1a. Data are displayed as mean ± SEM. Statistical significance was examined using one-way ANOVA with Tukey post-hoc test. N number represents the number of biological replicates.
Fig. 3
Fig. 3. MDM2 silencing inhibits glycolysis and inflammatory response in M1 macrophages via suppression of HIF-1α activation.
af BMDM were transfected with siMdm2 or siScramble, followed by stimulation with LPS and IFNγ in the presence or absence of CoCl2 for 20 h. a Nuclear HIF-1α transcription activity. n = 4. b Glycolytic proton efflux rate (GlycoPER) measured by Seahorse XF analyzer as described in Fig. 2. n = 4. P values of siScramble-LPS + IFNγ vs siMdm2-LPS + IFNγ are under the curves while siMdm2-LPS + IFNγ vs siMdm2-CoCl2+LPS + IFNγ are above and highlighted in yellow. c QPCR analysis of the glycolytic genes normalized with β-actin. n = 4. d Lactate, e MCP-1 and f IL-1β in the cell culture supernatant. n = 4. g QPCR analysis of the pro-inflammatory genes normalized with β-actin. n = 4. h Total nitrate and nitrite in the cell culture supernatant. n = 4. Data are displayed as mean ± SEM. Statistical significance was examined using one-way ANOVA with Tukey post-hoc test. N number represents the number of biological replicates. ND Not detected, NS Not significant.
Fig. 4
Fig. 4. Replenishment of NO rescues the defective HIF-1α activation and its related glycolysis in MDM2 knockdown macrophages.
Mouse BMDM were transfected with siMdm2 or siScramble for 24 h, then stimulated with LPS and IFNγ for 20 h, followed by treatment with NO donor S-Nitroso-N-acetylpenicillamine (SNAP) or DMSO for 3 h. a Total nitrate and nitrite in the cell culture medium. n = 4. b Nuclear HIF-1α transcriptional activity in the BMDM. n = 4. c The treated cells were subjected to S-nitrosylation assay, followed by immunoprecipitation (IP) of HIF-1α. Immunoblotting analysis of HIF-1α in the nuclear extract and S-nitrosylated HIF-1α (labeled by iodoTMT Reagent) was performed using an HIF-1α antibody and anti-TMT antibody respectively. Lamin B1 is a nuclear protein and used as loading control. d GlycoPER was measured using Seahorse XF analyzer. The right panel is the area under curve (AUC). n = 5. P values of siScramble-LPS + IFNγ vs siMdm2-LPS + IFNγ are under the curve while siMdm2-LPS + IFNγ vs siMdm2-SNAP + LPS + IFNγ is above and highlighted in yellow. e Lactate in the cell culture supernatant. n = 4. f Relative mRNA levels of glycolytic genes normalized with β-actin and expressed as fold change over siScramble-LPS + IFNγ. n = 4. Data are displayed as mean ± SEM. Statistical significance was examined using one-way ANOVA with Tukey post-hoc test. N number represents the number of biological replicates. Representative immunoblot images are shown from at least two independent experiments.
Fig. 5
Fig. 5. MDM2 silencing reduces SPSB2 ubiquitination and increases its protein expression in macrophages.
ac Mouse BMDM were transfected with siMdm2 or siScramble for 24 h and stimulated with LPS + IFNγ stimulation for 20 h. a QPCR analysis of Spsb2 mRNA expression and normalized with β-actin. n = 4. b Immunoblotting of SPSB2 and β-actin and quantification of SPSB2 normalized with β-actin. n = 4. c The transfected BMDM were treated with CHX for indicated time points, followed by immunoblotting analysis of SPSB2 and β-actin. n = 3. The right panel is the densitometric analysis of SPSB2 level. d, e THP-1 macrophages were transfected with siMDM2 or siScramble for 24 h and then stimulated with LPS + IFNγ stimulation for 24 h. n = 3. d QPCR analysis of SPSB2 mRNA expression and normalized with β-ACTIN. n = 4. e Immunoblotting of iNOS, MDM2, SPSB2 and β-actin. The right panel is the quantification of SPSB2 normalized with β-actin. n = 4. f THP-1 macrophages were transfected with siMDM2 or siScramble for 48 h, followed by IP of SPSB2 and immunoblotting analysis of MDM2, SPSB2, Ub and β-actin. n = 3. g THP-1 macrophages were transfected with plasmid expressing Myc-tagged MDM2 for 48 h, followed by IP of SPSB2 and immunoblotting analysis of SPSB2, Ub and Myc. n = 3. h In vitro ubiquitination of SPSB2. The recombinant E1 and E2 enzymes, MDM2, HA‐tagged Ub proteins, and native SPSB2 protein were added to the ubiquitination reaction mix, followed by IP of SPSB2 and immunoblotting analysis as indicated. n = 4. Representative immunoblot images are shown from at least two independent experiments. Data are displayed as mean ± SEM. N number represents the number of biological replicates.
Fig. 6
Fig. 6. Silencing of SPSB2 reverses defective iNOS-NO expression and HIF-1α-dependent glycolysis and inflammatory response in MDM2 knockdown macrophages.
Mouse BMDM were transfected with siMdm2, siSpsb2 and/or siScramble as indicated for 24 h, followed by stimulation with LPS + IFNγ for 24 h. a QPCR analysis of Mdm2 and Spsb2 mRNA expression normalized with β-actin. n = 4. b Immunoblotting analysis of iNOS, MDM2 SPSB2 and nuclear HIF-1α. c Total nitrate & nitrite level in the cell culture supernatant. n = 4. d Nuclear HIF-1α transcriptional activity. n = 4. e Detection of nuclear HIF-1α and s-nitrosylated HIF-1α by immunoblotting as described in Fig. 4c. n = 3. f GlycoPER measured by Seahorse XF analyzer. n = 5. For the left panel, P values of siScramble-veh vs siMdm2-veh are under the curves while siMdm2-veh vs siMdm2+siSpsb2-veh are above and highlighted in yellow. For the right panel, P values of siScramble-LPS + IFNγ vs siMdm2-LPS + IFNγ are under the curves while siMdm2-LPS + IFNγ vs siMdm2+siSpsb2-LPS + IFNγ are above and highlighted in yellow. g Secreted lactate, h MCP-1 and i IL-1β levels in the cell culture supernatant. g, h n = 7. i: n = 4. Data are displayed as mean ± SEM. Statistical significance was examined using one-way ANOVA with Tukey post-hoc test. N number represents the number of biological replicates. ND Not detected. Representative immunoblot images are shown.
Fig. 7
Fig. 7. Ubiquitination of K81 and K195 in SPSB2 are required for the regulatory effects of MDM2 on iNOS-NO axis and HIF-1α activation in M1 THP-1 macrophages.
a S-KO-THP-1 and the Ctrl-THP-1 macrophages were transfected with the indicated plasmids, followed by immunoblotting analysis of SPSB2 and iNOS. n = 3. bg S-KO-THP-1 and the Ctrl-THP-1 macrophages were co-transfected with siMDM2 or siScramble and plasmids encoding wild-type SPSB2 (WT) or the K81R or K195R mutants of SPSB2, followed by stimulation with LPS and IFNγ for 24 h. n = 3. b Total nitrate & nitrite in the conditioned medium. n = 4. c HIF-1α transcriptional activity in the nuclear fraction of the cells. n = 4. d IL-1β and e lactate in the conditioned medium. n = 4. f, g QPCR analysis of pro-inflammatory genes (f) and glycolytic genes (g) normalized with β-ACTIN. The QPCR results were displayed as fold change over Ctrl-THP-1-siScramble-GFP. n = 4. Data are displayed as mean ± SEM. Statistical significance was examined using one-way ANOVA with Tukey post-hoc test. N number represents the number of biological replicates. Representative immunoblot images are shown.
Fig. 8
Fig. 8. The MDM2-SPSB2 interaction mediates iNOS-NO production and HIF-1α activation in M1 macrophages.
a THP-1 macrophages were treated with LPS and IFNγ for indicated time points, followed by IP using anti-MDM2 antibody and immunoblotting analysis as indicated. The chart shows the quantification of SPSB2 bound to MDM2. n = 3. b S-KO-THP-1 macrophages and Ctrl-THP-1 macrophages were transfected with plasmids expressing Myc-tagged MDM2 and FLAG-tagged SPSB2 (WT), SPSB2 (L19/Y20/L23, referred as Triple-1) or SPSB2 (L199/Y200/V203, referred as Triple-2), followed by immunoprecipitation using anti-Myc antibody and immunoblotting analysis as indicated. c S-KO-THP-1 and Ctrl-THP-1 macrophages transfected with indicated plasmids were subjected to immunoblotting analysis of SPSB2 and β-actin. dg S-KO-THP-1 and Ctrl-THP-1 macrophages were co-transfected with indicated siRNA and plasmids for 48 h, followed by LPS + IFNγ stimulation for 24 h. n = 4. d Total nitrate & nitrite in the conditioned medium. n = 4. e IL-1β, f HIF-1α transcriptional activity and g secreted lactate. n = 4. Data are displayed as mean ± SEM. Statistical significance was examined using one-way ANOVA with Tukey post-hoc test. N number represents the number of biological replicates. Representative images were shown from at least two independent experiments.
Fig. 9
Fig. 9. Mye-MDM2KO mice are more susceptible to polymicrobial infection.
aj Cecal ligation and puncture (CLP) or sham operation were performed on Mye-MDM2KO mice and their WT controls. a Mortality of mice was monitored for 120 h after the CLP procedure. Survival rates were compared using logrank test for trend. Sham: n = 5, CLP: n = 15. b Blood glucose of the mice was measured at 24 h post-surgery. n = 4 for WT- and KO-Sham. n = 5 for WT- and KO-CLP. c Core body temperature was measured at indicated time points. n = 4 for WT- and KO-Sham. n = 10 for WT- and KO-CLP. Circulating (d) IL-6, (e) sTNFR-2, (f) IL-1β, and (g) total nitrate & nitrite in the mice. n = 410. h Peritoneal lavage fluid was collected at 24 h post-surgery, followed by bacterial culture at 37 °C overnight. Colony-forming units (CFU) of bacteria were counted. n = 4. i H&E staining of the liver and spleen collected in the CLP-operated animals. Scale bar: 50 µm. j Quantification of the necrotic area. n = 5. k, l BMDM or peritoneal macrophage (PM) isolated from Mye-MDM2KO mice or WT controls were incubated with 5 × 10⁶ E. coli for 3 h in the presence or absence of the HIF-1α activator CoCl2, followed by bacterial culture on the agar plate overnight. CFU on the plate were counted and presented. n = 3 for PM. n = 5 for BMDM. Data are displayed as mean ± SEM. N number represents the number of biological replicates. Statistical significance was examined using one-way ANOVA with Tukey post-hoc test. ND Not detected.
Fig. 10
Fig. 10. Myeloid-specific haplodeletion of MDM2 alleviates dietary-induced glucose dysregulation and adipose tissue inflammation in mice.
10-week-old male Mye-MDM2KO mice and their WT littermates were fed with high-fat diet (HFD) for 16 weeks. a Glucose tolerance test at 16-week-old. n = 6. b Insulin tolerance test at 18-week-old. n = 6. c H&E staining of epididymal white adipose tissue (eWAT). The arrows indicate immune cell infiltration. d Average adipocyte size and (e) total crown-like structure (CLS) area in the eWAT. n = 9 for (d). n = 11 for (e). f Picro Sirius Red staining of the eWAT. The right panel shows the average fibrotic area. n = 5 for WT. n = 6 for KO. g Circulating level of MCP1. n = 5. h MCP-1 level in the eWAT. n = 6. i Immunofluorescence staining of F4/80 and iNOS in the eWAT. The right panel is the quantification of F4/80+ and iNOS+ cells. n = 5. j QPCR analysis of genes related to inflammation and fibrosis in the eWAT. The gene expressions are normalized with β-actin and expressed as fold change over WT control. n = 6. k Immunofluorescence staining of F4/80 and HIF-1α in the eWAT. The right panel is the quantification of HIF-1α intensity in F4/80+ cells. Scale bar: 100 µm. Representative images were shown. n = 50. Data are displayed as mean ± SEM. Statistical significance was tested using an independent two-tailed student’s t-test. N number represents the number of biological replicates.

References

    1. Lian, Q. et al. Differential effects of macrophage subtypes on SARS-CoV-2 infection in a human pluripotent stem cell-derived model. Nat. Commun.13, 2028 (2022). - PMC - PubMed
    1. Benoit, M., Desnues, B. & Mege, J. L. Macrophage polarization in bacterial infections. J. Immunol.181, 3733–3739 (2008). - PubMed
    1. Shapouri-Moghaddam, A. et al. Macrophage plasticity, polarization, and function in health and disease. J. Cell Physiol.233, 6425–6440 (2018). - PubMed
    1. McGettrick, A. F. & O’Neill, L. A. J. The role of HIF in immunity and inflammation. Cell Metab.32, 524–536 (2020). - PubMed
    1. Wang, T. et al. HIF1alpha-induced glycolysis metabolism is essential to the activation of inflammatory macrophages. Mediators Inflamm.2017, 9029327 (2017). - PMC - PubMed

Publication types

MeSH terms

Associated data