Deciphering the prognostic and therapeutic significance of BAG1 and BAG2 for predicting distinct survival outcome and effects on liposarcoma
- PMID: 39366981
- PMCID: PMC11452671
- DOI: 10.1038/s41598-024-67659-6
Deciphering the prognostic and therapeutic significance of BAG1 and BAG2 for predicting distinct survival outcome and effects on liposarcoma
Abstract
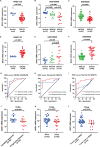
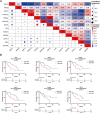
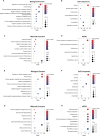
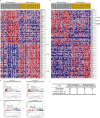
Liposarcoma (LPS) is the second most common kind of soft tissue sarcoma, and a heterogeneous malignant tumor derived from adipose tissue. Up to now, the prognostic value of BAG1 or BAG2 in LPS has not been defined yet. Expression profiling data of LPS patients were collected from TCGA and GEO database. Survival curves were plotted to verify the outcome differences of patients based on BAG1 or BAG2 expression. Univariate and multivariate Cox regression models were used to analyze the prognostic ability of BAG1 or BAG2. Chaperone's regulators BAG1 and BAG2 were identified as prognostic biomarkers for LPS patients, which exhibited distinct expression patterns and survival outcome prediction performances. Patients with high BAG2 expression and/or low BAG1 expression had worse prognosis. Enrichment analysis showed that BAG1 was involved in negative regulation of TGF-β signaling. Low expression of BAG1 was associated with high abundance of regulatory T cells (Tregs). The 2-gene signature model further confirmed the improved risk assessment performance of BAG1 and BAG2: high risk patients displayed poor prognosis. BAG1 and BAG2 are supposed to be potential prognostic biomarkers for LPS and have impacts on liposarcomagenesis and immune infiltration in distinctive manners, which may function as potential therapy targets (BAG1 agonists/BAG2 inhibitors) for LPS.
Keywords: BAG1; BAG2; Gene signature; Immune infiltration; Liposarcoma; Prognostic biomarker.
© 2024. The Author(s).
Conflict of interest statement
The authors declare no competing interests.
Figures


Similar articles
-
Comprehensive Analysis of a Six-Gene Signature Predicting Survival and Immune Infiltration of Liposarcoma Patients and Deciphering Its Therapeutic Significance.Int J Mol Sci. 2024 Jul 16;25(14):7792. doi: 10.3390/ijms25147792. Int J Mol Sci. 2024. PMID: 39063036 Free PMC article.
-
Comparative analysis of BAG1 and BAG2: Insights into their structures, functions and implications in disease pathogenesis.Int Immunopharmacol. 2024 Dec 25;143(Pt 1):113369. doi: 10.1016/j.intimp.2024.113369. Epub 2024 Oct 14. Int Immunopharmacol. 2024. PMID: 39405938 Review.
-
Expression of BAG1 is associated with prognosis in kidney renal clear cell carcinoma based on bioinformatics.BMC Cancer. 2021 Feb 13;21(1):160. doi: 10.1186/s12885-021-07874-w. BMC Cancer. 2021. PMID: 33581726 Free PMC article.
-
Deciphering the Prognostic and Therapeutic Significance of Cell Cycle Regulator CENPF: A Potential Biomarker of Prognosis and Immune Microenvironment for Patients with Liposarcoma.Int J Mol Sci. 2023 Apr 10;24(8):7010. doi: 10.3390/ijms24087010. Int J Mol Sci. 2023. PMID: 37108172 Free PMC article.
-
The emerging roles and therapeutic potential of microRNAs (miRs) in liposarcoma.Discov Med. 2015 Nov;20(111):311-24. Discov Med. 2015. PMID: 26645903 Review.
References
-
- Hung, G. Y. et al. Incidence of soft tissue sarcoma in Taiwan: A nationwide population-based study (2007–2013). Cancer Epidemiol.60, 185–192 (2019). - PubMed
-
- Nascimento, A. G. Dedifferentiated liposarcoma. Semin. Diagn. Pathol.18(4), 263–266 (2001). - PubMed
-
- Suarez-Kelly, L. P., Baldi, G. G. & Gronchi, A. Pharmacotherapy for liposarcoma: current state of the art and emerging systemic treatments. Expert Opin. Pharmacother.20(12), 1503–1515 (2019). - PubMed
-
- Gahvari, Z. & Parkes, A. Dedifferentiated liposarcoma: Systemic therapy options. Curr. Treat. Opt. Oncol21(2), 15 (2020). - PubMed
MeSH terms
Substances
Grants and funding
- No.212102310616/the Program for Science and Technology Development in Henan Province
- No.XJ2024125/the Innovation Project for College Students of Henan University
- XJ2024127/the Innovation Project for College Students of Henan University
- XJ2024342/the Innovation Project for College Students of Henan University
LinkOut - more resources
Full Text Sources

