. 2024 Oct 5;15(1):8641.
doi: 10.1038/s41467-024-52984-1.

Pre-ciliated tubal epithelial cells are prone to initiation of high-grade serous ovarian carcinoma

Affiliations

Pre-ciliated tubal epithelial cells are prone to initiation of high-grade serous ovarian carcinoma

Andrea Flesken-Nikitin et al. Nat Commun. .

Erratum in

Abstract

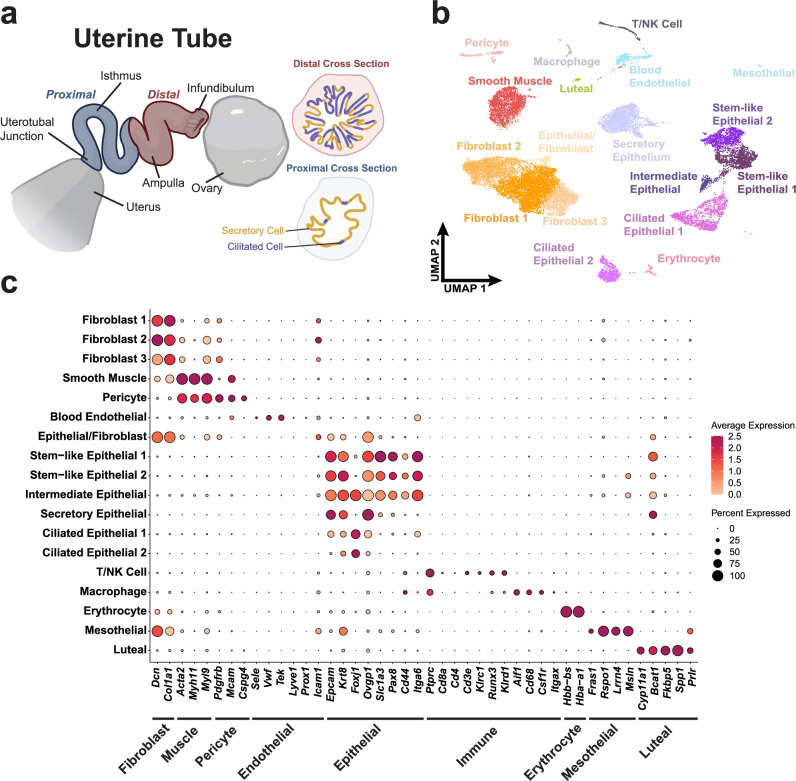
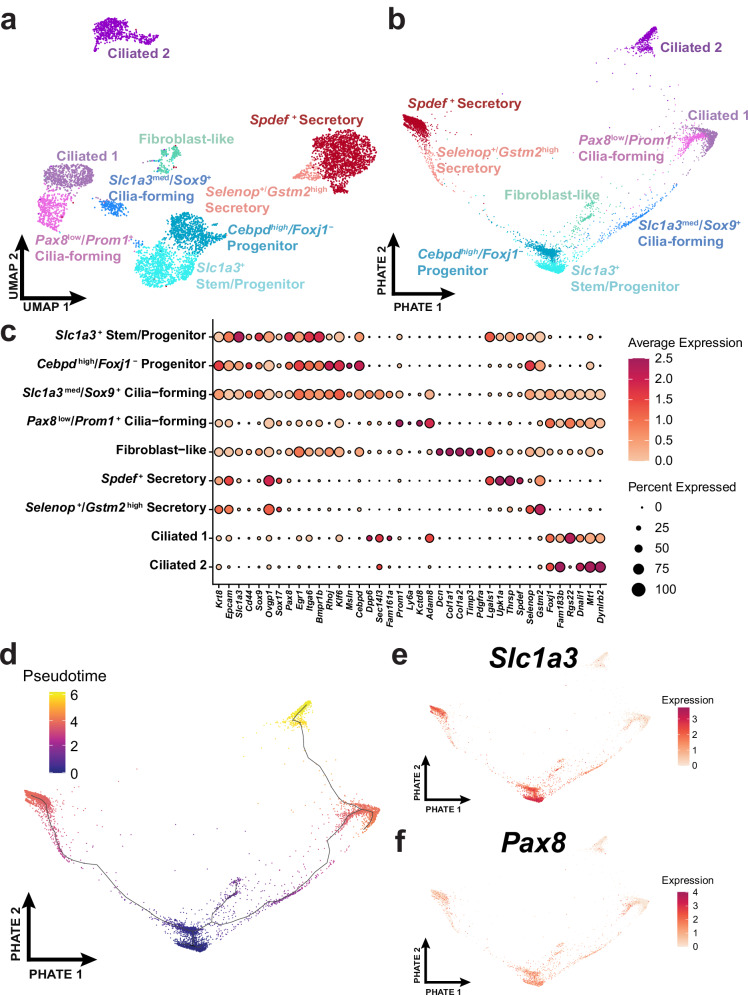
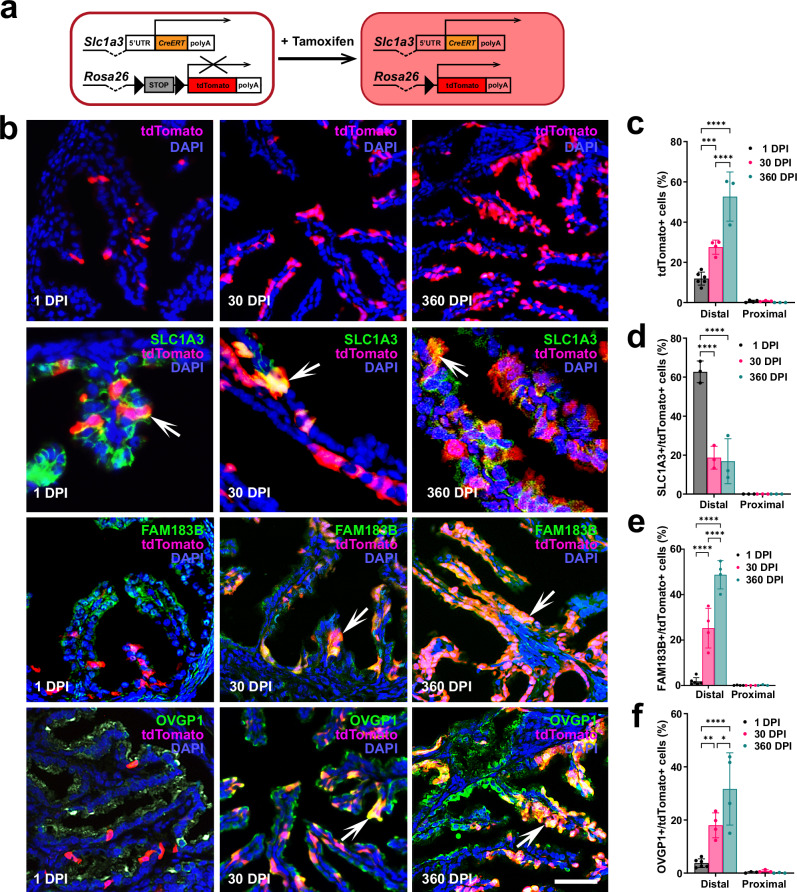
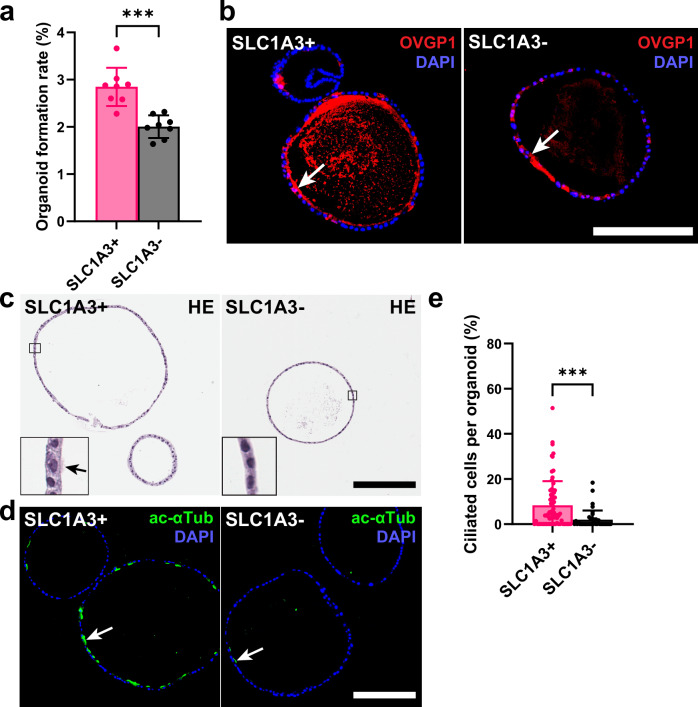
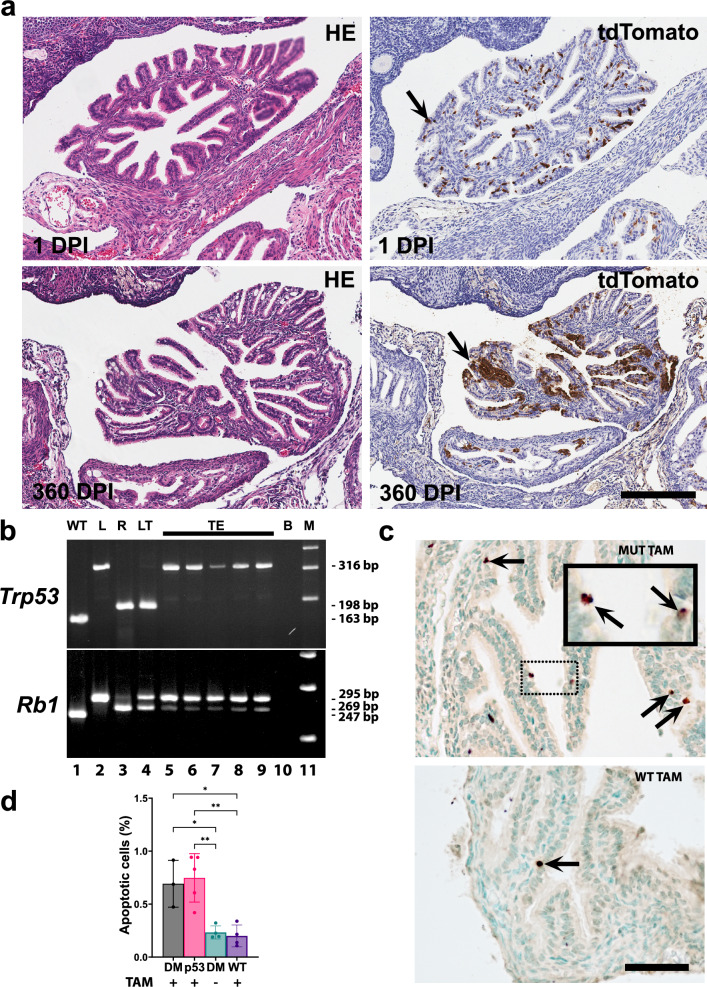
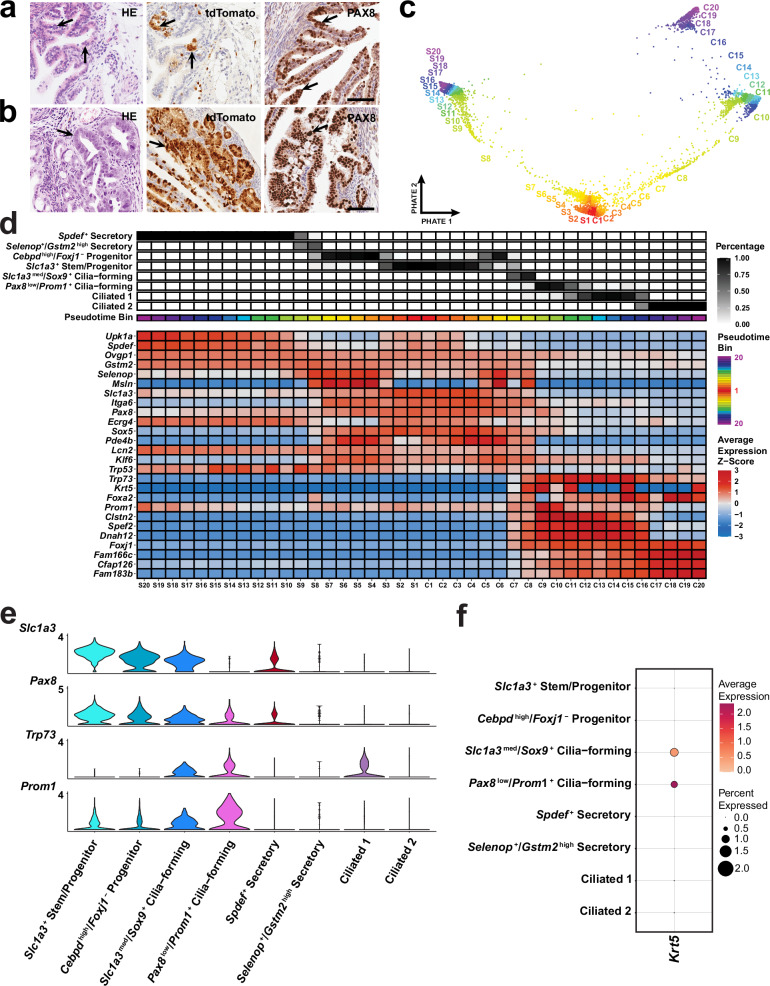
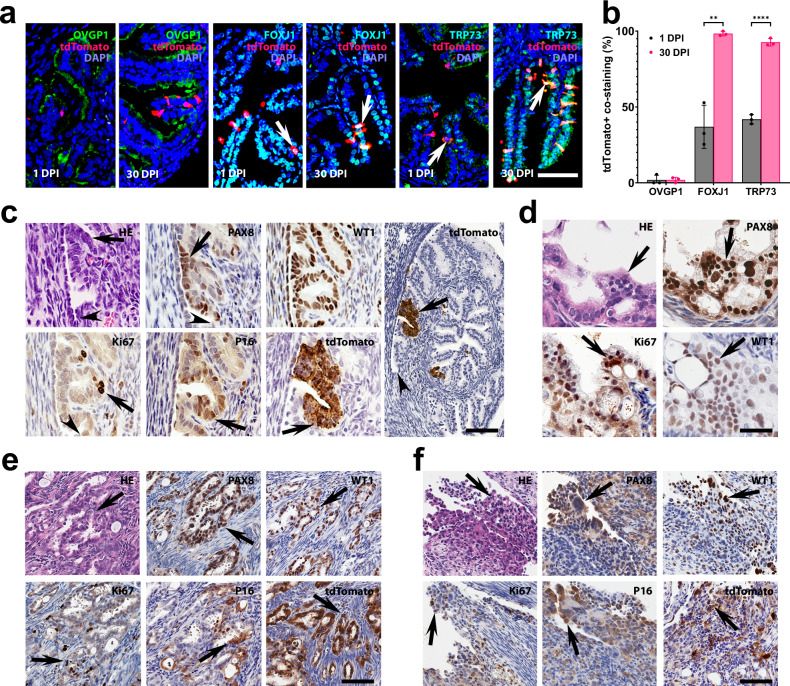
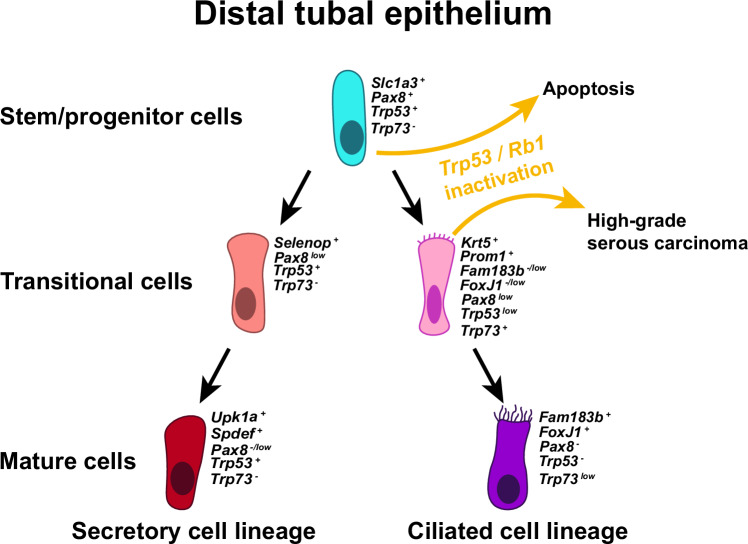
The distal region of the uterine (Fallopian) tube is commonly associated with high-grade serous carcinoma (HGSC), the predominant and most aggressive form of ovarian or extra-uterine cancer. Specific cell states and lineage dynamics of the adult tubal epithelium (TE) remain insufficiently understood, hindering efforts to determine the cell of origin for HGSC. Here, we report a comprehensive census of cell types and states of the mouse uterine tube. We show that distal TE cells expressing the stem/progenitor cell marker Slc1a3 can differentiate into both secretory (Ovgp1+) and ciliated (Fam183b+) cells. Inactivation of Trp53 and Rb1, whose pathways are commonly altered in HGSC, leads to elimination of targeted Slc1a3+ cells by apoptosis, thereby preventing their malignant transformation. In contrast, pre-ciliated cells (Krt5+, Prom1+, Trp73+) remain cancer-prone and give rise to serous tubal intraepithelial carcinomas and overt HGSC. These findings identify transitional pre-ciliated cells as a cancer-prone cell state and point to pre-ciliation mechanisms as diagnostic and therapeutic targets.


Conflict of interest statement

The authors declare no competing interests.

Figures

Fig. 1
Fig. 1. Census of cell types of the mouse uterine tube.
a Diagram of a partially uncoiled mouse uterine tube. The proximal region contains few ciliated cells and extends from the intratubal junction to the ampulla. The distal region consists of the ampulla and the infundibulum where ciliated cells are abundant. b UMAP visualization of the cell types identified in a pool of 16,583 distal cells from 62 uterine tubes from which high quality sequence data was obtained. c Dot plot representation of genes associated with various tissue types to validate cell type identification. Source data are provided as a Source Data file. a was in part created with BioRender.com released under a Creative Commons Attribution-NonCommercial-NoDerivs license.
Fig. 2
Fig. 2. Characterization of distal epithelial cell states.
a Distal epithelial cells (n = 6273) from 62 uterine tubes were identified by their Epcam and Krt8 expression and the subset was represented within the UMAP embedding. b A differentiation trajectory among epithelial cells visualized through the PHATE dimensional reduction technique. c Dot plot reflecting highly expressed, specific markers of each identified epithelial cell cluster. d Monocle3 pseudotime analyses calculated over the PHATE embedding. The expression of Slc1a3 (e) and Pax8 (f) visualized over the PHATE embedding. Source data are provided as a Source Data file.
Fig. 3
Fig. 3. Lineage tracing of Slc1a3+ stem/progenitor cells.
a Experimental design. Mice containing Slc1a3-CreERT and Ai9 reporter are injected with tamoxifen to induce expression of modified red fluorescent protein (tdTomato) in cells expressing Slc1a3. b Top row, tdTomato expression (red) 1, 30, and 360 days post induction (DPI) with tamoxifen. Lower rows, tdTomato+ progeny of Slc1a3+ cells express differentiation markers for stem (SLC1A3, orange, arrows), ciliated (FAM183B, orange, arrows), and secretory (OVGP1, orange, arrows) cells. Counterstaining with DAPI (blue). Scale bar represents 50 μm (tdTomato, FAM1A3/tdTomato, OVGP1/tdTomato rows), and 25 μm (SLC1A3/tdTomato row). c Quantification of cells expressing tdTomato in the distal and proximal regions of the uterine tube 1, 30, and 360 DPI. Quantification of cells expressing tdTomato with stem (SLC1A3, d), ciliated (FAM183B, e), or secretory (OVGP1, f) cells 1, 30, and 360 DPI. cf Two way ANOVA with the Tukey’s multiple comparison post hoc test for all distal regions. c ***P = 0.0003, ****P < 0.0001 (d) ****P < 0.0001 (e) ****P < 0.0001 (f) *P = 0.0146, **P = 0.0058, ****P < 0.0001. Data are presented as mean values ± SD. Biological replicates (mice, n): c Distal 1 DPI n = 6, 30 DPI n = 4, 360 DPI n = 3; Proximal 1 DPI n = 4, 30, and 360 DPI n = 3 each group. d Distal and Proximal n = 3 each group. e Distal 1 DPI n = 6, 30 DPI and 360 DPI n = 4 each group; Proximal 1 DPI n = 4, 30, and 360 DPI n = 3 each group. f Distal 1 DPI n = 6, 30, and 360 DPI n = 4 each group; Proximal n = 3, each group. Source data are provided as a Source Data file.
Fig. 4
Fig. 4. Organoid formation by SLC1A3+ and SLC1A3- cells.
a Organoid formation rate of distal tubal epithelial cells isolated for SLC1A3 expression by MACS (n = 8). b Organoid sections of day 14 SLC1A3+ and SLC1A3- cell derived organoids stained for secretory marker OVGP1 (red, arrows). Counterstaining with DAPI (blue). c Hematoxylin and Eosin (HE) staining of SLC1A3+ and SLC1A3- cell derived organoids after 14 days of culture. Arrow denotes cilia. d Representative images of ciliation (green, acetylated α-Tubulin) between SLC1A3+ and SLC1A3- cell derived organoids. Counterstaining with DAPI (blue). bd Scale bar all images 200 μm. e Quantification of ciliated cells between SLC1A3+ (n = 71) and SLC1A3- (n = 40) cell derived organoids. a, e ***P = 0.0002, ****P = 0.0005, two-tailed unpaired t-tests. Data are presented as mean values ± SD. Source data are provided as a Source Data file.
Fig. 5
Fig. 5. Slc1a3+ epithelial cells are not cancer-prone.
a tdTomato+ tubal epithelial cells in mice containing Slc1a3-CreERT with floxed Trp53 and Rb1 genes, and an Ai9 reporter 1 and 360 days post induction (DPI) with tamoxifen. Hematoxylin and Eosin (HE) staining (left column) and immunostaining for tdTomato (arrows, brown color), Elite ABC method, hematoxylin counterstaining (right column). Scale bar, all images 200 μm. b PCR analysis of Trp53 and Rb1 gene structure in the same samples of microdissected cells from the tubal epithelium (TE, lanes 5–9) and lung neoplasm (LT, lane 4) of Slc1a3-CreERT Trp53loxP/loxP Rb1loxP/loxP Ai9 mice collected 1 year after tamoxifen induction. Samples with known gene structure (wild-type, WT, lane 1, floxed gene, L, lane 2, and recombinant gene, R, lane 3). 316-, 198-, and 163-bp fragments are diagnostic for floxed, excised, and wild-type alleles of the Trp53 gene, respectively. 295-, 269, and 247-bp fragments are diagnostic for floxed, excised, and wild-type alleles of the Rb1 gene, respectively. B, blank control (lane 10), M, DNA marker (Lane 11). Representative of 5 microdissection-PCR experiments. c Apoptotic cells (arrows) in the tubal epithelium 1 day after tamoxifen induction of Cre-mediated inactivation of Trp53 and Rb1 in Slc1a3-CreERT Trp53loxP/loxP Rb1loxP/loxP Ai9 mice (MUT TAM) and littermates without Slc1a3-CreERT (WT TAM). Dot-line rectangle indicates respective location of cells shown in the inset in the top image. TUNEL assay, methyl green counterstaining. Scale bar, 50 μm and 21 µm, inset. d Quantification of apoptotic cells 1 day after administration of tamoxifen (TAM+) or vehicle (TAM-) in Slc1a3-CreERT Trp53loxP/loxP Rb1loxP/loxP Ai9 mice (DM), Slc1a3-CreERT Trp53loxP/loxP Ai9 mice (p53) or littermates without Slc1a3-CreERT (WT). d One way ANOVA with the Tukey’s multiple comparison post hoc test (DM TAM+ vs. DM TAM-) *P = 0.0192, (DM TAM+ vs. WT TAM+) *P = 0.0123, (p53 TAM+ vs. DM TAM-) **P = 0.0035, (p53 TAM+ vs. WT TAM+) **P = 0.0022. Data are presented as mean values ± SD. Biological replicates (mice, n): DM TAM+ n = 3, p53M TAM+ n = 5, DM TAM- n = 4, WT TAM+ n = 4. Source data are provided as a Source Data file.
Fig. 6
Fig. 6. Identification of cancer-prone cell states.
Early (a) and advanced (b) neoplastic lesions (arrows) in Pax8-rtTA Tre-Cre Trp53loxP/loxP Rb1loxP/loxP Ai9 mice. Hematoxylin and Eosin (HE) staining (left column) and immunostaining for tdTomato (middle column, brown color), and PAX8 (right column, brown color). Elite ABC method, hematoxylin counterstaining. a, b Scale bar, all images 60 µm. Biological replicates n = 6 (a) and n = 3 (b). c Pseudotime binning along the PHATE embedding to visualize how bins are assigned for 6,273 distal epithelial cells from 62 uterine tubes. d Inferred pseudotime trajectories of secretory and ciliated epithelial cell lineages. The lineages extend from S1 and C1 to S20 and C20 respectively, where S20 and C20 are presumed to be a more differentiated cell state. The percent abundance of each cell type contributing to each pseudotime bin is reflected in black. The average z-scored expression was calculated for each gene to identify genes that best represent smaller transitional states within each lineage. Each pseudotime bin is equally sized and consists of about 150 cells. e Log-normalized expression of Slc1a3, Pax8, Trp53 and Prom1 visualized in a violin plot of epithelial cell clusters. f Dot plot of Krt5 expression among epithelial cell populations. Source data are provided as a Source Data file.
Fig. 7
Fig. 7. Transitional pre-ciliated Krt5+ cells are highly susceptible to malignant transformation.
a Detection of ciliation FOXJ1 (green) and TRP73 (green) markers but not secretory marker OVGP1 (green) in Krt5+ (tdTomato) cells and their progeny (arrows) in the distal tubal epithelium 1 and 30 days post-induction (DPI) with tamoxifen in Krt5-CreERT Ai9 mice. b Quantification of Krt5+ cells co-expressing tdTomato with OVGP1, FOXJ1 or TRP73 1 and 30 DPI. **P = 0.0017, ****P < 0.0001, two-tailed unpaired t-tests. Data are presented as mean values ± SD. Biological replicates n = 3 in each group. Source data are provided as a Source Data file. cf Neoplastic lesions in Krt5-CreERT Trp53loxP/loxP Rb1loxP/loxP Ai9 mice. Early dysplastic lesions (arrows) with mild cellular atypia (c) and more pronounced atypical features, loss of cell polarity, and high proliferative index typical for STICs (d). Arrowheads in (c), TE-mesothelial junctions. Advanced neoplastic lesions (arrows) with stromal invasion (e) and peritoneal spreading (f, arrows). Hematoxylin and Eosin (HE) staining and immunostainings for PAX8, Wilms tumor 1 (WT1), Ki67, p16, and tdTomato (brown color) by Elite ABC method with hematoxylin counterstaining. Scale bar 50 µm (a, c, except for right image, and d) and 100 µm (c), right image, (e, f). Biological replicates n = 5 (c), n = 8 (d), n = 4 (e) and n = 3 (f).
Fig. 8
Fig. 8. Cell lineage hierarchy and cancer-prone cell state of the distal tubal epithelium.
The hierarchy begins with Slc1a3+ stem/progenitor cells giving rise to secretory and ciliated cell lineages. Slc1a3+ stem/progenitor cells undergo apoptosis after inactivation of Trp53 alone or together with Rb1, while inactivation of Trp53 and Rb1 in Krt5+ pre-ciliated transitional cells lead to high-grade serous carcinoma. Colors of epithelial cells resemble the colors used to label cells within UMAP embeddings (Fig. 2a).

Similar articles

Cited by

References

    1. Siegel, R. L., Giaquinto, A. N. & Jemal, A. Cancer statistics, 2024. CA Cancer J. Clin.74, 12–49 (2024). - PubMed
    1. Seidman, J. D., Ronnett, B. M., Shih Ie, M., Cho, K. R. & Kurman, R. J. in Blaustein’s Pathology of the Female Genital Tract (eds Kurman, R. J., Ellenson, L. H. & Ronnett, B. M.) 841–966 (Springer, 2019).
    1. Carlson, J. W., Gilks, C. B. & Soslow, R. A. Tumors of the Ovary and Fallopian Tube. Vol. 16 (American Registry of Pathology, 2023).
    1. Kurman, R. J. & Shih Ie, M. The origin and pathogenesis of epithelial ovarian cancer: a proposed unifying theory. Am. J. Surg. Pathol.34, 433–443 (2010). - PMC - PubMed
    1. Landen, C. N. Jr., Birrer, M. J. & Sood, A. K. Early events in the pathogenesis of epithelial ovarian cancer. J. Clin. Oncol.26, 995–1005 (2008). - PubMed

Publication types

MeSH terms

Substances