. 2024 Oct 4;15(1):8628.
doi: 10.1038/s41467-024-53038-2.

Distinctive CD39+CD9+ lung interstitial macrophages suppress IL-23/Th17-mediated neutrophilic asthma by inhibiting NETosis

Affiliations

Distinctive CD39+CD9+ lung interstitial macrophages suppress IL-23/Th17-mediated neutrophilic asthma by inhibiting NETosis

Seunghan Han et al. Nat Commun. .

Abstract

The IL-23-Th17 axis is responsible for neutrophilic inflammation in various inflammatory diseases. Here, we discover a potential pathway to inhibit neutrophilic asthma. In our neutrophil-dominant asthma (NDA) model, single-cell RNA-seq analysis identifies a subpopulation of CD39+CD9+ interstitial macrophages (IMs) suppressed by IL-23 in NDA conditions but increased by an IL-23 inhibitor αIL-23p19. Adoptively transferred CD39+CD9+ IMs suppress neutrophil extracellular trap formation (NETosis), a representative phenotype of NDA, and also Th17 cell activation and neutrophilic inflammation. CD39+CD9+ IMs first attach to neutrophils in a CD9-dependent manner, and then remove ATP near neutrophils that contribute to NETosis in a CD39-dependent manner. Transcriptomic data from asthmatic patients finally show decreased CD39+CD9+ IMs in severe asthma than mild/moderate asthma. Our results suggest that CD39+CD9+ IMs function as a potent negative regulator of neutrophilic inflammation by suppressing NETosis in the IL-23-Th17 axis and can thus serve as a potential therapeutic target for IL-23-Th17-mediated neutrophilic asthma.


Conflict of interest statement

The authors declare no competing interests

Figures

Fig. 1
Fig. 1. IL-23 inhibitor suppresses the development of Th17-mediated neutrophilic inflammation in NDA mice.
a Schematic diagram of allergen sensitization and challenge protocol. In the NDA mouse model, sensitization with PBS or OVA + LPS intranasally (i.n.) was followed by challenge with PBS or OVA (i.n.) at the indicated days. Isotype control, αIL-23p19, or dexamethasone (Dex), was treated at 1 hr before every challenge period. The inflammatory response was assessed at 48 hr after the last challenge. b Total cell, neutrophil, and eosinophil counts in BALF measured using flow (n = 8 mice per group). c RORγt+, T-bet+, and GATA3+ Th cell counts in CD4+ T cells (Live,Dump-FOXP3-CD44+CD4+TCRb+) measured using flow cytometry (n = 6 mice per group). d Levels of Th17 (IL-17), Th1 (IFN-γ), and Th2 (IL-13) cell-related cytokine in BALF (n = 8 mice per group). e Representative H&E staining of lung sections obtained from the indicated conditions. Scale bar = 100 μm. f Inflammatory scores quantified from H&E staining (PBS/PBS (n = 3), OVA + LPS/PBS (n = 3), OVA + LPS/OVA (n = 3), OVA + LPS/OVA + αIL-23p19 (n = 5), and OVA + LPS/OVA+Dex (n = 5)). g Representative PAS staining of lung sections obtained from the indicated conditions. Scale bar = 200 μm. h PAS-positive area quantified from PAS staining (n = 4 mice per group) (i)Penh values measured using whole body plethysmography (PBS/PBS (n = 8), OVA + LPS/PBS (n = 9), OVA + LPS/OVA (n = 8), OVA + LPS/OVA + αIL-23p19 (n = 5), and OVA + LPS/OVA+Dex (n = 8)). j Rrs values measured using an invasive ventilated lung resistance method (PBS/PBS (n = 3), OVA + LPS/PBS (n = 4), OVA + LPS/OVA (n = 5), OVA + LPS/OVA + αIL-23p19 (n = 4), and OVA + LPS/OVA + Dex (n = 5)). Data are shown as mean ± s.e.m. Significance was determined by one-way analysis of variance (ANOVA) with Tukey’s post hoc correction (bd, f, h) and two-way ANOVA with Sidak’s post hoc correction (i, j).
Fig. 2
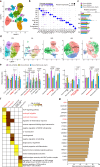
Fig. 2. Myeloid cell subpopulations expressing anti-inflammatory genes were increased by αIL-23p19 administration in NDA mouse lungs.
a Uniform manifold approximation and projection (UMAP) plot showing 11 clusters of CD45+ immune cells. b Dot plot showing relative expression of known marker genes of immune cells (x-axis) across all clusters (y-axis) (Supplementary Data 3). The color and diameter of the dots indicate the average expression of the indicated gene and the proportion of cells expressing the gene in each cluster, respectively. c Relative proportions of cells originated from three conditions in the five myeloid cell clusters. Proportions per cluster in each sample were normalized for their sum to be one. d UMAP plots showing subclusters of the indicated myeloid cell clusters. e Relative proportions of cells originated from three conditions in the subclusters of the indicated myeloid cell clusters. Red highlighted clusters with higher proportions of the cells in OVA + LPS/OVA + αIL-23p19 (P19) and OVA + LPS/PBS (PBS) than those in OVA + LPS/OVA (OVA). Proportions per cluster in each sample were normalized for their sum to be one. f Heat map showing gene ontology biological processes (GOBPs) enriched by marker genes for the five selected subclusters and their enrichment significance (p) from the DAVID software as –log10(p-value). Red labeled, GOBPs related to neutrophilic inflammation and subclusters in which those GOBPs are enriched. g Bar plot showing the mean percentage of cells expressing the indicated anti-inflammatory genes whose proteins are localized on the plasma membrane in TREM2high CM and Circulating NL. Red labeled, candidate genes associated with the inhibitory effects of αIL-23p19. (ag) n = 3 samples. Data are shown as mean ± s.e.m. Significance was determined by two-way ANOVA with Tukey’s post hoc correction (e).
Fig. 3
Fig. 3. Myeloid cell subpopulations identified by single-cell analyses were CD39+CD9+ IMs.
a Percentages of Ly6G+ neutrophils, b Ly6G-CD39+CD9+ IMs, and c Ly6G+CD39+CD9+ neutrophils in CD45+CD11b-CD11c- cells of lung under the indicated conditions. (ac, n = 10 per group). d Estimated fractions of CM subclusters in CD39+CD9+ IMs (n = 3 per group). In the box plots, the center line indicates the median value, the box limits indicate the upper and lower quartiles and the whiskers indicate the minimum and maximum. e Percentages of mononuclear (MN) and polymorphonuclear (PMN) cells in CD39+CD9+ IMs (blue bars) or Ly6G+ neutrophils (red bars) measured by Wright–Giemsa staining (right) (n = 10 per group). Representative staining images are shown (left). f Histograms of F4/80 and MHCII expression levels of CD39+CD9+ IMs (blue) or CD39-CD9- monocytes (gray). g Percentage of IL10+CD39+CD9+ IMs in the lung. h Level of IL-10 in BALF (g, h; OVA + LPS/PBS (n = 4), OVA + LPS/OVA (n = 5), and OVA + LPS/OVA + αIL-23p19 (n = 5)). i Representative images of immunostaining for PI (red), Annexin V-FITC (green), and T-PMT (light). Scale bar = 20 μm. j Percentage of CD39+CD9+ IMs (n = 36 per group), or CD39-CD9- monocytes (n = 15 per group) undergoing late apoptosis (Annexin V+/PI+) in field of view (FOV). k flow cytometry plot of Annexin V and PI. Data are shown as mean ± s.e.m. Significance was determined by using one-way ANOVA with Tukey’s multiple comparison tests (ad, g, h, j).
Fig. 4
Fig. 4. CD39 and CD9 are responsible for αIL-23p19-dependent suppression of Th17 cell activation and neutrophilic inflammation in NDA mice.
a Percentages of CD39+CD9+ IMs and (b) Ly6G+ neutrophils in CD45+CD11b-CD11c- cells of lung (n = 7 per group). c Total cell, (d) neutrophil counts in 7 groups: (i) OVA + LPS/PBS (n = 6), (ii) OVA + LPS/OVA (n = 6), (iii) OVA + LPS/OVA + POM1 (n = 6), (iv) OVA + LPS/OVA + αCD9 (n = 5), (v) OVA + LPS/OVA + αIL-23p19 (n = 6), (vi) OVA + LPS/OVA + αIL-23p19 + POM1 (n = 6), and (vii) OVA + LPS/OVA + αIL-23p19 + αCD9 (n = 6). e IL-17 and IL-22 levels in BALF (n = 5 per group). f Representative images of H&E staining and (g) inflammatory scores quantified from H&E staining (n = 4 per group). Scale bar = 100 μm. h Penh values were measured using whole-body plethysmography (n = 6 per group). Data are shown as mean ± s.e.m. Significance was determined by one-way ANOVA with Tukey’s post hoc correction (ae, g) and two-way ANOVA with Sidak’s post hoc correction (h).
Fig. 5
Fig. 5. CD39+CD9+ IMs are critical for αIL-23p19-dependent suppression of neutrophilic inflammation via inhibition of NETosis.
a Representative images of lung immunostaining for citrullinated histone H3 (citH3, red), MPO (green), and DAPI (blue). citH3+MPO+ NETs are shown in yellow. Scale bar = 20 μm. b Colocalization area (µm2) of citH3+MPO+ NETs in each FOV quantified using Zen software (n = 8 per group). c Ly6G+ neutrophil percentage in the lung (n = 6 per group). d total cell, (e) neutrophil counts in BALF and, (f) IL-17 and IL-22 levels in BALF (OVA + LPS/PBS (n = 8), OVA + LPS/OVA (n = 8), OVA + LPS/OVA + GSK484 (n = 6), OVA + LPS/OVA + αIL-23p19 (n = 8), OVA + LPS/OVA + αIL-23p19 + POM1 (n = 8), OVA + LPS/OVA + αIL-23p19 + POM1 + GSK484 (n = 8), OVA + LPS/OVA + αIL-23p19 + αCD9 (n = 8), and OVA + LPS/OVA + αIL-23p19 + αCD9 + GSK484 (n = 8)). g Representative images of H&E staining and (h) inflammatory scores quantified from H&E staining. Scale bar = 100 μm (n = 3 per group). i Penh values measured using a whole body plethysmography (OVA + LPS/PBS (n = 8), OVA + LPS/OVA (n = 8), OVA + LPS/OVA + GSK484 (n = 8), OVA + LPS/OVA + αIL-23p19 (n = 8), OVA + LPS/OVA + αIL-23p19 + POM1 (n = 8), OVA + LPS/OVA + αIL-23p19 + POM1 + GSK484 (n = 8), OVA + LPS/OVA + αIL-23p19 + αCD9 (n = 6), and OVA + LPS/OVA + αIL-23p19 + αCD9 + GSK484 (n = 4)). j IL-23 level in BALF (n = 6 per group) and (k) percentages of CD39+CD9+ IMs in CD45+CD11b+CD11c- cells in the lung (n = 6 per group). Data are shown as mean ± s.e.m. Significance was determined by one-way ANOVA with Tukey’s post hoc correction (bf, h, j, k) and two-way ANOVA with Sidak’s post hoc correction (i).
Fig. 6
Fig. 6. CD39+CD9+ IMs directly inhibit NETosis of neutrophils derived from NDA mice in CD39 and CD9-dependent manner.
a Representative confocal microscopy images of immunostaining for citH3 (red), MPO (green), and DAPI (blue) in co-cultured slides. Merged citH3+MPO+ NETs are shown in yellow. Ly6G+ neutrophils were co-cultured with CD39+CD9+ IMs or CD39-CD9- monocytes on chamber slides. b Colocalization area (µm2) of citH3+MPO+ NETs in each FOV quantified using Zen software (Neutrophils (n = 16), Neutrophils+CD39+CD9+ IMs (n = 16), Neutrophils+CD39-CD9- monocytes (n = 9), Neutrophils+CD39+CD9+ IMs + POM1 (n = 16), Neutrophils + CD39+CD9+ IMs + 100 μM ATP (n = 6), Neutrophils+CD39+CD9+ IMs + 1 μM ATP (n = 16), Neutrophils+CD39+CD9+ IMs + 0.1 μM ATP (n = 9), Neutrophils+CD39+CD9+ IMs + 0.01 μM ATP (n = 9), and Neutrophils + CD39+CD9+ IMs + αCD9 (n = 16). c Representative photomultiplier tube (PMT) images showing immunostaining for MHCII (red) taken after 2 hr in the co-culture system. d Number of cell aggregates per FOV. Aggregates were defined as cells that adhered to at least five other cells (Netrophils (n = 22), Neutrophils + CD39+CD9+ IMs (n = 22), Neutrophils + CD39+CD9+ IMs + αCD9 (n = 22), Neutrophils+CD39+CD9+ IMs + POM1 (n = 17), Neutrophils+CD39+CD9+ IMs + 100 μM ATP (n = 17), and Neutrophils + CD39-CD9- monocytes (n = 17)). e Representative confocal microscopy images of immunostaining for citH3 (red), MPO (green), and MHCII (blue) in co-cultured slides. f Colocalization area (µm2) of citH3+MPO+ NETs in each FOV. Scale bar = 20 μm. (Netrophils (n = 22), Neutrophils + CD39+CD9+ IMs (n = 22), Neutrophils + CD39+CD9+ IMs + αCD9 (n = 22), Neutrophils + CD39+CD9+ IMs + POM1 (n = 7), Neutrophils+CD39+CD9+ IMs + 100 μM ATP (n = 18), and Neutrophils + CD39-CD9- monocytes (n = 18)). Data are shown as mean ± s.e.m. Significance was determined by one-way ANOVA with Tukey’s post hoc correction (b, d, f).
Fig. 7
Fig. 7. CD39+CD9+ IMs from PBS/PBS or OVA + LPS/OVA + αIL-23p19 suppress Th17-mediated neutrophilic inflammation in NDA mice.
a Schematic diagram of the adoptive transfer protocol. CD39+CD9+ IMs were sorted from OVA + LPS/OVA + αIL-23p19 or PBS/PBS, while Ly6G+CD39+CD9+ neutrophils were sorted from PBS/PBS on day 24. These isolated cells were intravenously transferred on every challenge to the NDA mouse model. The inflammatory response was assessed at 48 hr after the last challenge. b Total cell and neutrophil counts in BALF. c Percentages of Ly6G+ neutrophils (b, c; n = 9 per group). d RORγt+ Th cells in CD4+ T cells in the lung. e Levels of IL-17 and IL-22 in BALF (d, e; Vehicle (PBS) → NDA mice (n = 10), CD39+CD9+ IM (OVA + LPS/OVA+αIL23p19)→NDA mice (n = 10), CD39+CD9+ IM (PBS/PBS) → NDA mice (n = 6), and Ly6G+CD39+CD9+ neutrophil IM (PBS/PBS) → NDA mice (n = 6)). f IL-23 in BALF (n = 3 per group). g Representative images of H&E staining and (h) inflammatory scores quantified from H&E staining (n = 6 per group). Scale bar = 100 μm. i Penh values were measured using a whole body plethysmography. (Vehicle (PBS) → NDA mice (n = 10), CD39+CD9+ IM (OVA + LPS/OVA+αIL23p19)→NDA mice (n = 10), CD39+CD9+ IM (PBS/PBS) → NDA mice (n = 6), and Ly6G+CD39+CD9+ neutrophil IM (PBS/PBS) → NDA mice (n = 6)). j Representative images of lung immunostaining for citH3 (red), MPO (green), and DAPI (blue). The citH3+MPO+ NETs are shown in yellow. k Colocalization area (µm2) of citH3+MPO+ NETs (n = 17 per group). Scale bar = 20 μm. l Violin plots showing distributions of the signature scores of TREM2high CM in patients with mild/moderate (n = 30) and severe asthma (n = 33) in the SARP cohort. Center line, median value. Data are shown as mean ± s.e.m. Significance was determined by one-way ANOVA with Tukey’s post hoc correction (bf, h, k), two-way ANOVA with Sidak’s post hoc correction (i), and one-tailed Student’s t test (l).

References

    1. Fanta, C. H. Asthma. N. Engl. J. Med.360, 1002–1014 (2009). - PubMed
    1. Holgate, S. T. Innate and adaptive immune responses in asthma. Nat. Med.18, 673–683 (2012). - PubMed
    1. Levy, B. D. et al. Future research directions in Asthma. An NHLBI working group report. Am. J. Respir. Crit. Care Med.192, 1366–1372 (2015). - PMC - PubMed
    1. Kuruvilla, M. E., Lee, F. E. & Lee, G. B. Understanding Asthma phenotypes, endotypes, and mechanisms of disease. Clin. Rev. Allergy Immunol.56, 219–233 (2019). - PMC - PubMed
    1. Douwes, J., Gibson, P., Pekkanen, J. & Pearce, N. Non-eosinophilic asthma: importance and possible mechanisms. Thorax57, 643–648 (2002). - PMC - PubMed

Publication types

MeSH terms

Associated data