. 2024 Oct 4;14(1):22787.
doi: 10.1038/s41598-024-70319-4.

Plateau depolarizations in spontaneously active neurons detected by calcium or voltage imaging

Affiliations

Plateau depolarizations in spontaneously active neurons detected by calcium or voltage imaging

Katarina D Milicevic et al. Sci Rep. .

Abstract

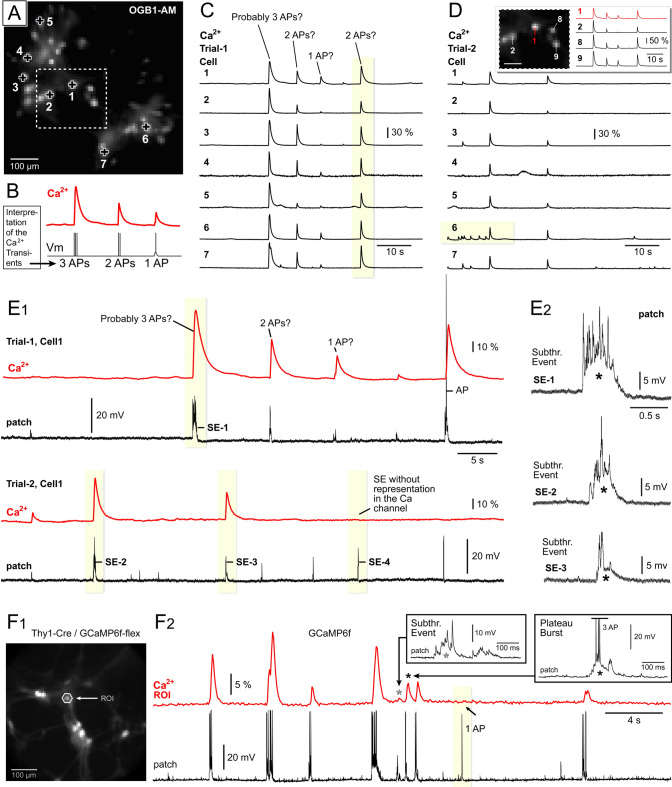
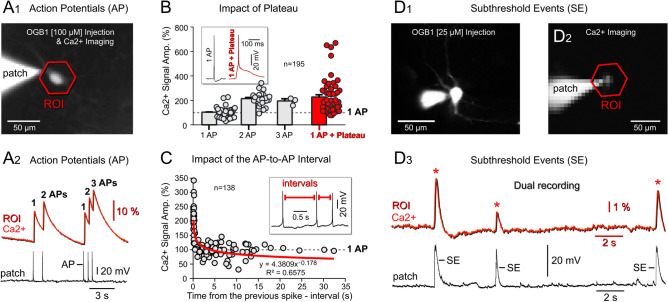
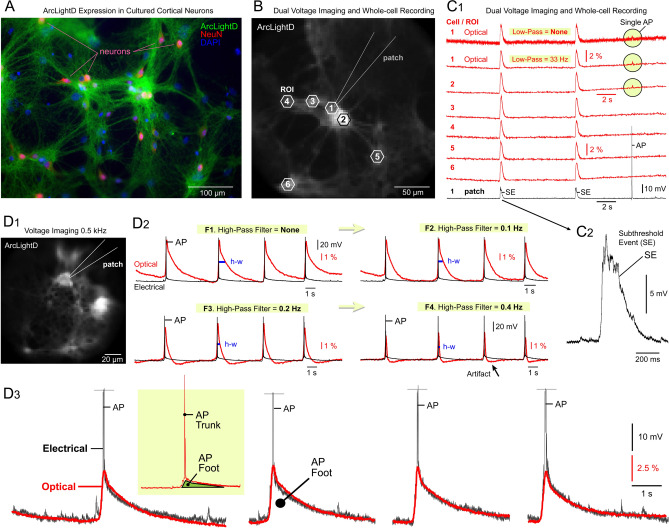
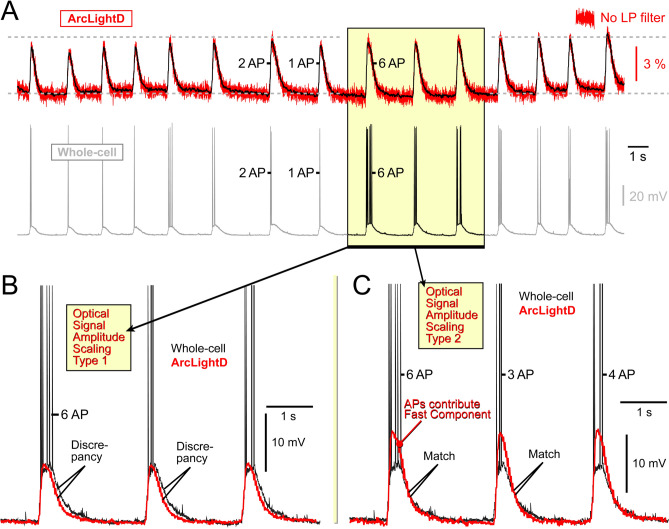
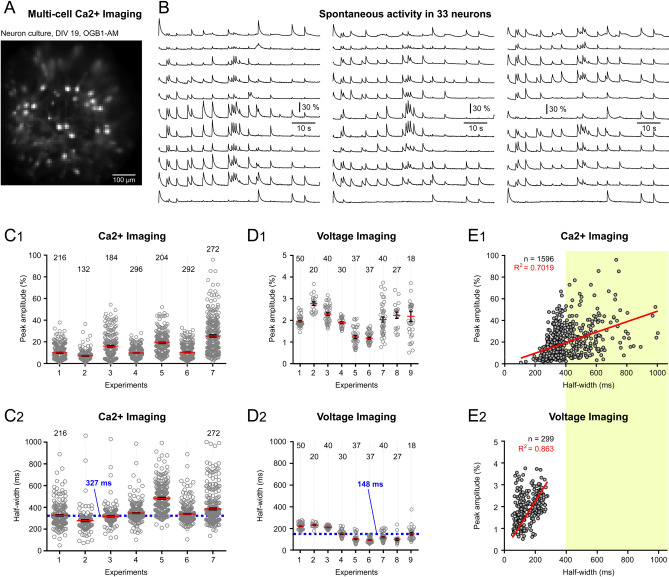
In calcium imaging studies, Ca2+ transients are commonly interpreted as neuronal action potentials (APs). However, our findings demonstrate that robust optical Ca2+ transients primarily stem from complex "AP-Plateaus", while simple APs lacking underlying depolarization envelopes produce much weaker photonic signatures. Under challenging in vivo conditions, these "AP-Plateaus" are likely to surpass noise levels, thus dominating the Ca2+ recordings. In spontaneously active neuronal culture, optical Ca2+ transients (OGB1-AM, GCaMP6f) exhibited approximately tenfold greater amplitude and twofold longer half-width compared to optical voltage transients (ArcLightD). The amplitude of the ArcLightD signal exhibited a strong correlation with the duration of the underlying membrane depolarization, and a weaker correlation with the presence of a fast sodium AP. Specifically, ArcLightD exhibited robust responsiveness to the slow "foot" but not the fast "trunk" of the neuronal AP. Particularly potent stimulators of optical signals in both Ca2+ and voltage imaging modalities were APs combined with plateau potentials (AP-Plateaus), resembling dendritic Ca2+ spikes or "UP states" in pyramidal neurons. Interestingly, even the spikeless plateaus (amplitude > 10 mV, duration > 200 ms) could generate conspicuous Ca2+ optical signals in neurons. Therefore, in certain circumstances, Ca2+ transients should not be interpreted solely as indicators of neuronal AP firing.


Conflict of interest statement

The authors declare no competing interests.

Figures

Figure 1
Figure 1
Interpretation of Ca2+ signals. (A) Cultured neurons are loaded with OGB1-AM and photographed at 14 Hz rate. (B) Relation between the Vm and Ca2 + . (C) Simultaneous Ca2 + imaging of spontaneous activity in seven neurons (Cells 1–7). Labels atop the Ca2 + trace indicate attempts to classify individual transients based on their most probable electrical underpinnings. A shaded vertical stripe marks a synchronized network event in all seven cells. The amplitude scale (30% ΔF/F) applies solely to Cell #3, with other cells arbitrarily scaled for display. (D) Similar to Panel C, showcasing a new experimental trial (Trial-2). A shaded horizontal stripe indicates a period during which Cell #6 exhibits independent activity. Inset: Ca2 + signals from the three nearest neurons (#2, #8, and #9) align with the activity of neuron #1. (E1) Dual electrical and optical recordings obtained in two consecutive experimental trials. Events labeled “3 APs”, “2 APs”, and “1 AP” in Panel A have been misinterpreted; instead, subthreshold events (SE) generate these Ca2 + transients. (E2) A sustained depolarization (asterisk) underlies each SE. (F1) Cultured neurons expressing GCaMP6f. (F2) Similar experimental setup as in Panel E1, except GCaMP6f is utilized to detect Ca2 + . Insets: Sustained depolarizations (asterisks) producing Ca2 + signals are displayed on a finer scale. A single action potential (1 AP) lacking the underlying sustained depolarization (plateau) is not observed in the Ca2 + imaging channel (arrow).
Figure 2
Figure 2
Subthreshold events produce Ca2+ optical signals. (A1) Intracellular injection of a Ca2+-sensitive dye, OGB1 [100 μM] followed by Ca2+ imaging. (A2) Dual electrical (patch) and optical (Ca2+) recording of subsequent APs. (B) Scatter plot depicting normalized Ca2+ signal amplitude versus type of electrical event. A horizontal dashed gray line indicates the trace-specific average amplitude of Ca2+ signals caused by confirmed single action potential (1 AP) events. Each data point represents one electrical event measured both electrically (via patch) and optically (via Ca2+ imaging). The scatter plot comprises 195 events obtained from 9 neurons via 30 dual-recording traces (each trace lasting 30 s). Inset: Whole-cell recordings of “1 AP” and “1 AP with plateau”. (C) Scatter plot illustrating normalized Ca2+ signal amplitude versus the time elapsed since the previous spike (AP-to-AP interval). This dataset excludes plateau events (n = 57). Inset: Red bars delineate intervals between electrically-recorded action potentials (AP-to-AP interval). (D1) Neuron injected with OGB1 [25 μM]. (D2) Optical imaging of neuronal spontaneous activity using low illumination intensity (neutral density filter, 0.05) and a camera frame rate of 28 Hz (sampling interval = 36 ms). (D3) Red optical trace (obtained by averaging 11 pixels within the region of interest, ROI) and whole-cell recording (black trace) are time-aligned. Spontaneous subthreshold events (SE) trigger noticeable optical signals.
Figure 3
Figure 3
Combined GEVI imaging and whole-cell recordings. (A) Thy1-positive pyramidal neurons transduced with AAV_ArcLightD and counter-stained with neuronal marker (NeuN) and cell-nucleus marker (DAPI). (B) Voltage imaging conducted at a 2 ms sampling interval (0.5 kHz) – one video frame is shown. (C1) Optical trace from ROI #1 is displayed without a low-pass filter (top), and then with a low-pass digital filter (cutoff at 33 Hz). ROIs 2 – 6 are filtered. The trace labeled “patch” represents a whole-cell recording from Cell #1. A current-evoked action potential (“AP”) is visible only in optical traces from ROIs #1 and #2. (C2) A spikeless subthreshold electrical event (SE) shown on a finer scale. (D1) Same experimental setup as in panel B, but with a different coverslip and a 40 × lens. (D2) Dual recording of electrical (black) and optical (red) signals from a patched neuron. Four filter sets (F1 to F4) are applied to the same optical trace to demonstrate the impact of a digital high-pass filter on signal waveform. The frequency cutoffs for F1 to F4 are: None, 0.1 Hz, 0.2 Hz, and 0.4 Hz, respectively. Optical signal duration at half amplitude (half-width, h-w) changes with a stronger filter setting (from F1 to F4). A black arrow marks a filtering artifact that may resemble hyperpolarization. (D3) The pair of electrical (black) and optical (red) traces from the same neuron are amplitude-scaled to illustrate that ArcLightD tracks the slow component of the membrane potential change. Inset: The slow component of the electrical signal (green triangle) is termed the “Foot of the AP”, while the fast component of the action potential is termed the “AP Trunk”.
Figure 4
Figure 4
ArcLightD reports the slow phase of the electrical event. (A) Dual recording of electrical (whole-cell) and optical (ArcLightD) signals from a cultured neuron. The voltage imaging trace (top trace) is depicted without filtering (red) and with low-pass filtering (black optical trace). (B) A segment of the dual recording is presented here on a finer scale. The optical signal (red) is scaled to match the amplitude of the slow component of the electrical signal. The temporal discrepancy observed during the repolarization phase is labeled as “Discrepancy.” (C) Similar to panel B, but with different scaling; the optical signal is adjusted to match the decay of the electrical transient (Match). A portion of the optical signal extending beyond the peak of the plateau depolarization appears to integrate fast action potentials (APs) into a single optical transient (Fast Component).
Figure 5
Figure 5
Multi-cell imaging of spontaneous activity – Comparisons between calcium and voltage transients. (A) Cultured cortical neurons, extracellularly loaded with the Ca2+-sensitive dye OGB1-AM. (B) Optical traces from 33 neurons depict ongoing spontaneous neuronal activity. (C1) Ca2+ imaging: Optical signal amplitudes from 7 neuronal cultures, each containing 8–10 neurons. Each data point represents one optical transient, and the number of data points per experiment (n) is indicated above each column. (C2) Same Ca2+ imaging data as in C1, with signal duration (half-width) quantified. The dashed horizontal line marks the median value of 327 ms. (D1 & D2) Similar to panel C, but using ArcLightD as the optical indicator. The optical transient’s half-width median value now is only 148 ms. (E1) Optical transient’s amplitude plotted against the optical transient’s duration. Each data point represents one physiological event (n = 1,596 Ca2+ transients, from 7 cultures). (E2) Similar to panel E1, but using ArcLightD as the optical indicator (n = 299 depolarization (voltage) transients, from 9 cultures). Yellow shaded area highlights signal durations that are typical in Ca2+ imaging but are not typically observed in voltage imaging.

Similar articles

Cited by

References

    1. Murphy, T. H., Blatter, L. A., Wier, W. G. & Baraban, J. M. Spontaneous synchronous synaptic calcium transients in cultured cortical neurons. J. Neurosci.12(12), 4834–4845 (1992). - PMC - PubMed
    1. Cohen, E., Ivenshitz, M., Amor-Baroukh, V., Greenberger, V. & Segal, M. Determinants of spontaneous activity in networks of cultured hippocampus. Brain Res.1235, 21–30 (2008). - PubMed
    1. Antic, S. D., Zhou, W. L., Moore, A. R., Short, S. M. & Ikonomu, K. D. The decade of the dendritic NMDA spike. J. Neurosci. Res.88(14), 2991–3001 (2010). - PMC - PubMed
    1. Larkum, M. E., Nevian, T., Sandler, M., Polsky, A. & Schiller, J. Synaptic integration in tuft dendrites of layer 5 pyramidal neurons: A new unifying principle. Science325(5941), 756–760 (2009). - PubMed
    1. Antic, S. D., Hines, M. & Lytton, W. W. Embedded ensemble encoding hypothesis: The role of the “Prepared” cell. J. Neurosci. Res.96(9), 1543–1559 (2018). - PMC - PubMed

LinkOut - more resources