Randomized Controlled Trial
. 2024 Oct 5;15(1):8640.
doi: 10.1038/s41467-024-53013-x.

Effects of iron supplements and iron-containing micronutrient powders on the gut microbiome in Bangladeshi infants: a randomized controlled trial

Affiliations
Randomized Controlled Trial

Effects of iron supplements and iron-containing micronutrient powders on the gut microbiome in Bangladeshi infants: a randomized controlled trial

Andrew Baldi et al. Nat Commun. .

Abstract

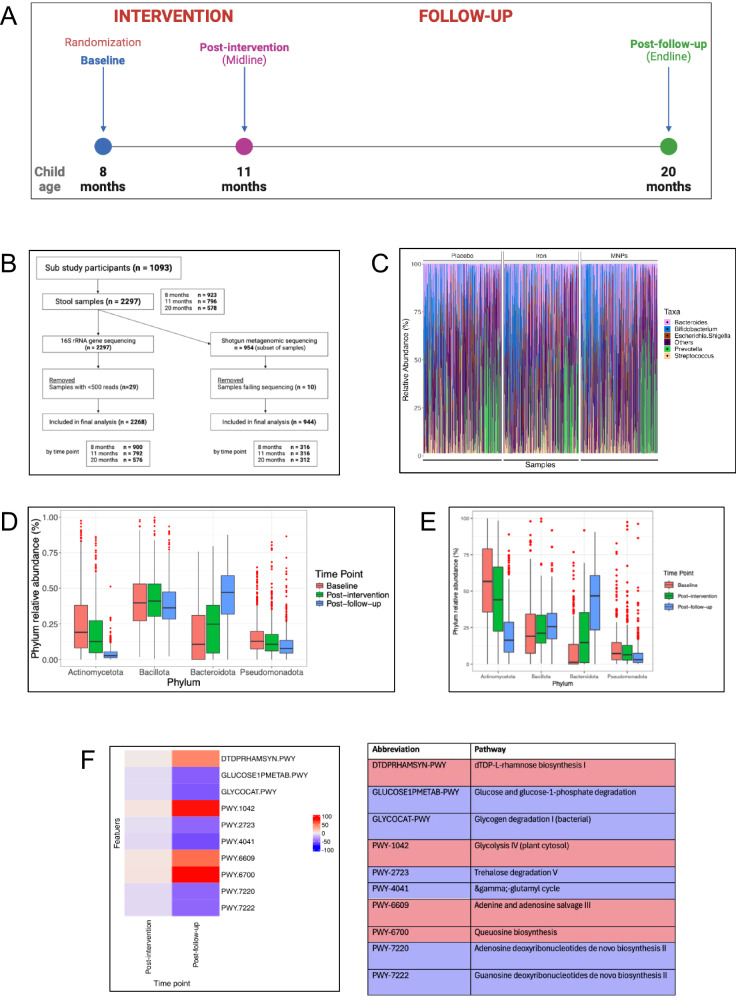
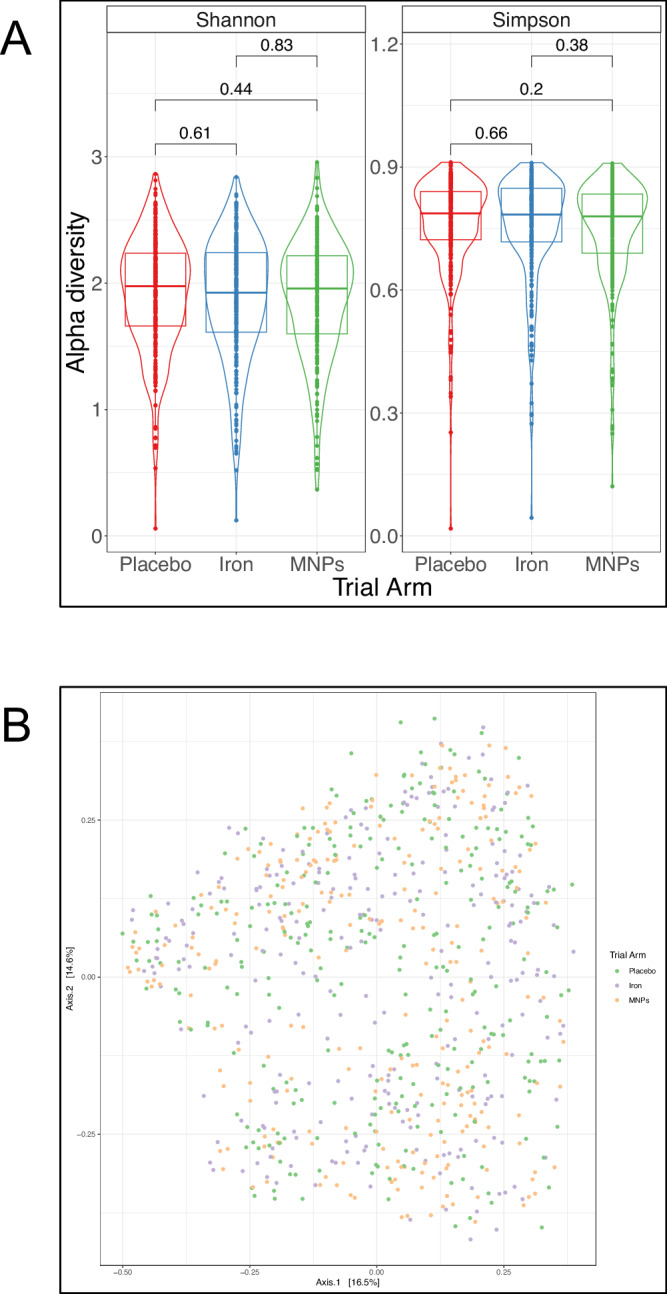
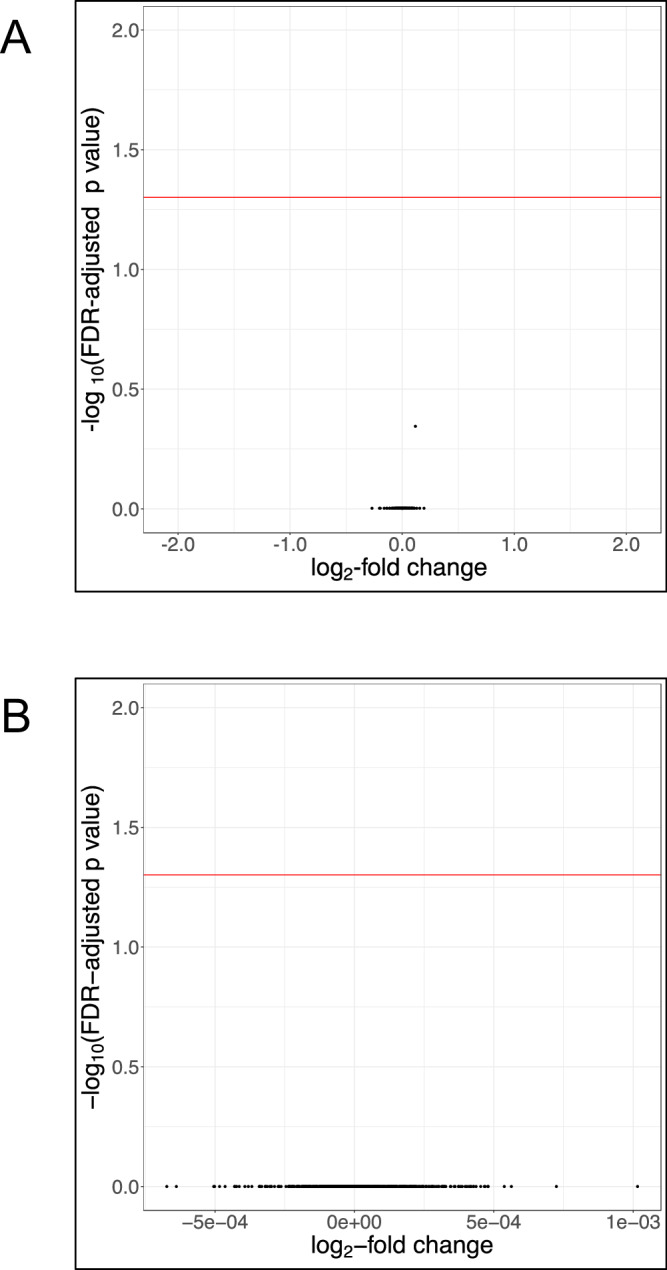
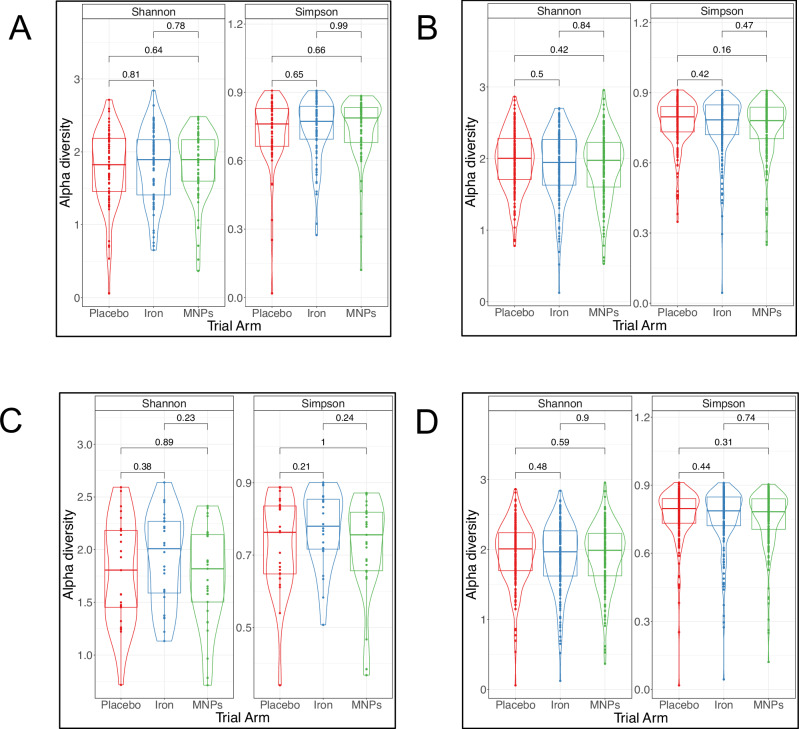
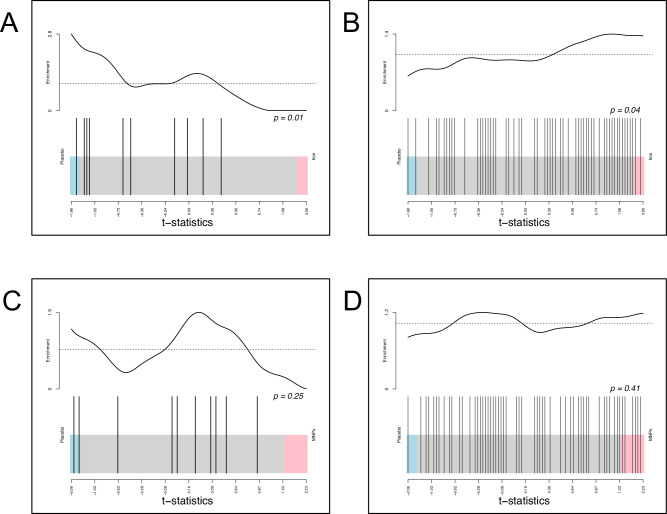
Anemia is highly prevalent globally, especially in young children in low-income countries, where it often overlaps with a high burden of diarrheal disease. Distribution of iron interventions (as supplements or iron-containing multiple micronutrient powders, MNPs) is a key anemia reduction strategy. Small studies in Africa indicate iron may reprofile the gut microbiome towards pathogenic species. We seek to evaluate the safety of iron and MNPs based on their effects on diversity, composition, and function of the gut microbiome in children in rural Bangladesh as part of a large placebo-controlled randomized controlled trial of iron or MNPs given for 3 months (ACTRN12617000660381). In 923 infants, we evaluate the microbiome before, immediately following, and nine months after interventions, using 16S rRNA gene sequencing and shotgun metagenomics in a subset. We identify no increase in diarrhea with either treatment. In our primary analysis, neither iron nor MNPs alter gut microbiome diversity or composition. However, when not adjusting for multiple comparisons, compared to placebo, children receiving iron and MNPs exhibit reductions in commensal species (e.g., Bifidobacterium, Lactobacillus) and increases in potential pathogens, including Clostridium. These increases are most evident in children with baseline iron repletion and are further supported by trend-based statistical analyses.


Conflict of interest statement

The authors declare no competing interests.

Figures

Fig. 1
Fig. 1. Study design, sample information and analysis by time point.
A BRISC trial schema showing assessment and sampling time points. B Flow diagram outlining stool samples for 16S rRNA and shotgun metagenomic sequencing. C Stacked bar plot presenting taxonomic composition of baseline samples at study entry (i.e., baseline) based on relative abundance of the top five genera overall. Each bar represents a sample, with relative abundance on the y-axis. Samples are grouped by trial arm (16S rRNA data). Taxonomic boxplots showing relative abundance of the four most abundant bacterial phyla by sampling time point (D) 16S rRNA data and (E). shotgun metagenomic data. Boxplot center lines denote median value, with bounds of box indicating 25–75th percentiles. Whisker lines encompass 1.5 x interquartile range from above the upper and below the lower quartiles. Data points outside whiskers are outliers. (n = 900 at baseline, n = 790 at post-intervention and n = 574 at post-follow-up time points for (D), and n = 316 at baseline, n = 316 at post-intervention and n = 312 at post-follow-up time points for E). F Heatmap showing relative differences in abundance of genes relating to microbiome functional profile by sampling time point across all trial arms, with baseline as reference. Relative abundance data underwent centered log ratio normalization/transformation in a general linear model analysis in MaAsLin2, with data for differentially abundant functional pathways including coefficient (approximating log2-fold change), standard deviation and FDR-adjusted p value. Only the 10 features exhibiting the greatest relative change in abundance (increase – in red – or decrease – in blue – from baseline) are shown. Abundance is expressed as −log10(FDR-adjusted p value) * sign(log2-fold change) as per the heatmap calculation used by MaAsLin2. (n = 255 at baseline, n = 231 at post-intervention and n = 312 at post-follow-up time points) (Shotgun metagenomic data). A, B created with BioRender.com released under a Creative Commons Attribution-NonCommercial-NoDerivs 4.0 International license (https://creativecommons.org/licenses/by-nc-nd/4.0/deed.en). Source data for Fig. 1C–F are provided in the Source Data file.
Fig. 2
Fig. 2. Alpha and beta diversity by trial arm.
A Violin plot presenting taxonomic alpha diversity—measured by Shannon and inverse Simpson indices—by trial arm immediately post-intervention (16S rRNA data). Each dot represents an individual sample, grouped by trial arm. Group differences were calculated using pair-wise ANOVA for each diversity measure. Center lines denote median value, with rectangles showing 25–75th percentiles. The violin outlines the distribution of the data, with wider sections representing a higher probability that samples in the dataset will have the corresponding value and narrower sections representing a lower probability. B Principal coordinates analysis plot illustrating beta diversity of samples by trial arm post-intervention and measured by Bray-Curtis dissimilarity, with permutational analysis of variance (PERMANOVA) used as the statistical test (p = 0.841) (16S rRNA data). Each dot represents an individual sample, grouped by trial arm. (n = 276 for placebo, n = 254 for iron and n = 262 for MNPs).
Fig. 3
Fig. 3. Differential abundance diversity and trial arm.
Volcano plots presenting differential abundance by trial arm immediately post-intervention, with (A) showing no significant differences at the species level and (B) showing no significant differences in abundance of functional pathways measured by HUMAnN 3.0 (Shotgun metagenomic data). Relative abundance data underwent centered log ratio normalization/transformation in a general linear model analysis in MaAsLin2, with data for differentially abundant species and functional pathways including coefficient (approximating log2-fold change), standard deviation and FDR-adjusted p value. Each figure shows log2-fold change on the x-axis and the −log10(FDR-adjusted p value) on the y-axis. The horizontal red line indicates an FDR-adjusted p value 0.05. Source data for this figure are provided in the Source Data file.
Fig. 4
Fig. 4. Subgroup analyses of baseline iron status by trial arm.
Violin plots presenting alpha diversity – measured by Shannon and inverse Simpson indices – by trial arm immediately post-intervention according to subgroups: (A) participants with baseline iron deficiency, (B) participants with baseline iron repletion, (C) participants with low hepcidin (<10 ng/mL) at baseline and (D) participants with non-low hepcidin (≥10 ng/mL) at baseline. Iron deficiency was defined as either serum ferritin <12 μg/L or <30 μg/L if C-reactive protein was (>5 mg/L). (16S rRNA data). Each dot represents an individual sample, grouped by trial arm. Group differences were calculated using pair-wise ANOVA for each diversity measure. Center lines denote median value, with rectangles showing 25–75th percentiles. The violin outlines the distribution of the data, with wider sections representing a higher probability that samples in the dataset will have the corresponding value and narrower sections representing a lower probability. (n = 67 for placebo, n = 80 for iron and n = 68 for MNPs for (A), 195, 170, and 181 for (B), 25, 24, and 29 for (C), and 205, 189, and 197 for (D)).
Fig. 5
Fig. 5. Unadjusted analysis of differential abundance by trial arm.
Volcano plots illustrating differential abundance by trial arm as measured immediately post-intervention utilizing unadjusted p values. A Differential abundance at the genus level. B. Differential abundance at the species level. Illustrate results of unadjusted differential abundance analyses at the species level of subgroups: (C) participants with baseline iron deficiency, (D) participants with baseline iron repletion (1. Clostridium innocuum (MNPs), 2. Clostridioides difficile (MNPs), 3. C. innocuum (Iron), 4. Escherichia coli (MNPs), 5. Bifidobacterium bifidum (Iron), 6. E. coli (Iron)) (E) participants with low hepcidin (<10 ng/mL) at baseline (1. Streptococcus infantarius (Iron), 2. Lactobacillus vaginalis (Iron), 3. Clostridium paraputrificum (Iron), 4. Clostridium butyricum (Iron), 5. Enterobacter cloacae complex (Iron), 6. Clostridium sp 7 2 43FAA (Iron), 7. Lactobacillus salivarius (Iron), 8. Enterococcus avium (Iron), 9. Sutterella parvirubra (Iron), 10. Allisonella histaminiformans (Iron), 11. Collinsella intestinalis (Iron), 12. Actinomyces sp HPA0247 (Iron), 13. Bifidobacterium dentium (Iron), 14. Collinsella stercoris (Iron)) and (F) participants with non-low hepcidin (≥10 ng/mL) at baseline (1. Enterococcus faecalis (Iron), 2. Ruminococcus torques (Iron), 3. Clostridium innocuum (MNPs), 4. Enterococcus faecium (MNPs), 5. Escherichia coli (Iron), 6. Lactobacillus gasseri (MNPs)). Iron deficiency was defined as either serum ferritin <12 μg/L or <30 μg/L if C-reactive protein was (>5 mg/L). (A 16S rRNA data; BF. Shotgun metagenomic data). For (A), a log linear regression model is performed on abundance data to determine differential abundance of genera and present unadjusted p values. For (BF), relative abundance data underwent centered log ratio normalization/transformation in a general linear model analysis in MaAsLin2, with data for differentially abundant species including coefficient (approximating log2-fold change), standard deviation and unadjusted p value. Each figure shows log2-fold change on the x-axis and the −log10(unadjusted p value) on the y-axis. The horizontal red line indicates an unadjusted p value 0.05. Source data for this figure are provided in the Source Data file.
Fig. 6
Fig. 6. Enrichment analysis.
Competitive phylum enrichment analysis, contrasting the phyla Bacillota and Bacteroidota. Enrichment is assessed using camera PR and t-statistics to rank species based on their differential expression. These are used to determine statistically significant variations in the aggregate mean rank order for the entire phylum between different iron and placebo. In the barcode plots, individual species within a phylum are represented by vertical bars; species that are up-regulated under placebo conditions appear on the left, while those up-regulated in response to the intervention are on the right. The line above represents the distribution of t-statistics, highlighting enrichment of species within the phyla. A Bacteroidota (placebo-iron), (B) Bacillota (placebo-iron), (C) Bacteroidota (placebo-MNPs) and (D) Bacillota (placebo-MNPs) (Shotgun metagenomic data).

References

    1. World Health Organization. The global prevalence of anaemia in 2011 (World Health Organization, Geneva, 2015).
    1. World Health Organization. Global Health Observatory data repository: Anaemia in children estimates by country and WHO region (World Health Organization, Geneva, 2021).
    1. United Nations Children’s Fund (UNICEF). One is too many: Ending child deaths from pneumonia and diarrhea. (UNICEF, New York, 2016).
    1. World Health Organization. Daily iron supplementation in children 6–23 months of age. e-Library of Evidence for Nutrition Actions (eLENA), Vol. 2016 (World Health Organization, Geneva, 2016).
    1. WHO Guidelines Approved by the Guidelines Review Committee. Use of multiple micronutrient powders for point-of-use fortification of foods consumed by infants and young children aged 6–23 months and children aged 2–12 years (World Health Organization, Geneva, 2016). - PubMed

Publication types

Associated data

LinkOut - more resources