. 2024 Oct 4;14(1):23105.
doi: 10.1038/s41598-024-74523-0.

Quantitative proteomics and phosphoproteomics profiling of meiotic divisions in the fission yeast Schizosaccharomyces pombe

Affiliations

Quantitative proteomics and phosphoproteomics profiling of meiotic divisions in the fission yeast Schizosaccharomyces pombe

Barbara Sivakova et al. Sci Rep. .

Abstract

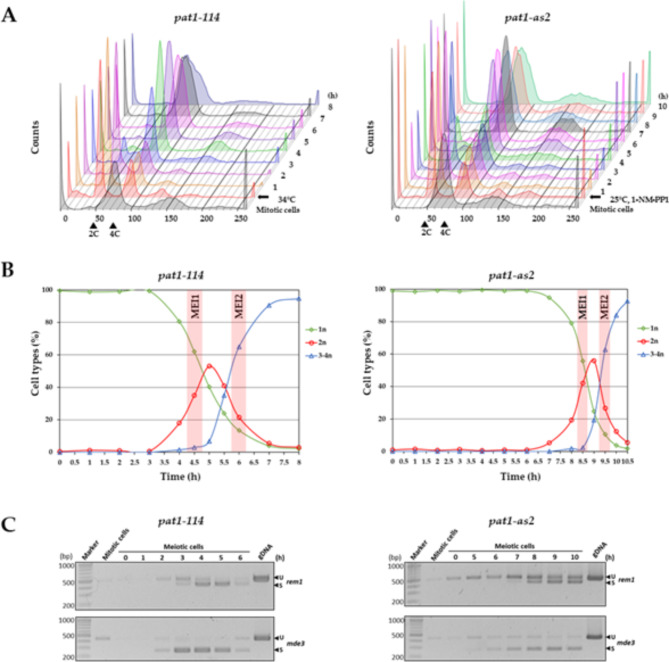
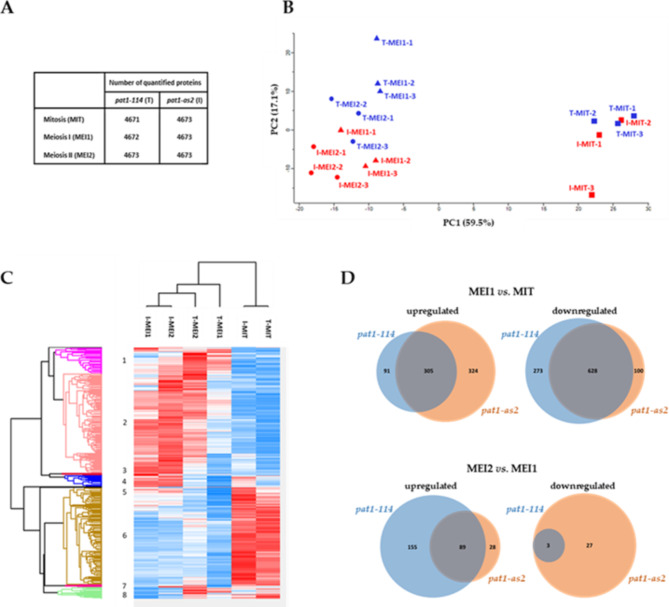
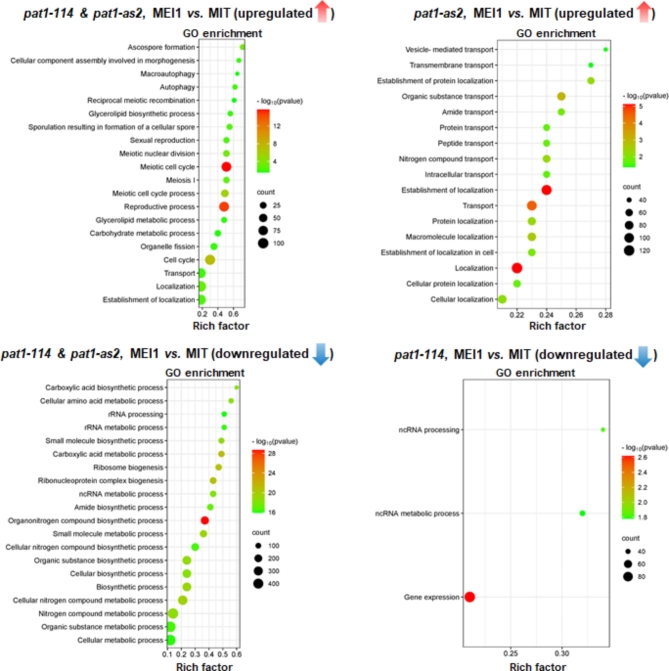
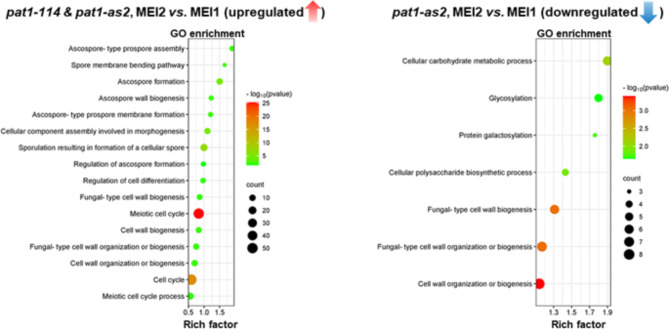
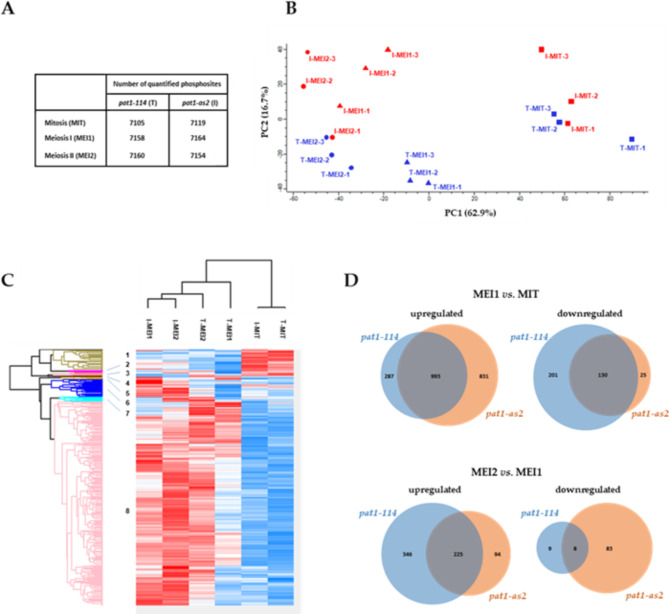
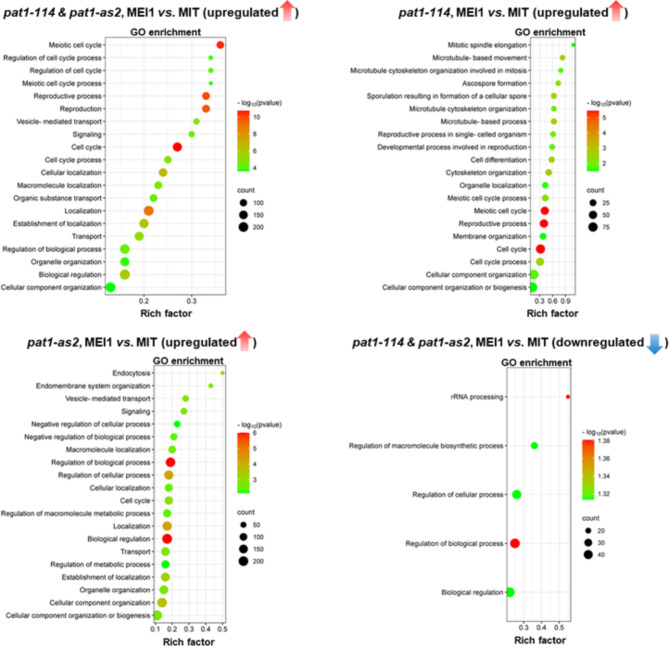
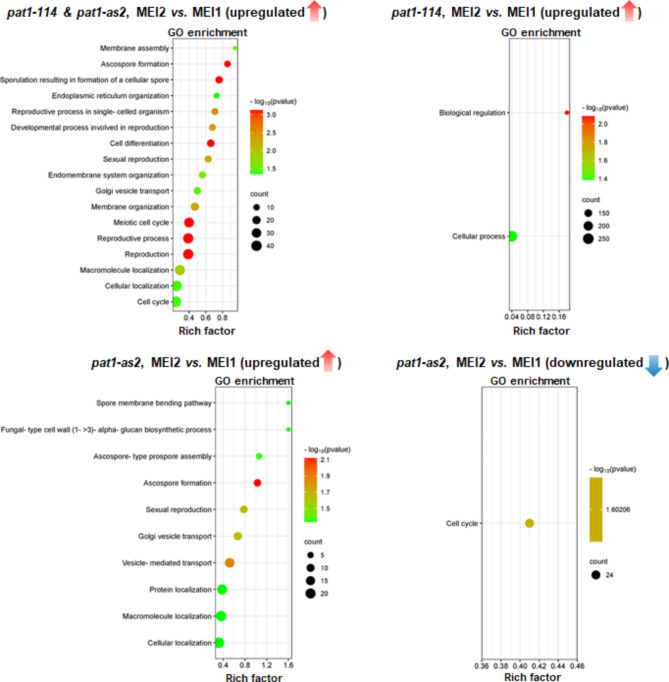
In eukaryotes, chromosomal DNA is equally distributed to daughter cells during mitosis, whereas the number of chromosomes is halved during meiosis. Despite considerable progress in understanding the molecular mechanisms that regulate mitosis, there is currently a lack of complete understanding of the molecular mechanisms regulating meiosis. Here, we took advantage of the fission yeast Schizosaccharomyces pombe, for which highly synchronous meiosis can be induced, and performed quantitative proteomics and phosphoproteomics analyses to track changes in protein expression and phosphorylation during meiotic divisions. We compared the proteomes and phosphoproteomes of exponentially growing mitotic cells with cells harvested around meiosis I, or meiosis II in strains bearing either the temperature-sensitive pat1-114 allele or conditional ATP analog-sensitive pat1-as2 allele of the Pat1 kinase. Comparing pat1-114 with pat1-as2 also allowed us to investigate the impact of elevated temperature (25 °C versus 34 °C) on meiosis, an issue that sexually reproducing organisms face due to climate change. Using TMTpro 18plex labeling and phosphopeptide enrichment strategies, we performed quantification of a total of 4673 proteins and 7172 phosphosites in S. pombe. We found that the protein level of 2680 proteins and the rate of phosphorylation of 4005 phosphosites significantly changed during progression of S. pombe cells through meiosis. The proteins exhibiting changes in expression and phosphorylation during meiotic divisions were represented mainly by those involved in the meiotic cell cycle, meiotic recombination, meiotic nuclear division, meiosis I, centromere clustering, microtubule cytoskeleton organization, ascospore formation, organonitrogen compound biosynthetic process, carboxylic acid metabolic process, gene expression, and ncRNA processing, among others. In summary, our findings provide global overview of changes in the levels and phosphorylation of proteins during progression of S. pombe cells through meiosis at normal and elevated temperatures, laying the groundwork for further elucidation of the functions and importance of specific proteins and their phosphorylation in regulating meiotic divisions in this yeast.

Keywords: Schizosaccharomyces pombe; Elevated temperature; Meiosis; Pat1 protein kinase; Phosphoproteome; Proteome; Quantitative mass spectrometry.


Conflict of interest statement

The authors declare no competing interests.

Figures

Fig. 1
Fig. 1
Progression of diploid pat1-114 and pat1-as2 cells into meiosis. The cells were cultured in YE + 4 S-Ade medium, synchronized in the G1 phase using EMM2-NH4Cl medium, and then shifted into EMM2 medium prewarmed to 34 °C (pat1-114) or resuspended in EMM2 medium prewarmed to 25 °C with the addition of 25 µM 1-NM-PP1 (pat1-as2). The progression of cells into meiosis was monitored by flow cytometry (A), by counting the nuclei (B), and by RT-PCR of reference meiotic genes (C) from samples collected at the indicated time points. Samples for quantitative mass spectrometry analysis were collected at the time points indicated by the pink columns in the nuclei counting data (B). Mitotic cells – exponentially growing mitotic cells, MEI1 – meiosis I, MEI2 – meiosis II, n – number of nuclei, gDNA – genomic DNA, U – PCR amplicon of unspliced pre-mRNA, S – PCR amplicon of spliced mRNA.
Fig. 2
Fig. 2
Proteomic profiling of the six subsets of S. pombe samples, including mitotic (T-MIT), meiosis I (T-MEI1), and meiosis II (T-MEI2) samples of pat1-114, and mitotic (I-MIT), meiosis I (I-MEI1), and meiosis II (I-MEI2) samples of pat1-as2 cells, respectively (n = 3; three biological replicates for each sample). (A) Summary of the number of proteins quantified in the analyzed samples. (B) Two-dimensional principal component analysis (PCA) evaluating differences in the quantified proteins among the analyzed samples. (C) Heatmap depicting the abundance patterns of 4673 proteins quantified in the analyzed samples. Each column and row represent an individual sample and protein, respectively. Relative protein levels are depicted in color scale: red indicates more abundance, and blue indicates less abundance. (D) Venn diagrams depicting the number of proteins that were identified to be specifically or similarly upregulated and downregulated when comparing the particular stages of meiosis in pat1-114 and pat1-as2 cells.
Fig. 3
Fig. 3
GO enrichment analysis of proteins dysregulated in meiosis I when comparing meiosis I and mitotic samples (MEI1 versus MIT) in S. pombe pat1-114 and pat1-as2 cells. The scatter plot of pat1-114 & pat1-as2, MEI1 versus MIT (downregulated) includes the top 20 most enriched biological process categories (for the complete list of GO enrichment, refer to Table S2). The X-axis label represents the rich factor, and the Y-axis label shows the GO terms (biological process categories). The rich factor reflects the proportion of proteins in a given GO term, with a higher rich factor indicating greater enrichment. The color of the dots represents the enrichment score [–log10(p-value)], where red indicates high enrichment, and green indicates low enrichment. Dot size corresponds to the number of proteins in the respective GO term, with larger dots indicating a greater number of proteins.
Fig. 4
Fig. 4
GO enrichment analysis of proteins dysregulated in meiosis II when comparing meiosis II and meiosis I samples (MEI2 versus MEI1) in S. pombe pat1-114 and pat1-as2 cells. The X-axis label represents the rich factor, and the Y-axis label shows the GO terms (biological process categories). The rich factor reflects the proportion of proteins in a given GO term, with a higher rich factor indicating greater enrichment. The color of the dots represents the enrichment score [–log10(p-value)], where red indicates high enrichment, and green indicates low enrichment. Dot size corresponds to the number of proteins in the respective GO term, with larger dots indicating a greater number of proteins.
Fig. 5
Fig. 5
Phosphoproteomic profiling of the six subsets of S. pombe samples, including mitotic (T-MIT), meiosis I (T-MEI1), and meiosis II (T-MEI2) samples of pat1-114, and mitotic (I-MIT), meiosis I (I-MEI1), and meiosis II (I-MEI2) samples of pat1-as2 cells, respectively (n = 3; three biological replicates for each sample). (A) Summary of the number of quantified phosphosites in the analyzed samples. (B) Two-dimensional principal component (PC) analysis evaluating differences in the quantified phosphosites among the analyzed samples. (C) Heatmap depicting the abundance patterns of 7164 quantified phosphosites in the analyzed samples. Each column and row represent an individual sample and phosphosite, respectively. The relative degree of phosphorylation of particular phosphosites is depicted in a color scale: red indicates a higher degree of phosphorylation, and blue indicates a lower degree of phosphorylation. (D) Venn diagrams depicting the number of sites whose phosphorylation was found to be specifically or similarly upregulated and downregulated when comparing particular stages of meiosis in pat1-114 and pat1-as2 samples.
Fig. 6
Fig. 6
GO enrichment analysis of proteins whose phosphorylation was dysregulated in meiosis I when comparing meiosis I and mitotic samples (MEI1 versus MIT) in S. pombe pat1-114 and pat1-as2 cells. The scatter plots of pat1-114 & pat1-as2, pat1-114, and pat1-as2, all MEI1 versus MIT (upregulated) include the top 20 most enriched biological process categories (for the complete list of GO enrichment, refer to Table S4). The X-axis label represents the rich factor, and the Y-axis label shows the GO terms (biological process categories). The rich factor reflects the proportion of proteins in a given GO term, with a higher rich factor indicating greater enrichment. The color of the dots represents the enrichment score [–log10(p-value)], where red indicates high enrichment, and green indicates low enrichment. Dot size corresponds to the number of proteins in the respective GO term, with larger dots indicating a greater number of proteins.
Fig. 7
Fig. 7
GO enrichment analysis of proteins whose phosphorylation was dysregulated in meiosis II when comparing meiosis II and meiosis I samples (MEI2 versus MEI1) in S. pombe pat1-114 and pat1-as2 cells. The X-axis label represents the rich factor, and the Y-axis label shows the GO terms (biological process categories). The rich factor reflects the proportion of proteins in a given GO term, with a higher rich factor indicating greater enrichment. The color of the dots represents the enrichment score [–log10(p-value)], where red indicates high enrichment, and green indicates low enrichment. Dot size corresponds to the number of proteins in the respective GO term, with larger dots indicating a greater number of proteins.

Similar articles

Cited by

References

    1. Bolte, M. et al. Inhibition of APC-mediated proteolysis by the meiosis-specific protein kinase Ime2. Proc. Natl. Acad. Sci. U S A. 99 (7), 4385–4390 (2002). - PMC - PubMed
    1. Benjamin, K. R. et al. Control of landmark events in meiosis by the CDK Cdc28 and the meiosis-specific kinase Ime2. Genes Dev. 17 (12), 1524–1539 (2003). - PMC - PubMed
    1. Yamamoto, M. The selective elimination of messenger RNA underlies the mitosis-meiosis switch in fission yeast. Proc. Jpn Acad. Ser. B Phys. Biol. Sci. 86 (8), 788–797 (2010). - PMC - PubMed
    1. Kim Guisbert, K. S. et al. Meiosis-induced alterations in transcript architecture and noncoding RNA expression in S. Cerevisiae. RNA. 18 (6), 1142–1153 (2012). - PMC - PubMed
    1. Okaz, E. et al. Meiotic prophase requires proteolysis of M phase regulators mediated by the meiosis-specific APC/CAma1. Cell. 151 (3), 603–618 (2012). - PubMed

MeSH terms

LinkOut - more resources