

Prediction of emergency department presentations for acute coronary syndrome using a machine learning approach
- PMID: 39367080
- PMCID: PMC11452569
- DOI: 10.1038/s41598-024-73291-1
Prediction of emergency department presentations for acute coronary syndrome using a machine learning approach
Abstract
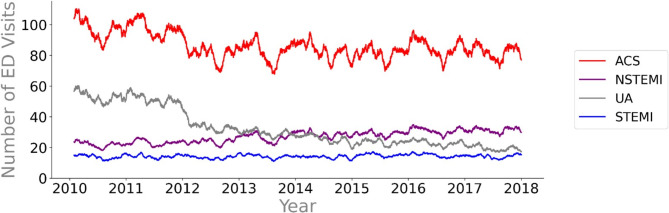
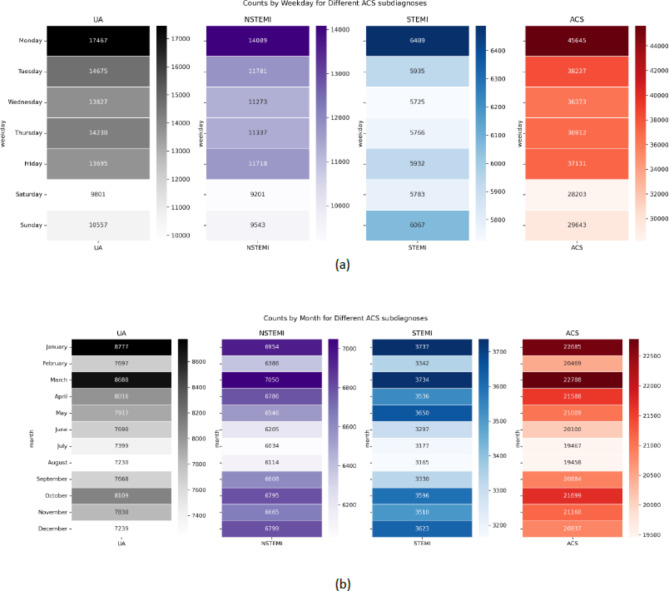
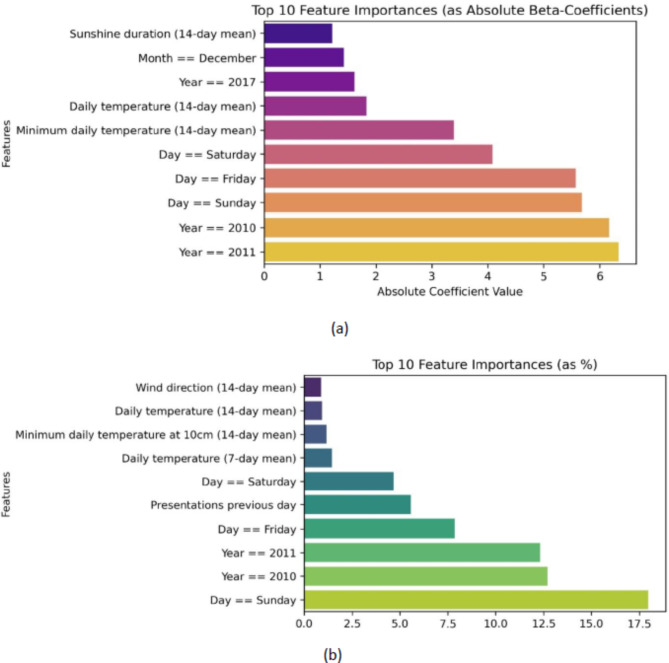
The relationship between weather and acute coronary syndrome (ACS) incidence has been the subject of considerable research, with varying conclusions. Harnessing machine learning techniques, our study explores the relationship between meteorological factors and ACS presentations in the emergency department (ED), offering insights into seasonal variations and inter-day fluctuations to optimize patient care and resource allocation. A retrospective cohort analysis was conducted, encompassing ACS presentations to Dutch EDs from 2010 to 2017. Temporal patterns were analyzed using heat-maps and time series plots. Multivariable linear regression (MLR) and Random Forest (RF) regression models were employed to forecast daily ACS presentations with prediction horizons of one, three, seven, and thirty days. Model performance was assessed using the coefficient of determination (R²), Mean Absolute Error (MAE), and Mean Absolute Percentage Error (MAPE). The study included 214,953 ACS presentations, predominantly unstable angina (UA) (94,272; 44%), non-ST-elevated myocardial infarction (NSTEMI) (78,963; 37%), and ST-elevated myocardial infarction (STEMI) (41,718; 19%). A decline in daily ACS admissions over time was observed, with notable inter-day (estimated median difference: 41 (95%CI = 37-43, p = < 0.001) and seasonal variations (estimated median difference: 9 (95%CI 6-12, p = < 0.001). Both MLR and RF models demonstrated similar predictive capabilities, with MLR slightly outperforming RF. The models showed moderate explanatory power for ACS incidence (adjusted R² = 0.66; MAE (MAPE): 7.8 (11%)), with varying performance across subdiagnoses. Prediction of UA incidence resulted in the best-explained variability (adjusted R² = 0.80; MAE (MAPE): 5.3 (19.1%)), followed by NSTEMI and STEMI diagnoses. All models maintained consistent performance over extended prediction horizons. Our findings indicate that ACS presentation exhibits distinctive seasonal changes and inter-day differences, with marked reductions in incidence during the summer months and a distinct peak prevalence on Mondays. The predictive performance of our model was moderate. Nonetheless, we obtained good explanatory power for UA presentations. Our model emerges as a potentially valuable supplementary tool to enhance ED resource allocation or future predictive models predicting ACS incidence in the ED.
© 2024. The Author(s).
Conflict of interest statement
The authors declare no competing interests.
Figures
Similar articles
-
Epidemiology and risk factors of patients with types of acute coronary syndrome presenting to a tertiary care hospital in Sri Lanka.BMC Cardiovasc Disord. 2019 Oct 21;19(1):229. doi: 10.1186/s12872-019-1217-x. BMC Cardiovasc Disord. 2019. PMID: 31638908 Free PMC article.
-
Clinical characteristics and outcomes of acute coronary syndrome patients in a PCI-Limited setting: a prospective study from Bhutan.BMC Cardiovasc Disord. 2025 Apr 25;25(1):324. doi: 10.1186/s12872-025-04782-w. BMC Cardiovasc Disord. 2025. PMID: 40281444 Free PMC article.
-
Nationwide trends in acute coronary syndrome by subtype in New Zealand 2006-2016.Heart. 2020 Feb;106(3):221-227. doi: 10.1136/heartjnl-2019-315655. Epub 2019 Oct 31. Heart. 2020. PMID: 31672778
-
Global effect of COVID-19 pandemic on the rate of acute coronary syndrome admissions: a comprehensive review of published literature.Open Heart. 2021 Jun;8(1):e001645. doi: 10.1136/openhrt-2021-001645. Open Heart. 2021. PMID: 34083389 Free PMC article.
-
Cardiovascular Risk Profile, Presentation and Management Outcomes of Patients with Acute Coronary Syndromes after Coronary Artery Bypass Grafting.Curr Probl Cardiol. 2022 Nov;47(11):101078. doi: 10.1016/j.cpcardiol.2021.101078. Epub 2021 Dec 11. Curr Probl Cardiol. 2022. PMID: 34902394 Review.
Cited by
-
An Interpretable Machine Learning Framework for Analyzing the Interaction Between Cardiorespiratory Diseases and Meteo-Pollutant Sensor Data.Sensors (Basel). 2025 Aug 7;25(15):4864. doi: 10.3390/s25154864. Sensors (Basel). 2025. PMID: 40808028 Free PMC article.
References
-
- Pines, J. M. et al. International perspectives on emergency department crowding. Acad. Emerg. Med.18, 1358–1370 (2011). - PubMed
-
- Affleck, A., Parks, P., Drummond, A., Rowe, B. H. & Ovens, H. J. Emergency department overcrowding and access block. Can. J. Emerg. Med.15, 359–370 (2013). - PubMed
-
- How The Nursing Shortage Affects The ER—And What To Do. About It - NurseJournal. https://nursejournal.org/articles/nursing-shortage-er-nurses/
MeSH terms
LinkOut - more resources
Full Text Sources
