

Exploring the prognostic and diagnostic value of lactylation-related genes in sepsis
- PMID: 39367086
- PMCID: PMC11452377
- DOI: 10.1038/s41598-024-74040-0
Exploring the prognostic and diagnostic value of lactylation-related genes in sepsis
Abstract
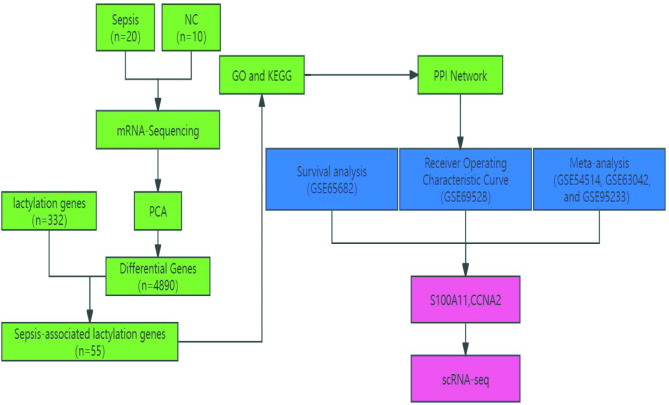
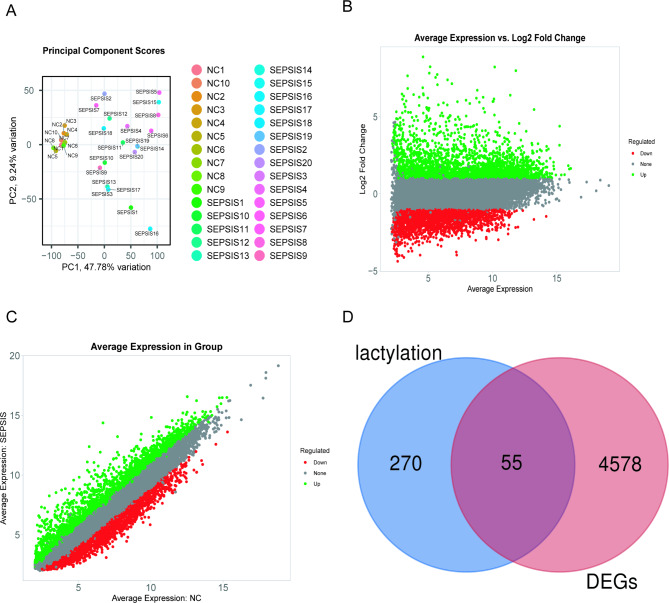
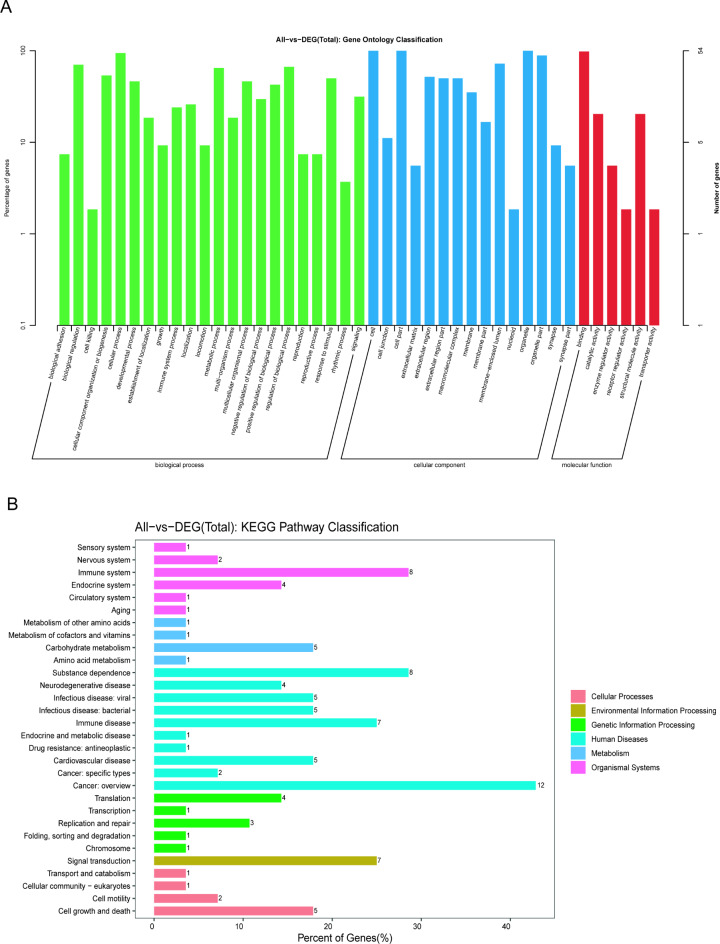
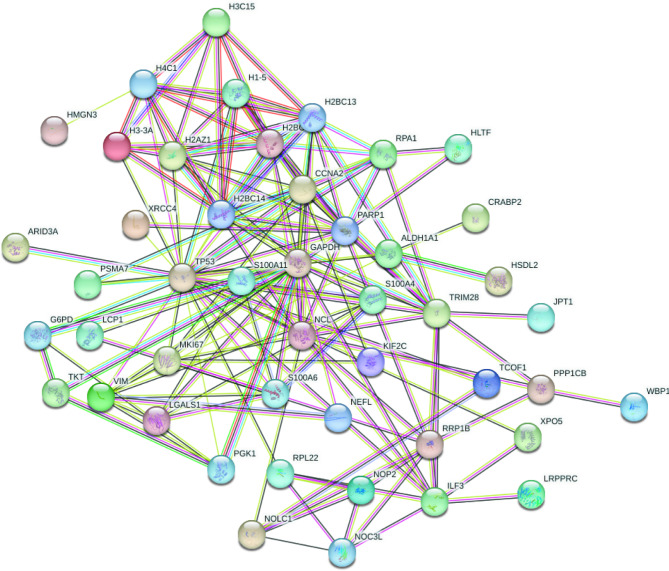
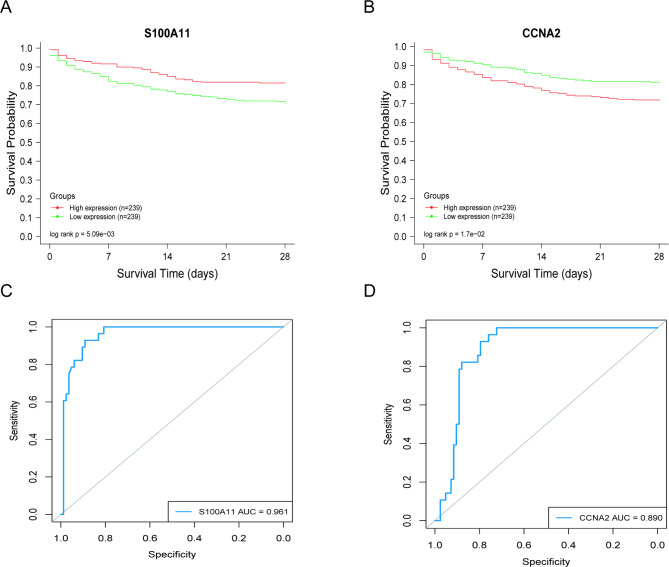
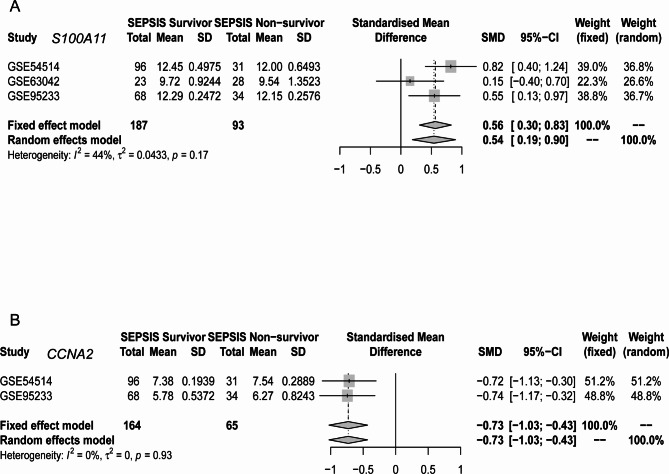
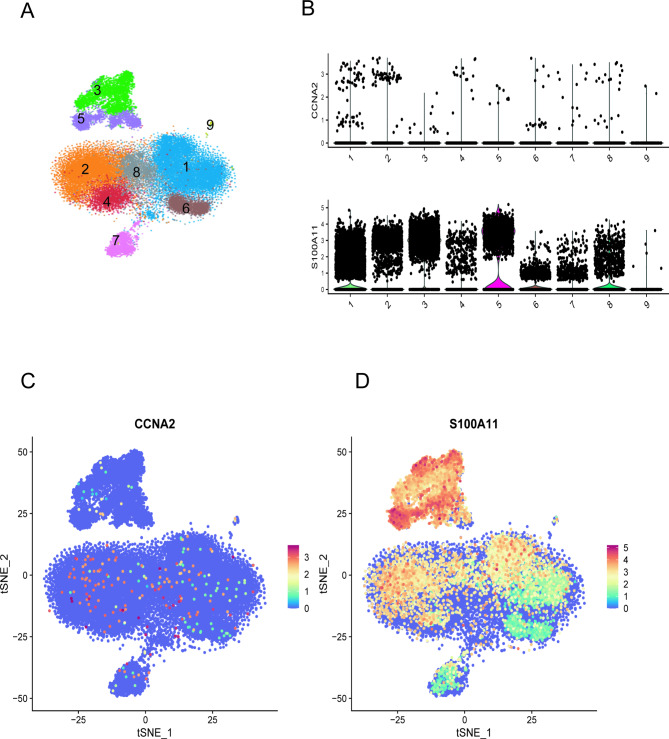
The discovery of Lactylation may pave the way for novel approaches to investigating sepsis. This study focused on the prognostic and diagnostic significance of lactylated genes in sepsis. RNA sequencing was performed on blood samples from 20 sepsis patients and 10 healthy individuals at Southwest Medical University in Luzhou, Sichuan, China. Genes associated with sepsis were identified through analysis of RNA sequencing data. Afterward, the genes that were expressed differently were compared with the lactylation genes, resulting in the identification of 55 lactylation genes linked to sepsis. The overlapping genes underwent analysis using Gene Ontology (GO) and the Kyoto Encyclopedia of Genes and Genomes (KEGG). Protein-Protein Network Interactions were used to screen for the core genes. The datasets GSE65682, GSE69528, GSE54514, GSE63042, and GSE95233 were obtained from the GEO database to validate core genes. Survival analysis evaluated the predictive significance of central genes in sepsis, while Receiver Operating Characteristic (ROC) Curve analysis was employed to establish the diagnostic value of genes. Additionally, a meta-analysis was conducted to confirm the precision of RNA-seq data. We obtained five peripheral blood samples, including two from healthy individuals, one from a patient with systemic inflammatory response syndrome (SIRS), and two from patients with sepsis. These samples were used to identify the specific location of core genes using 10×single-cell sequencing. High-throughput sequencing and bioinformatics techniques identified two lactylation-related genes (S100A11 and CCNA2) associated with sepsis. Survival analysis indicated that septic patients with reduced levels of S100A11 had a decreased 28-day survival rate compared to those with elevated levels. Conversely, individuals exhibiting decreased CCNA2 levels demonstrated a greater likelihood of surviving for 28 days than those in the high expression category, indicating a favorable association with survival rates among sepsis patients (P < 0.05). Both genes showed high sensitivity and specificity based on the ROC curve, with AUC values of 0.961 for S100A11 and 0.890 for CCNA2. The meta-analysis revealed that S100A11 exhibited high levels of expression in the sepsis survivors, whereas it displayed low levels of expression in the non-survivors; on the other hand, CCNA2 demonstrated low expression in the sepsis survivors and high expression in the non-survivors (P < 0.05). Single-cell RNA sequencing ultimately showed that monocyte macrophages, T cells, and B cells exhibited high expression levels of the crucial genes associated with sepsis-induced lactylation. In conclusion, the lactylation genes S100A11 and CCNA2 are strongly linked to sepsis and could be valuable markers for diagnosing, predicting outcomes, and providing guidance for sepsis.
Keywords: Lactylation; Sepsis; Single-cell RNA sequencing technology; mRNA-seq.
© 2024. The Author(s).
Conflict of interest statement
The authors declare no competing interests.
Figures
References
MeSH terms
Substances
Grants and funding
- 23LCYJ001/Key Clinical Specialty Construction Project of Sichuan Province. Sichuan Provincial Health and Health Committee Science and Technology Project
- 23LCYJ001/Key Clinical Specialty Construction Project of Sichuan Province. Sichuan Provincial Health and Health Committee Science and Technology Project
- 23LCYJ001/Key Clinical Specialty Construction Project of Sichuan Province. Sichuan Provincial Health and Health Committee Science and Technology Project
- 23LCYJ001/Key Clinical Specialty Construction Project of Sichuan Province. Sichuan Provincial Health and Health Committee Science and Technology Project
- 23LCYJ001/Key Clinical Specialty Construction Project of Sichuan Province. Sichuan Provincial Health and Health Committee Science and Technology Project
- 2021LZXNYD-J13/1 Municipal Project [Luzhou Municipal People's Government-Southwest Medical University Science and Technology Strategic Cooperation Applied Basic Research Project
- 2021LZXNYD-J13/1 Municipal Project [Luzhou Municipal People's Government-Southwest Medical University Science and Technology Strategic Cooperation Applied Basic Research Project
- 2021LZXNYD-J13/1 Municipal Project [Luzhou Municipal People's Government-Southwest Medical University Science and Technology Strategic Cooperation Applied Basic Research Project
- 2021LZXNYD-J13/1 Municipal Project [Luzhou Municipal People's Government-Southwest Medical University Science and Technology Strategic Cooperation Applied Basic Research Project
- 2021LZXNYD-J13/1 Municipal Project [Luzhou Municipal People's Government-Southwest Medical University Science and Technology Strategic Cooperation Applied Basic Research Project
LinkOut - more resources
Full Text Sources
Medical
Miscellaneous
