. 2024 Nov;25(11):2097-2109.
doi: 10.1038/s41590-024-01975-x. Epub 2024 Oct 4.

Profibrotic monocyte-derived alveolar macrophages are expanded in patients with persistent respiratory symptoms and radiographic abnormalities after COVID-19

Affiliations

Profibrotic monocyte-derived alveolar macrophages are expanded in patients with persistent respiratory symptoms and radiographic abnormalities after COVID-19

Joseph I Bailey et al. Nat Immunol. 2024 Nov.

Erratum in

Abstract

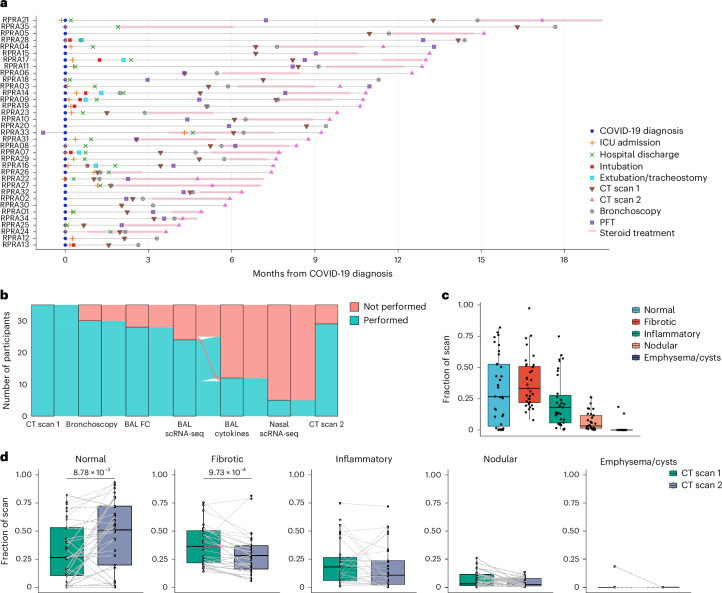
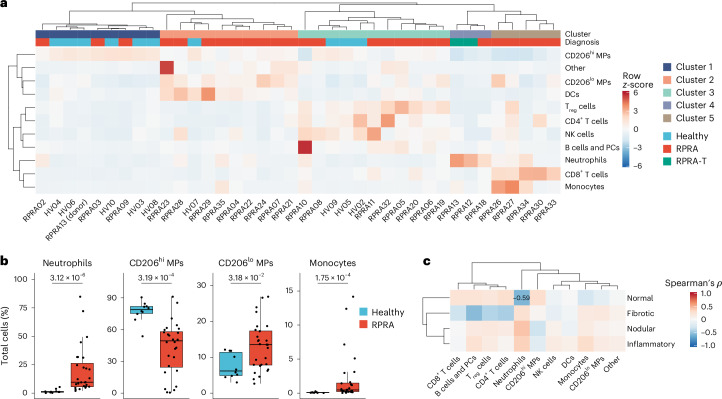
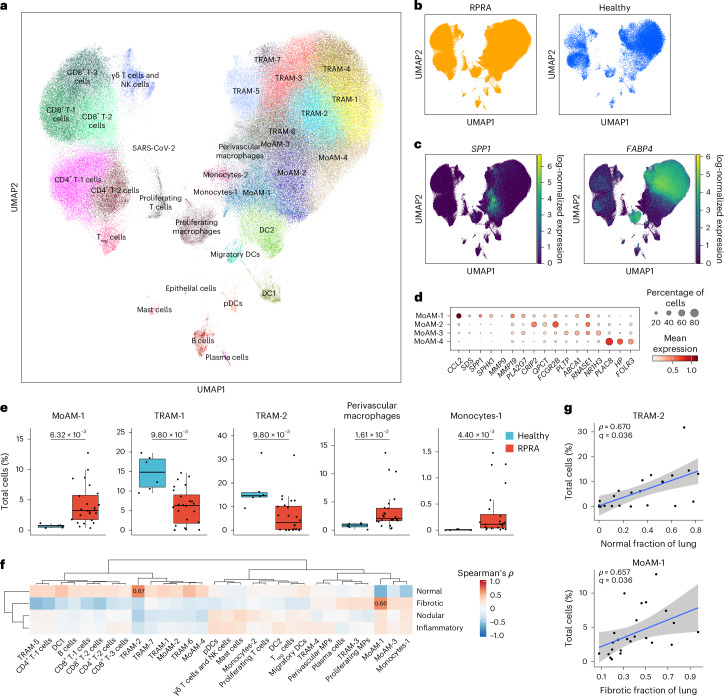
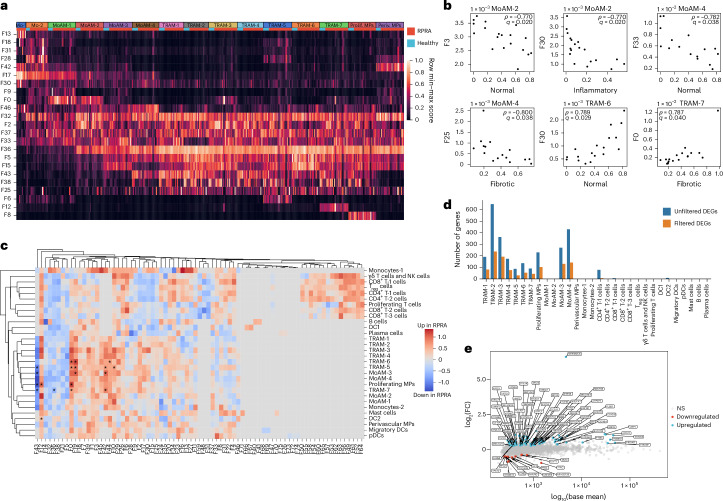
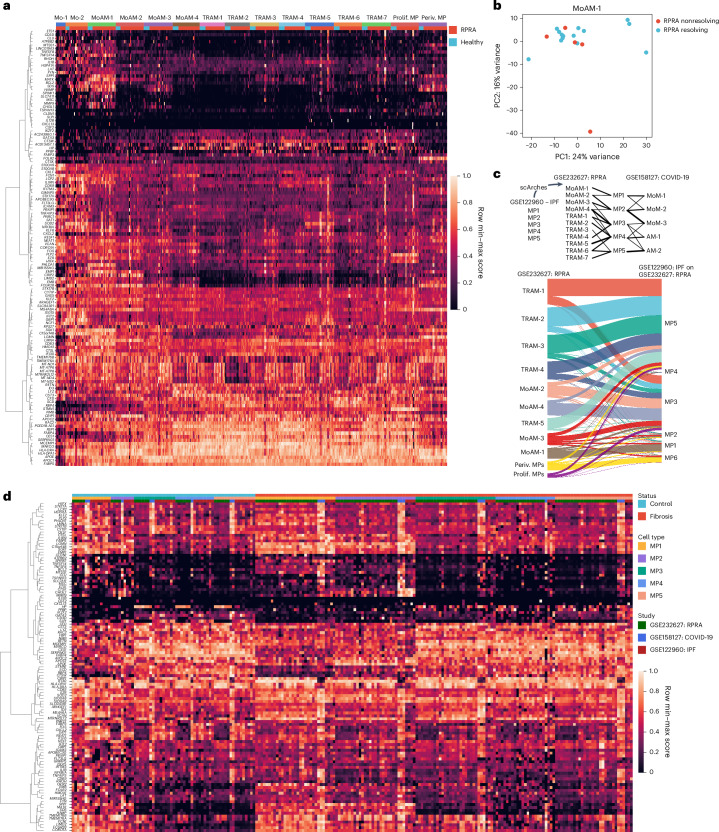
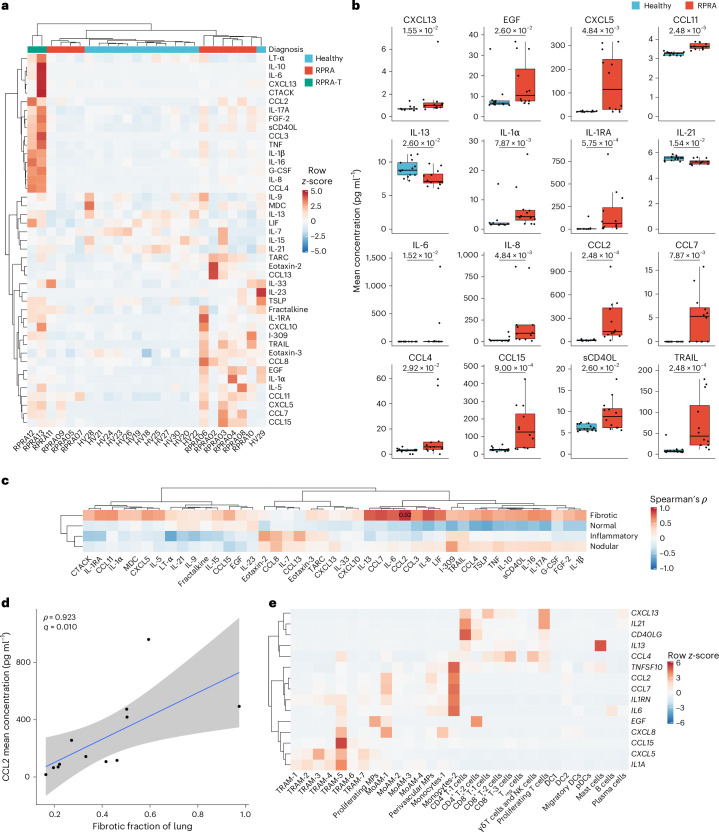
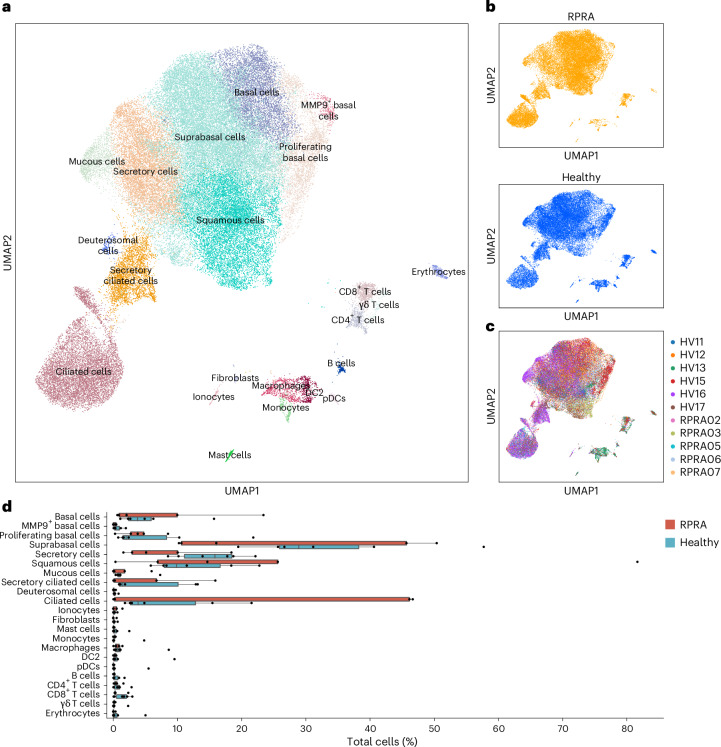
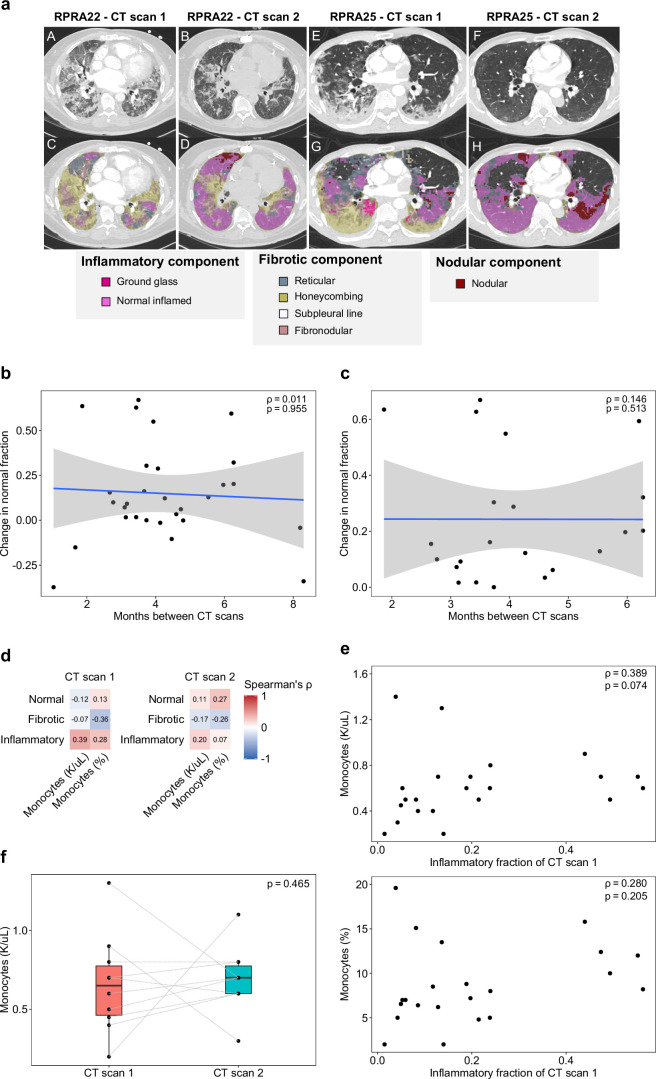
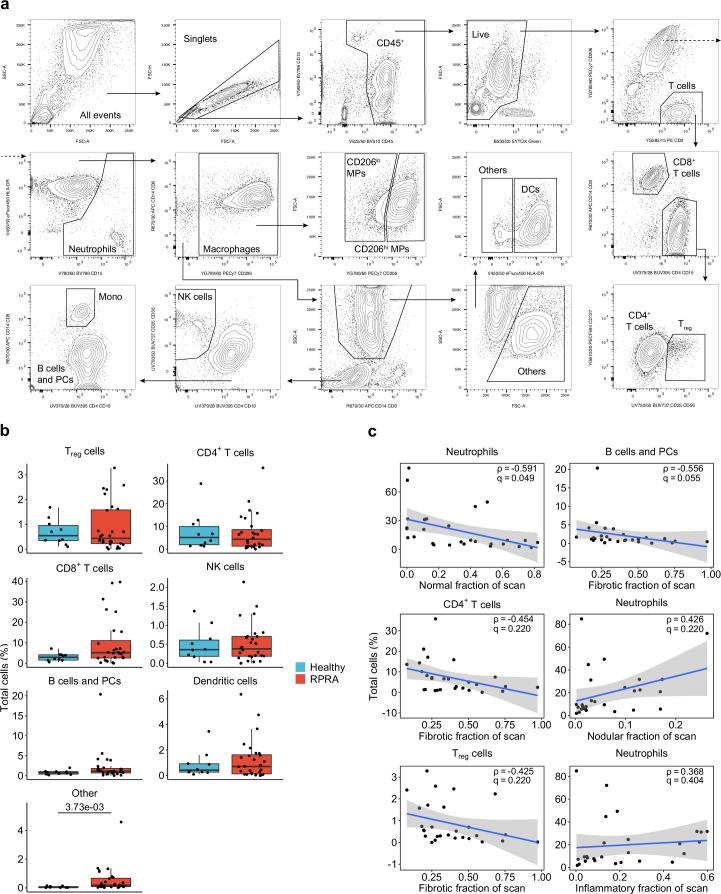
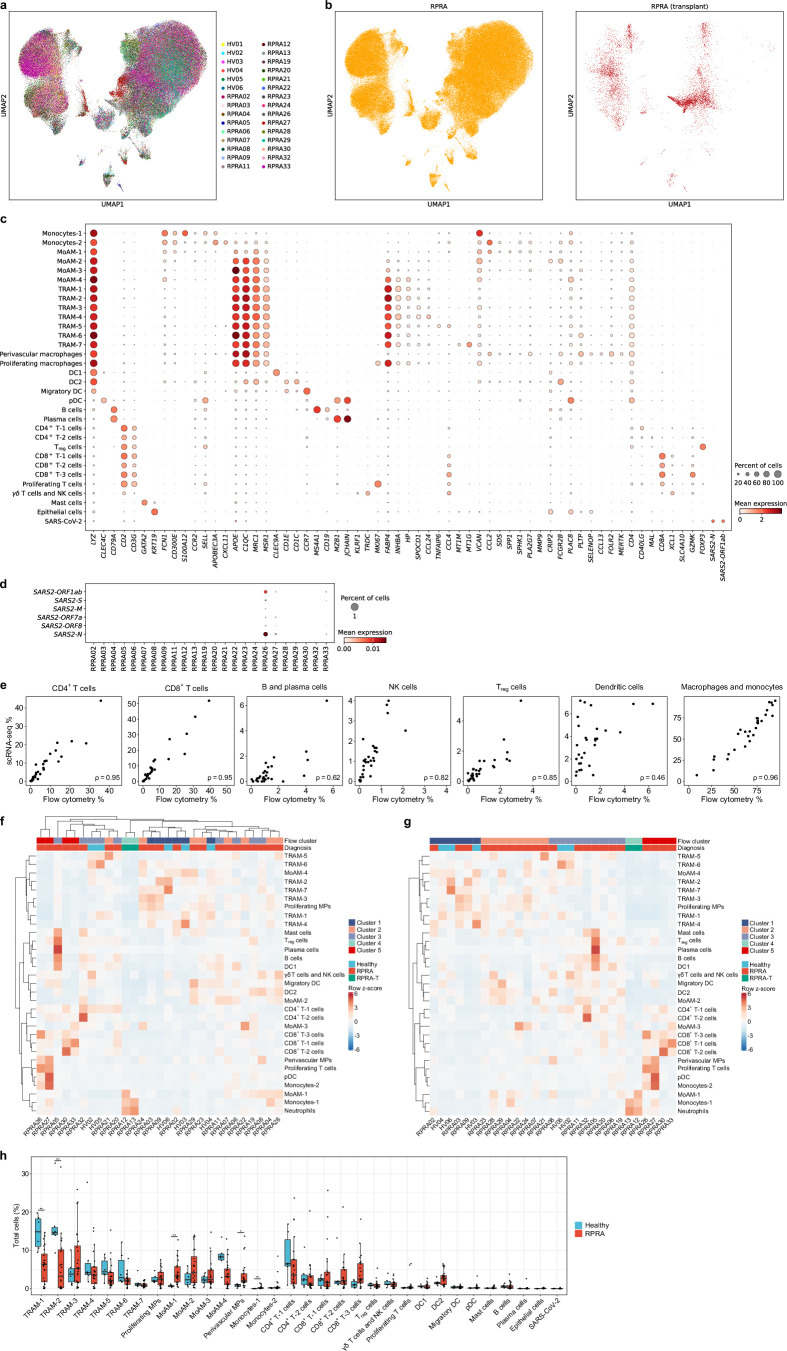
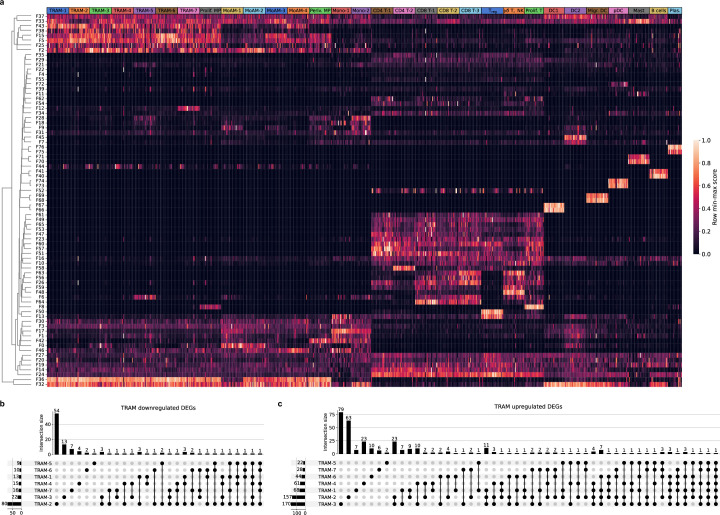
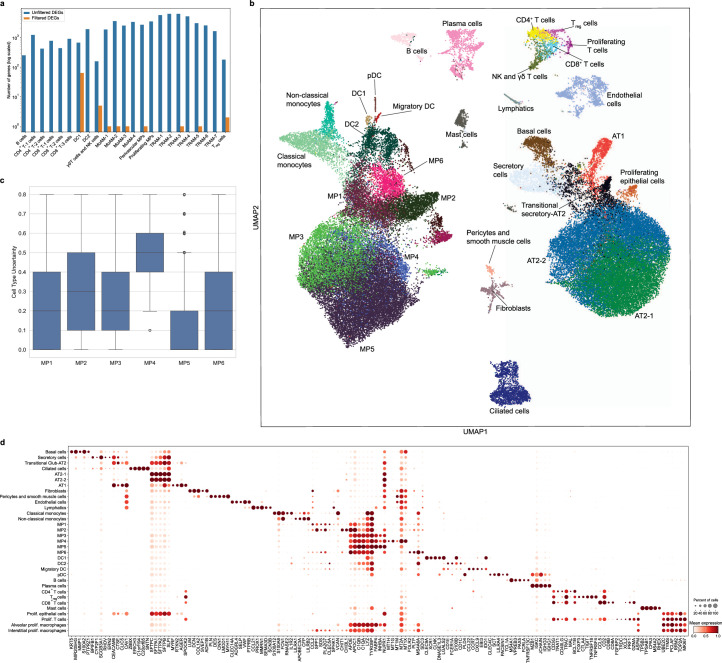
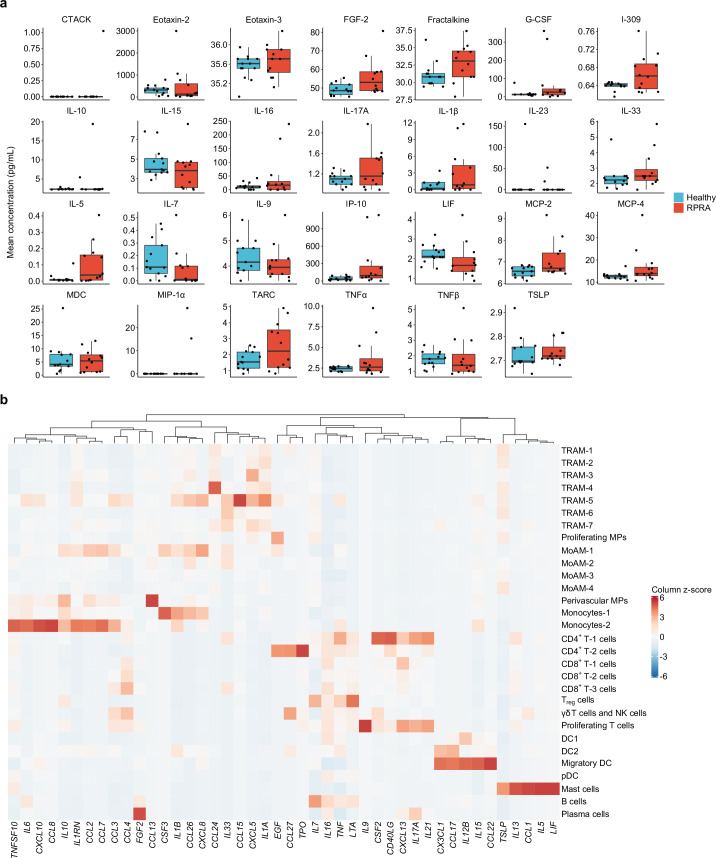
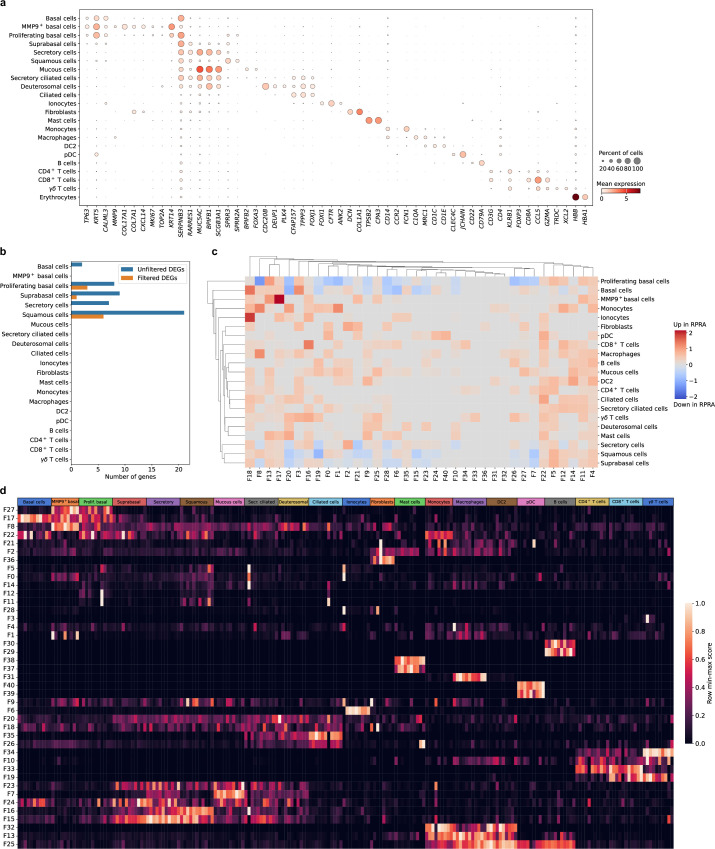
Monocyte-derived alveolar macrophages drive lung injury and fibrosis in murine models and are associated with pulmonary fibrosis in humans. Monocyte-derived alveolar macrophages have been suggested to develop a phenotype that promotes lung repair as injury resolves. We compared single-cell and cytokine profiling of the alveolar space in a cohort of 35 patients with post-acute sequelae of COVID-19 who had persistent respiratory symptoms and abnormalities on a computed tomography scan of the chest that subsequently improved or progressed. The abundance of monocyte-derived alveolar macrophages, their gene expression programs, and the level of the monocyte chemokine CCL2 in bronchoalveolar lavage fluid positively associated with the severity of radiographic fibrosis. Monocyte-derived alveolar macrophages from patients with resolving or progressive fibrosis expressed the same set of profibrotic genes. Our findings argue against a distinct reparative phenotype in monocyte-derived alveolar macrophages, highlighting their utility as a biomarker of failed lung repair and a potential target for therapy.


Conflict of interest statement

G.R.W. reports consultancy agreements and advisory boards with AstraZeneca, Intellia Therapeutics, Pieris Pharmaceuticals, Sanofi, Regeneron and Verona Pharma and has received grant support from the NIH, Department of Defense and Boehringer Ingelheim. He is a cofounder and equity shareholder in Quantitative Imaging Solutions, a company that provides consulting services for image and data analytics. G.R.W.’s spouse works for Biogen. Raul S.J.E. received contracts to serve as the Image Core for studies funded by Lung Biotechnology, Insmed and Gossamer Bio. He has a Sponsored Research Agreement with Boehringer Ingelheim and has served as a consultant for Leuko Labs and Mount Sinai. He is a cofounder and equity shareholder in Quantitative Imaging Solutions. The other authors declare no competing interests.

Figures

Fig. 1
Fig. 1. Patients with RPRA exhibit fibrotic abnormalities on CT imaging that improve with time.
a, Schematic representation of the clinical course and selected diagnostic tests and interventions in 35 patients with RPRA beginning at the time of their diagnosis with COVID-19 (patients RPRA01–RPRA35). Timing of key events such as COVID-19 diagnosis, ICU admission, hospital discharge, intubation, extubation, tracheostomy, first and second CT scans of the chest (CT scans 1 and 2, respectively), bronchoscopy, pulmonary function testing (PFT) and steroid treatment are annotated as symbols on the day of post-COVID-19 diagnosis on which they occurred or as horizontal bars indicating their onset, duration and endpoint in the months post-COVID-19 diagnosis. b, Sankey diagram showing the flow of research or clinical procedures performed or not performed on the cohort analyzed in the present study. These include CT scans 1 and 2, bronchoscopy, BAL fluid flow cytometry (BAL FC), BAL scRNA-seq, measurement of BAL fluid cytokine and chemokine levels (BAL cytokine) and nasal curettage sampling for scRNA-seq (nasal scRNA-seq). c, Quantification of CT scan abnormalities on CT scan 1 in patients with RPRA (n = 35), using a machine learning algorithm and classified as normal lung, fibrotic abnormalities, inflammatory abnormalities, nodularity and emphysema or cysts (Extended Data Table 3). d, Changes in radiographic abnormalities between CT scan 1 and CT scan 2 in patients with RPRA who underwent CT scan 2 (n = 29). Each CT scan is represented by a single point. Scans of the same participant are connected. Adjusted P values are shown above pairs of boxplots when changes were significant (q < 0.05, paired Wilcoxon’s rank-sum tests with FDR correction).
Fig. 2
Fig. 2. Monocyte-derived alveolar macrophages and neutrophils are expanded in patients with RPRA compared with healthy volunteers.
a, Hierarchical clustering of flow cytometry data from BAL fluid samples from patients with RPRA (n = 26), patients with RPRA who subsequently underwent a lung transplantation (n = 2) and healthy controls (n = 10). One of the patients with RPRA who subsequently required a lung transplantation had BAL fluid obtained from each lung separately. Clustering was performed using Ward’s method. Rows are z-scored. CD206hi or CD206lo macrophage (CD206hi or CD206lo MP), plasma cells (PCs). b, Proportions of significantly differentially abundant cells measured by flow cytometry from the same BAL fluid samples as in a (q < 0.05, pairwise Wilcoxon’s rank-sum tests with FDR correction). Padj values are shown above each pair of boxplots. c, Hierarchical clustering of correlation coefficients (Spearman’s ρ) between cell-type abundances measured by flow cytometry in patients with RPRA (n = 28) and the features identified in their CT scan 1 as in Fig. 1c. Clustering was performed using Ward’s method. Correlation coefficients are shown only when the association was significant (q < 0.05, permutation tests with FDR correction).
Fig. 3
Fig. 3. Ongoing recruitment of profibrotic monocyte-derived alveolar macrophages is associated with fibrotic abnormalities on CT scans.
a, Uniform manifold approximation and projection (UMAP) plot showing integrated analysis of BAL immune cells from patients with RPRA (n = 24) and healthy volunteers (n = 6). Tissue-resident alveolar macrophages (TRAM), monocyte-derived alveolar macrophages (MoAM), type I conventional DCs (DC1), type II conventional DCs (DC2), migratory dendritic cells (migratory DC) and plasmacytoid dendritic cells (pDC). b, UMAP as in a with cells originating from patients with RPRA or healthy controls. c, Expression of SPP1 and FABP4 on the UMAP plot in a. d, Dot plot showing the expression of marker genes for subsets of monocyte-derived alveolar macrophages in the UMAP plot in a. e, Proportions of significantly differentially abundant cell clusters represented in the UMAP in a (q < 0.05, pairwise Wilcoxon’s rank-sum tests with FDR correction). Padj values are shown above each pair of boxplots. f, Hierarchical clustering on correlation coefficients (Spearman’s ρ) between cell-type abundances determined using scRNA-seq in the patients with RPRA (n = 24) as in a and features identified in CT scan 1 as in Fig. 1c. Correlation coefficients are shown only when the association was significant (q < 0.05, permutation tests with FDR correction). Clustering was performed using Ward’s method. g, Comparison between abundance of TRAM-2 and MoAM-1 cell subsets and the fraction of normal and fibrotic lung, respectively, in patients with RPRA (n = 24) as identified by CT scan 1 in Fig. 1c. Only significant associations are shown, with the correlations (Spearman’s ρ) and Padj values or FDR-adjusted q values shown on each plot. Linear models and 95% confidence intervals (CIs) are shown.
Fig. 4
Fig. 4. Gene programs associated with pulmonary fibrosis in monocyte-derived alveolar macrophages are associated with radiographic abnormalities in patients with RPRA.
a, Heatmap of scores for selected Spectra programs within monocyte (Mo-1 and Mo-2) and macrophage clusters (MoAM-1 to MoAM-4; TRAM-1 to TRAM-7; proliferating MPs (prolif. MPs) and perivascular MPs (periv. MPs)) identified in BAL fluid scRNA-seq data from patients with RPRA (n = 24) and healthy controls (n = 6) as in Fig. 3a. Each column represents a single subject. Rows are scaled minmum to maximum (min–max). b, Correlations (Spearman’s ρ) between Spectra participant scores and CT features in MoAM-2 and MoAM-4 and TRAM-6 and TRAM-7, as in Fig. 3a. Only significant associations are shown (q < 0.05, permutation tests with FDR correction). Padj values and correlation coefficients are annotated on each plot. c, Hierarchical clustering on the signal/noise ratio of Spectra participant scores between patients with RPRA (n = 24) and healthy controls (n = 6). Factors that are differentially expressed (q < 0.05, Wilcoxon’s rank-sum test on subject scores with FDR correction) are indicated with an asterisk. d, Barplot showing the number of DEGs between different cell types in the BAL fluid in patients with RPRA (n = 24) and healthy controls (n = 6) (q < 0.05, Wald’s test with FDR correction) with and without filtering criteria applied for DEGs. e, DEGs in TRAM-1 cluster. FC, fold-change; NS, not significant (q > 0.05).
Fig. 5
Fig. 5. Monocyte-derived alveolar macrophages show similar transcriptomic signatures in patients with resolving or nonresolving RPRA.
a, Expression of genes from Spectra programs F0, F5, F9 and F43 within monocyte (Mo-1 and Mo-2) and macrophage clusters (MoAM-1 to MoAM-4, TRAM-1 to TRAM-7, prolif. MPs and periv. MPs) identified from BAL fluid scRNA-seq data of patients with RPRA (n = 24) and healthy controls (n = 6) as in Fig. 3a. Each column represents a single subject. Genes with weights >0.0002 were retained. Rows are scaled minimum to maximum and hierarchically clustered. b, Principal component analysis (PCA) of pseudobulk gene expression in cluster MoAM-1 from patients with resolving (n = 15) and those with nonresolving (n = 5) RPRA as defined by serial CT scans of the chest. c, Top, schematic of transfer learning approach to harmonize macrophage labels across three datasets in which the scArches model was trained on scRNA-seq data from patients with IPF and lung transplant donors (GEO accession no. GSE122960) and labels projected on to data from the present study (accession no. GSE232627) and data from patients with end-stage pulmonary fibrosis secondary to COVID-19 and two controls (accession no. GSE158127). Bottom, Sankey diagram illustrating mapping of macrophage cluster labels identified in the patients with RPRA in the present study (accession no. GSE232627; n = 24) and labels transferred from patients with IPF (n = 4) and donor lungs (controls, n = 8) (accession no. GSE122960). d, Combined heatmap showing expression of genes from Spectra programs F0, F5, F9 and F43 in alveolar macrophages from patients with RPRA in the present study (accession no. GSE232627; n = 24), patients with IPF (n = 4) and donor lungs (controls, n = 8) (accession no. GSE122960), and patients with end-stage pulmonary fibrosis secondary to COVID-19 (n = 3) and donor lungs (controls, n = 2) (accession no. GSE158127). Columns are organized by disease status, macrophage subsets (MP1 to MP6) and dataset (RPRA, IPF and COVID-19-induced lung fibrosis). Genes with weights >0.0002 were retained. Rows are scaled minmum to maximum and are hierarchically clustered.
Fig. 6
Fig. 6. Cytokines in the BAL fluid in patients with RPRA are produced by monocytes and neutrophils.
a, Hierarchical clustering of 43 (of 71 tested) cytokines detected in the BAL fluid in patients with RPRA (n = 10), patients with severe RPRA requiring lung transplantation (RPRA-T, n = 2) and healthy controls (n = 13). Clustering was performed using Ward’s method. The rows are z-scored. EGF, epidermal growth factor; G-CSF, granulocyte–colony-stimulating factor; LIF, leukemia inhibitory factor; LT-α, lymphotoxin-α; MDC, macrophage-derived cytokine; TARC, thymus and activation-regulated chemokine; TNF, tumor necrosis factor; TSLP, thymic stromal lymphopoietin. b, Expression of 16 cytokines or chemokines that had significantly different expression (q < 0.05, pairwise Wilcoxon’s rank-sum tests with FDR correction) between patients with RPRA (including the two patients who required lung transplantation) and healthy controls. Padj values are shown above each pair of boxplots. c, Hierarchical clustering on correlation coefficients (Spearman’s ρ) between levels of inflammatory cytokines in BAL fluid from patients with RPRA (including the two patients who required lung transplantation; n = 12) and radiographic features from CT scan 1. Clustering was performed using Ward’s method. Correlation coefficients are shown only when the association was significant (q < 0.05, permutation tests with FDR correction). d, Scatter plot of expression of CCL2 and the fibrotic fraction on CT scan 1 in patients with RPRA (n = 12). A linear model and 95% CI are shown. e, Hierarchical clustering of the mean expression levels in patients with RPRA (n = 24) of genes encoding cytokines that differed significantly between patients with RPRA (n = 12) and healthy controls (n = 13). Labels refer to the cell-type clusters identified from scRNA-seq data of 24 patients with RPRA described in Fig. 3a. CCL11 is not shown because it was not expressed in cells sampled via the BAL procedure. Clustering was performed using Ward’s method. The rows are z-scored.
Fig. 7
Fig. 7. Transcriptomic changes in the nasal mucosa do not reflect ongoing inflammation in the distal lung in patients with RPRA.
a, UMAP plot showing integrated scRNA-seq analysis of nasal mucosa from patients with RPRA (n = 5) and healthy controls (n = 6). b, UMAP from a split by patients with RPRA or healthy controls. c, UMAP from a showing individual patients with RPRA (RPRA02, RPRA03 and RPRA05–RPRA07, n = 5) and healthy volunteers (HV11–HV13, HV15–HV17, n = 6). d, Relative cell-type abundance of cell clusters as in a in patients with RPRA (n = 5) and healthy controls (n = 6). No differences are significant (q < 0.05, pairwise Wilcoxon’s rank-sum tests with FDR correction).
Extended Data Fig. 1
Extended Data Fig. 1. Improvement of abnormalities on computed tomography (CT) imaging of the chest does not correlate with time or level of circulating monocytes.
a. Representative CT scans with annotated features from the machine learning algorithm used to analyze the CT images from patients with RPRA. A,E. Cross-sections from subject RPRA22 and RPRA25 on their initial CT scan. B,F. Cross-section from the same patients on their follow-up CT scan. C,G. Colorized annotation of machine-learning classifications for RPRA22 and RPRA25 on their initial CT scan. D,H. Colorized annotation of machine-learning classifications for RPRA22 and RPRA25 on their follow-up CT scan. b. Comparison of the change in normal lung fraction with the interval between the initial and follow-up CT scans in the 29 patients with RPRA who had a second CT scan. The correlation (Spearman’s rho) is small (ρ = 0.011) and is not significant (permutation test, p = 0.955). A linear model and 95% confidence interval are shown. c. Comparison of the change in normal lung fraction with the interval between the initial and follow-up CT scans when limited to patients whose scans improved. The correlation (Spearman’s rho) remains small (ρ = 0.146) and not significant (permutation test, p = 0.513). A linear model and 95% confidence interval are shown. d. Correlation coefficients (Spearman's rho) between CT features and peripheral blood monocyte levels as reported by the clinical laboratory in the 22 patients with RPRA who had a complete blood count (CBC) performed within 14 days of the CT scan. No correlations are significant (q < 0.05, permutation tests with FDR correction). For each subject, the CBC panel closest to the CT scan date was used. e. Comparison of the inflammatory fraction of the initial CT scan with peripheral blood monocyte levels at the time of the initial CT scan in 22 patients with RPRA who had a CBC performed within 14 days of the CT scan. For each subject, the CBC panel closest to the CT scan date was used. Correlation coefficients (Spearman’s rho) and p-values (permutation test) are annotated on each plot. f. Change in absolute monocyte levels between CT scans in the 10 patients with CBC panels within 14 days of both the initial and follow-up CT scans. There is no significant change in absolute monocyte levels (paired Wilcoxon rank-sum test, p = 0.465) between scans.
Extended Data Fig. 2
Extended Data Fig. 2. Comparison of cell populations detected using flow cytometry analysis of BAL fluid from patients with RPRA and healthy controls.
a. Representative gating strategy for flow cytometry. Axis labels indicate laser line (UV, 355 nm; V, 405 nm; B, 488 nm; YG, 552 nm; and R, 640 nm), bandpass filter, fluorochrome and antigen/dye. AM – alveolar macrophages. DCs – dendritic cells. Cells that did not match specific markers in the flow cytometry panel were marked as ‘Other’. b. Proportions of cells in BAL fluid that were not differentially abundant (q < 0.05, pairwise Wilcoxon rank-sum tests with FDR correction) in flow cytometry data from BAL samples from 26 patients with RPRA, 2 patients with RPRA who subsequently underwent lung transplant, and 10 healthy control subjects. c. Comparison of selected cell type abundances measured using flow cytometry with abnormalities detected on the first CT scan from the 28 patients with RPRA described in Fig. 1c. Correlation coefficients (Spearman's rho) are shown along with the q value determined by permutation tests with FDR correction. Shaded areas represent 95% confidence intervals from linear models. Only the inverse association between neutrophil abundance and the proportion of normal lung met a predetermined criteria for significance of q<0.05.
Extended Data Fig. 3
Extended Data Fig. 3. Ongoing recruitment of profibrotic monocyte-derived alveolar macrophages in patients with RPRA.
a–b. UMAP plot showing integrated analysis of BAL immune cells from 24 patients with RPRA and 6 healthy control subjects, split by subject (a), and future requirement for transplant status (b). c. Dot plot showing expression of the genes used as markers to identify cell types in the integrated single-cell RNA-seq object from Fig. 3a. d. Dot plot showing expression of SARS-CoV-2 genes in BAL fluid from each of the 24 patients with RPRA. e. Comparison between cell type abundances determined by flow cytometry and single-cell RNA-seq. Correlation coefficients (Spearman’s rho) are annotated on each plot. f–g. Hierarchical clustering of cell type abundances from BAL samples of 24 patients with RPRA and 6 healthy controls. Neutrophil abundances determined from flow cytometry are included in the analysis (see Methods). Patients are hierarchically clustered (f) or grouped according to the ‘flow cluster’ derived from flow cytometry data in Fig. 2a. (g). Column headers are color-coded by the diagnosis and association with the ‘flow cluster’ derived from flow cytometry data in Fig. 2a. Samples from the two patients with RPRA who subsequently required transplant are coded separately (RPRA-T). Clustering was performed using Ward’s method. Rows are z-scored. h. Proportions of each cell type detected in BAL fluid between 24 patients with RPRA (including patients who required lung transplant) and 6 healthy controls. Significance was assessed using pairwise Wilcoxon rank-sum tests with an FDR correction (* q < 0.05, ** q < 0.01, *** q < 0.001).
Extended Data Fig. 4
Extended Data Fig. 4. Gene programs associated with pulmonary fibrosis in monocyte-derived alveolar macrophages are associated with severity of radiographic abnormalities in patients with RPRA.
a. Heatmap of subject scores for Spectra programs within each cell type for each of 24 patients with RPRA and 6 healthy control subjects. Each column represents a single patient or subject. Rows are min-max scaled and are hierarchically clustered. Labels refer to clusters identified from the single-cell RNA-seq object in Fig. 3a. Tissue-resident alveolar macrophages (TRAM) clusters 1-7, proliferating macrophages (Prolif. MP), monocyte-derived alveolar macrophages (MoAM) clusters 1-4, perivascular macrophages (Periv. MP), monocytes (Mo) cluster 1-2, CD4 T cells (CD4 T) clusters 1,2, CD8 T cells (CD8 T) clusters 1-3, regulatory T cells (Treg), gd T cells and NK cells (gd T, NK), proliferating T cells (Prolif. T), type I conventional dendritic cells (DC1), type II conventional dendritic cells (DC2), migratory dendritic cells (Migr. DC), plasmacytoid dendritic cells (pDC), Mast cells (Mast), plasma cells (Plas.). b. Upset plot showing downregulated differentially expressed genes (DEGs) shared between TRAM subsets. c. Upset plot showing upregulated DEGs shared between TRAM subsets.
Extended Data Fig. 5
Extended Data Fig. 5. Monocyte-derived alveolar macrophages show similar transcriptomic signatures in resolving or non-resolving RPRA.
a. Bar plot showing the number of differentially expressed genes in different cell types between the 15 patients with resolving RPRA compared with the 5 patients with non-resolving RPRA as determined by serial CT imaging (q < 0.05, Wald test with FDR correction with and without filtering criteria). Tissue-resident alveolar macrophages (TRAM) clusters 1-7, proliferating macrophages (Prolif. MP), monocyte-derived alveolar macrophages (MoAM) clusters 1-4, perivascular macrophages (Periv. MP), monocytes (Mo) cluster 1-2, CD4 T cells (CD4 T) clusters 1,2, CD8 T cells (CD8 T) clusters 1-3, regulatory T cells (Treg), γδ T cells and NK cells (γδ T, NK), proliferating T cells (Prolif. T), type I conventional dendritic cells (DC1), type II conventional dendritic cells (DC2), migratory dendritic cells (Migr. DC), plasmacytoid dendritic cells (pDC), Mast cells (Mast), plasma cells (Plas.). b. UMAP plot showing cell type clusters resolved in the single-cell RNA-seq dataset from patients with idiopathic pulmonary fibrosis (IPF) and lung donors (GSE122960). c. Label transfer uncertainty scores between macrophage clusters from IPF dataset (GSE122960) and current dataset (GSE232627). d. Dot plot of top 5 marker genes per cluster in the integrated object from Extended Data Fig. 5b.
Extended Data Fig. 6
Extended Data Fig. 6. BAL fluid cytokines implicate monocyte and neutrophil cytokines and chemokines in RPRA.
a. Levels of the 43 (of 71 tested) cytokines detected in the BAL fluid from 12 patients with RPRA including 2 patients with severe RPRA requiring lung transplantation (RPRA), and 13 healthy control subjects (Healthy). The levels of cytokines and chemokines that did not differ significantly (q < 0.05, pairwise Wilcoxon rank-sum tests with FDR correction) between patients with RPRA and healthy controls are shown. b. Hierarchical clustering of mean expression levels from BAL single-cell RNA-seq data of genes encoding each cytokine or chemokine measured. CCL11 (eotaxin-1), IL20 (IL-20), and CCL21 are not shown as these genes were not expressed in the single-cell RNA-seq data described in Fig. 3a. Clustering was performed using Ward’s method. Columns are z-scored.
Extended Data Fig. 7
Extended Data Fig. 7. Transcriptomic changes in the nasal mucosa do not reflect ongoing inflammation in the distal lung in patients with RPRA.
a. Dot plot showing expression of the selected cell type markers used to identify cell types in the integrated single-cell RNA-seq data from 5 patients with RPRA and 6 healthy control subjects from Fig. 7a. b. Bar plot showing the number of differentially expressed genes in different cell types between 5 patients with RPRA and 6 healthy control subjects (q < 0.05, Wald test with FDR correction) with and without filtering criteria applied. c. Hierarchical clustering on the signal-to-noise ratio of Spectra subject scores between patients with RPRA and healthy controls. No factors were differentially expressed (q < 0.05, Wilcoxon rank-sum test on subject scores with FDR correction). d. Heatmap of subject scores for Spectra programs. Each column represents a single subject. Rows are min-max scaled. MMP9hi basal cells (MMP9+ basal), proliferating basal cells (Prolif. Basal), suprabasal cells (Suprabasal), secretory cells (Secretory), basal cells (Basal), secretory ciliated cells (Secr. Ciliated), deuterosomal cells (Deuterosomal), type II conventional dendritic cells (DC2), plasmacytoid dendritic cells (pDC).

References

    1. Watanabe, S. et al. The role of macrophages in the resolution of inflammation. J. Clin. Invest.129, 2619–2628 (2019). - PMC - PubMed
    1. Grant, R. A. et al. Circuits between infected macrophages and T cells in SARS-CoV-2 pneumonia. Nature10.1038/s41586-020-03148-w (2021). - PMC - PubMed
    1. Watanabe, S. et al. Resetting proteostasis with ISRIB promotes epithelial differentiation to attenuate pulmonary fibrosis. Proc. Natl Acad. Sci. USA118, e2101100118 (2021). - PMC - PubMed
    1. Misharin, A. V. et al. Monocyte-derived alveolar macrophages drive lung fibrosis and persist in the lung over the life span. J. Exp. Med.214, 2387–2404 (2017). - PMC - PubMed
    1. Joshi, N. et al. A spatially restricted fibrotic niche in pulmonary fibrosis is sustained by M-CSF/M-CSFR signalling in monocyte-derived alveolar macrophages. Eur. Respir. J.55, 1900646 (2020). - PMC - PubMed

MeSH terms

Grants and funding