. 2024 Nov;26(11):1845-1859.
doi: 10.1038/s41556-024-01518-4. Epub 2024 Oct 4.

ARF1 compartments direct cargo flow via maturation into recycling endosomes

Affiliations

ARF1 compartments direct cargo flow via maturation into recycling endosomes

Alexander Stockhammer et al. Nat Cell Biol. 2024 Nov.

Abstract

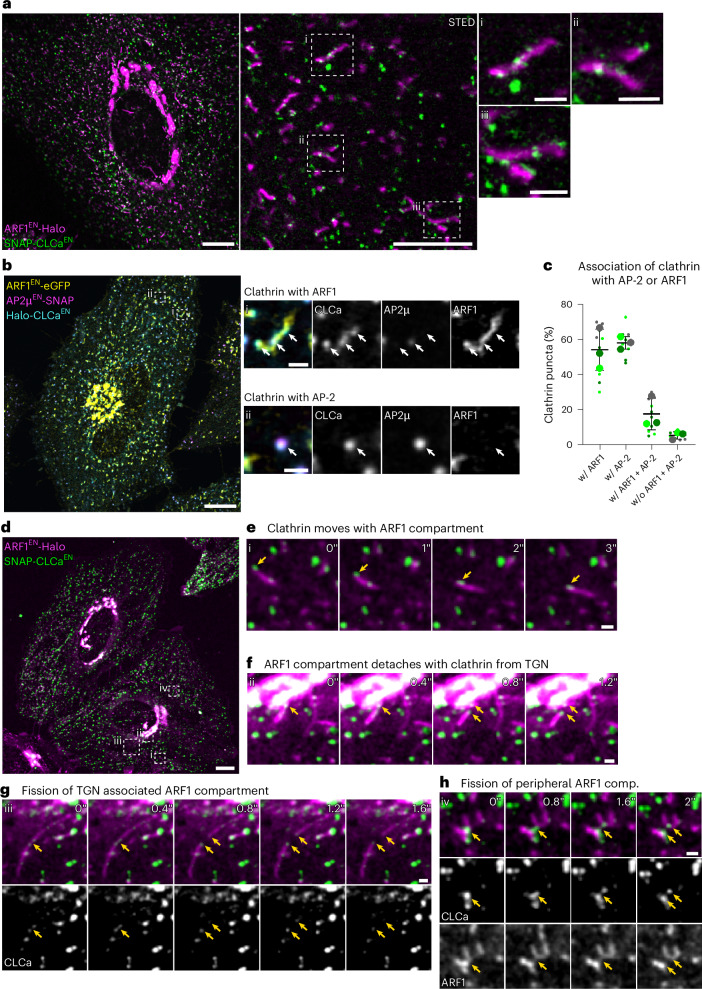
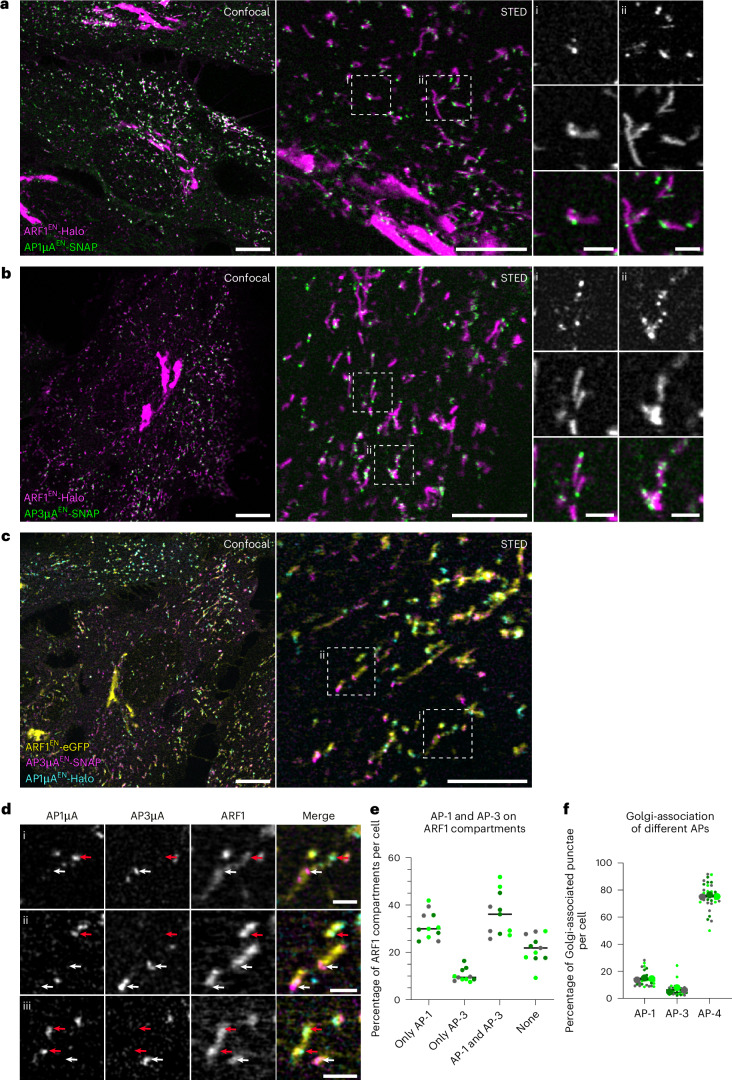
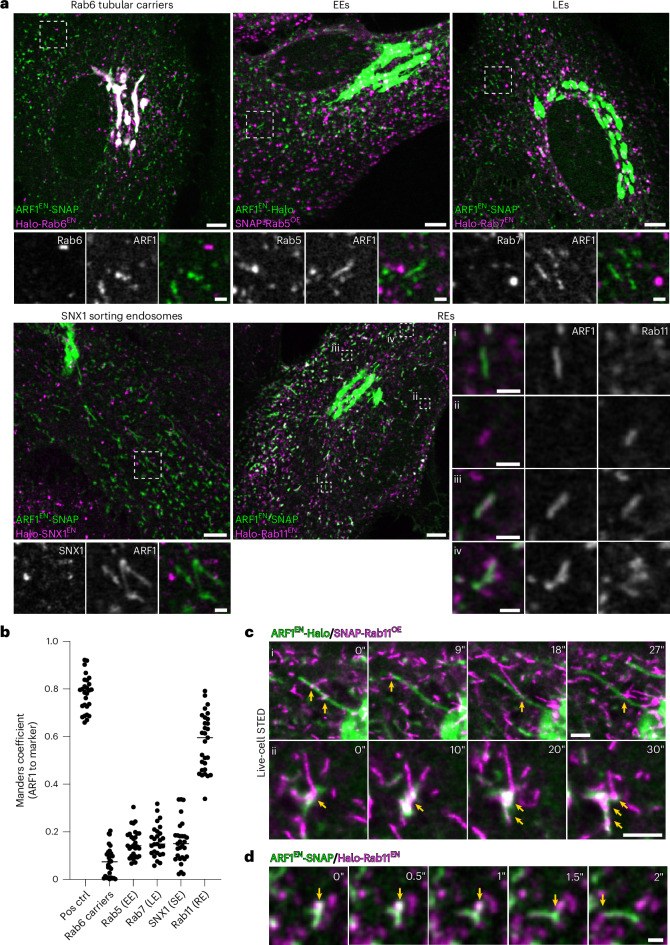
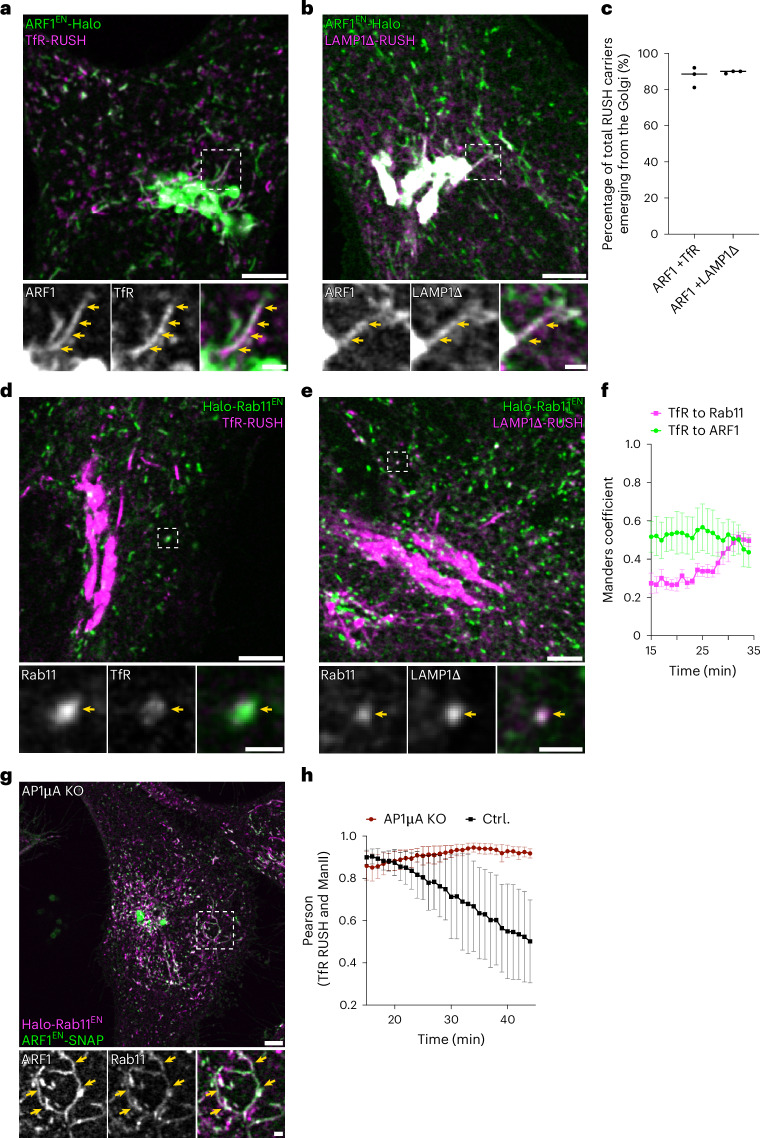
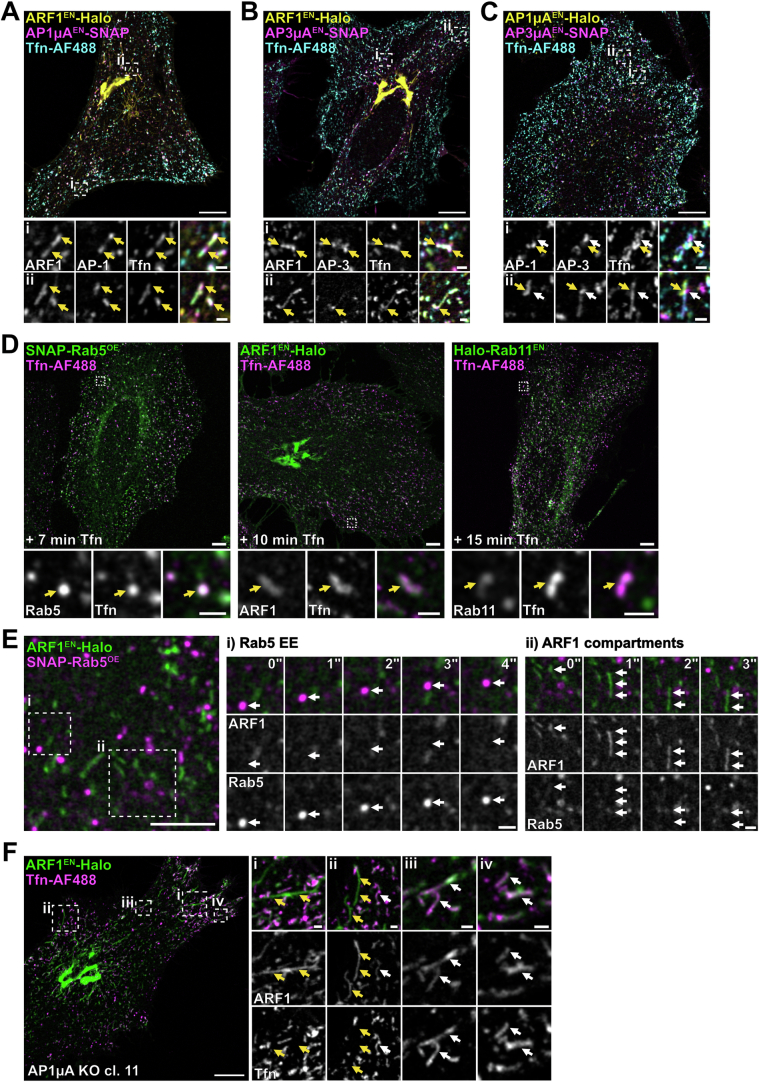
Cellular membrane homoeostasis is maintained via a tightly regulated membrane and cargo flow between organelles of the endocytic and secretory pathways. Adaptor protein complexes (APs), which are recruited to membranes by the small GTPase ARF1, facilitate cargo selection and incorporation into trafficking intermediates. According to the classical model, small vesicles would facilitate bi-directional long-range transport between the Golgi, endosomes and plasma membrane. Here we revisit the intracellular organization of the vesicular transport machinery using a combination of CRISPR-Cas9 gene editing, live-cell high temporal (fast confocal) or spatial (stimulated emission depletion) microscopy as well as correlative light and electron microscopy. We characterize tubulo-vesicular ARF1 compartments that harbour clathrin and different APs. Our findings reveal two functionally different classes of ARF1 compartments, each decorated by a different combination of APs. Perinuclear ARF1 compartments facilitate Golgi export of secretory cargo, while peripheral ARF1 compartments are involved in endocytic recycling downstream of early endosomes. Contrary to the classical model of long-range vesicle shuttling, we observe that ARF1 compartments shed ARF1 and mature into recycling endosomes. This maturation process is impaired in the absence of AP-1 and results in trafficking defects. Collectively, these data highlight a crucial role for ARF1 compartments in post-Golgi sorting.


Conflict of interest statement

Competing interests The authors declare no competing interests.

Figures

Fig. 1
Fig. 1. ARF1 compartments are the major site of non-endocytic clathrin assembly.
a, Live-cell confocal and STED imaging of ARF1EN-Halo/SNAP-CLCaEN HeLa cells labelled with CA-JF571 and BG-JFX650 show association of clathrin to ARF1 compartments. b, Live-cell confocal imaging of ARF1EN-eGFP/AP2µEN-SNAP/Halo-CLCaEN HeLa cells labelled with CA-JF552 and BG-JFX650, highlighting association of (i) non-endocytic clathrin with ARF1 compartments and (ii) endocytic clathrin with AP-2. c, Quantification of clathrin association with ARF1 and/or AP-2. In total, 10 cells from three independent experiments were analysed, replicates are shown in different colours and each small dot represents a single cell, s.d. error bars. df, Time-lapse confocal spinning-disk imaging of ARF1EN-Halo/SNAP-CLCaEN HeLa cells labelled with CA-JF552 and BG-JFX650 (d), highlights movement of clathrin together with ARF1 compartments (e) and detachment of ARF1 compartments from the TGN together with clathrin (f). g,h, Clathrin is found at sites of fission of ARF1 compartments when they detach from the TGN (g) and in the cell periphery (h). Selected frames are shown; a video was taken with a frame rate of 5 frames per second. BG, benzylguanine (SNAP-tag substrate); CA, chloroalkane (HaloTag substrate). Scale bars, 10 µm (confocal overview), 5 µm (STED image in a) and 1 µm (crops). Source numerical data are available in source data. Source data
Fig. 2
Fig. 2. Tubulo-vesicular nature of ARF1 compartments revealed by 3D CLEM.
a, Slice of a confocal z-stack of ARF1EN-Halo/SNAP-CLCaEN HeLa cell labelled with CA-JF552 and BG-JFX650 that was chosen for CLEM. The area that was imaged with FIB-SEM is highlighted with a yellow outline. Segmented ARF1 compartments (i–iii) are shown. b, Overlay of the 3D projection of the confocal stack and FIB-SEM image (green box). FIB-SEM image was obtained with 7 nm isotropic resolution. c, Segmentation of individual ARF1 compartments with clathrin. Shown are 2–3 exemplary slices of the FIB-SEM image, the FIB-SEM image with outlines from the segmented area, overlays of fluorescence of ARF1 and clathrin with the FIB-SEM image, a representative slice of the confocal image of the ARF1 compartments and the 3D rendering from the ARF1 compartments. d, Diagram showing variation in tubule diameter of the ARF1 compartment and the clathrin-coated areas. Data for the diagram was obtained from the three ARF1 compartments shown in c that were measured at different parts of the tubule (100 percentile box plot, tubule: 17 nm minimum, 61 nm centre, 172 nm maximum; clathrin-coated: 66 nm minimum, 78 nm centre, 87 nm maximum). e, Single slices (7 nm increments) of the FIB-SEM dataset, including segmentation, highlight the connection of clathrin-coated and non-coated part of the ARF1 compartment (arrow highlights neck of non-clathrin-coated and clathrin-coated ARF1 compartment). Scale bars, 10 µm (overview in a) and 500 nm (crops in c). Source numerical data are available in source data. Source data
Fig. 3
Fig. 3. Adaptor protein complexes AP-1 and AP-3 define segregated nanodomains on ARF1 compartments.
a,b, Live-cell confocal and STED imaging of ARF1EN-Halo/AP1µAEN-SNAP HeLa cells (a) and ARF1EN-Halo/AP3µAEN-SNAP HeLa cells (b) labelled with CA-JF571 and BG-JFX650 show association of AP-1 and AP-3 to ARF1 compartments. c, Live-cell confocal and STED imaging (two-colour STED imaging with ARF1EN-eGFP imaged in confocal mode) of ARF1EN-eGFP/AP3µAEN-SNAP/AP1µAEN-Halo HeLa cells labelled with CA-JF571 and BG-JFX650 show that AP-1 and AP-3 localize to segregated nanodomains on ARF1 compartments. d, (i) Crops highlight that AP-1 (red arrows) and AP-3 (white arrows) localize to segregated nanodomains on the same compartment. (ii–iii) In addition, ARF1 compartments harbouring either AP-1 or AP-3 are found. e, Quantification of the percentage of ARF1 compartments with specific adaptor identity per cell. In total 11 cells from three independent experiments were analysed, replicates are shown in different colours each dot representing a single cell. f, Quantification of Golgi-associated puncta positive for AP-1, AP-3 and AP-4. In total 30 cells from three independent experiments were analysed for each condition, replicates are shown in different colours and each small dot represents a single cell of the replicate. Scale bars, 10 µm (confocal overview), 5 µm (STED images) and 1 µm (STED crops). Source numerical data are available in source data. Source data
Fig. 4
Fig. 4. AP-1 recruits clathrin to ARF1 compartments and promotes their fission.
a, Live-cell confocal and STED imaging (two-colour STED imaging with ARF1EN-eGFP imaged in confocal mode) of ARF1EN-eGFP/AP1µAEN-SNAP/Halo-CLCaEN HeLa cells labelled with CA-JF571 and BG-JFX650 highlight that clathrin and AP-1 are recruited to the same nanodomains on ARF1 compartments. b, (i–iii) Examples of different compartments and line profiles showing perfect colocalization of AP-1 with clathrin. c, The same analysis on ARF1EN-eGFP/AP3µAEN-SNAP/Halo-CLCaEN HeLa cells labelled with CA-JF571 and BG-JFX650 shows that clathrin and AP-3 do not colocalize on ARF1 compartments. d, (iiii) Examples of different compartments and line profiles. e, Colocalization analysis using the Manders coefficient shows high correlation of AP-1 with clathrin but low correlation of AP-3 with clathrin, comparable with the correlation of AP-1 with AP-3. In total 30 cells from three independent experiments were analysed, replicates are shown in different colours each dot representing a single cell. f, Live-cell confocal imaging shows that AP1µA KO in ARF1EN-Halo/SNAP-CLCaEN HeLa cells labelled with CA-JF552 and BG-JFX650 leads to the formation of aberrant long tubular ARF1 compartments. Clathrin recruitment to the long tubules is reduced but not completely abolished (yellow arrows highlight clathrin nanodomains in crops (i,ii)). g, Quantification of fluorescence intensity of clathrin punctae on peripheral ARF1 compartments normalized to the intensity of Golgi-associated clathrin punctae in control and AP1µA KO HeLa cells. In total 27 cells from three independent experiments were analysed for each condition, replicates are shown in different colours and each dot represents a single cell of the replicate. P value of nested two-sided t-test is 0.0064; **P < 0.01. Scale bars, 10 µm (confocal overview), 5 µm and 1 µm (crops). Source numerical data and unprocessed blots are available in source data. WT, wild type; norm., normalized. Source data
Fig. 5
Fig. 5. ARF1 compartments are sorting compartments with a partial colocalization with the RE marker Rab11.
a, Live-cell confocal microscopy of ARF1EN-SNAP/Halo-Rab6EN (Rab6 secretory carriers), ARF1EN-SNAP/Halo-Rab7EN (LEs), ARF1EN-SNAP/Halo-SNX1EN (SNX1 SEs), ARF1EN-SNAP/Halo-Rab11EN (REs) HeLa cells labelled with BG-JF552 and CA-JFX650 (ARF1 + Rab6/7/11) or BG-JFX650 and CA-JF571 (ARF1 + SNX1). ARF1EN-Halo HeLa cells transiently expressing SNAP-Rab5OE (EEs) were labelled with BG-JFX650 and CA-JF552. Confocal imaging highlights ARF1 compartments devoid of markers for different endosomal compartments and a partial overlap of ARF1 compartments with the RE marker Rab11. In particular we could observe compartments positive (i) for ARF1 only (ii), for Rab11 only (iii), for both ARF1 and Rab11 and (iv) ARF1 compartments in close proximity to REs. b, Colocalization analysis using the Manders coefficient shows higher correlation of ARF1 compartments with REs compared with other tested markers. At least 27 cells from three independent experiments were analysed for each condition, each dot represents a single cell. c, STED microscopy of ARF1EN-Halo HeLa cells transiently expressing SNAP-Rab11OE labelled with CA-JF571 and BG-JFX650 show the dynamic nature of the interaction of ARF1 compartments with REs (sites of interaction indicated with yellow arrows) at the TGN (i) or in the cell periphery (ii). d, Time-lapse confocal spinning-disk imaging in ARF1EN-SNAP/Halo-Rab11EN HeLa cells labelled with CA-JFX650 and BG-JF552 shows ARF1 compartments transiently interacting with different REs (sites of interaction indicated with yellow arrows). Scale bars, 5 µm (overview) and 1 µm (crops, time-lapse). Source numerical data are available in source data. Source data
Fig. 6
Fig. 6. ARF1 compartments mature into Rab11-positive REs.
a, Live-cell confocal microscopy of ARF1EN-mStayGold/Halo-Rab11EN HeLa cells labelled with CA-JFX650. ARF1 compartments are seen to shed ARF1 from their membrane and mature into REs. b, Normalized fluorescence intensity of ARF1 and Rab11 signal on maturing endosomal compartments. ARF1 is shed over a short period of 7–9 s. Eleven videos from five different independent biological replicates were analysed, graph shows mean values, s.d. error bars. c, Additional examples of maturation events. Yellow arrows indicate the curved ends of the tubules which uncoat last. Scale bars, 1 µm (crops, time-lapse). Source numerical data are available in source data. Source data
Fig. 7
Fig. 7. Perinuclear ARF1 compartments transport secretory cargoes and loss of AP-1 delays cargo exit from the TGN.
a,b, ARF1EN-Halo HeLa cells transiently expressing the RUSH constructs streptavidin-KDEL/TfR-SBP-SNAP (a) or streptavidin-KDEL/ssSBP-SNAP-LAMP1Δ (b) (w/o QYTI) labelled with CA-JF552 and BG-JFX650 were imaged with confocal microscopy 20 min after addition of biotin with a frame rate of 6 s per frame. A qualitative example shows secretory RUSH cargo leaving the Golgi in ARF1 compartments at 21 min (TfR) or 24 min (LAMP1Δ) post biotin addition. c, Manual quantification of the total RUSH cargo carriers emerging from the Golgi reveals that most secretory RUSH cargo exits via ARF1 compartments, each dot represents a single cell. d,e, Live-cell confocal imaging of Halo-Rab11EN HeLa cells transiently expressing streptavidin-KDEL/TfR-SBP-GFP labelled with CA-JFX650 (d) and streptavidin-KDEL/ssSBP-SNAP-LAMP1Δ labelled with CA-JF552 and BG-JFX650 (e) shows that secretory RUSH cargo is sorted through REs en route to the PM. A qualitative example is shown at 21 min (TfR) or 24 min (LAMP1Δ) post biotin addition. f, Colocalization analysis using the Manders coefficient shows that correlation of TfR-RUSH cargo with REs increases over time while correlation with ARF1 compartments shows a downward trend. Each dot represents the average of 5 cells. s.e.m. error bars. g, Live-cell confocal imaging of ARF1EN-SNAP/Halo-Rab11EN AP1µA KO HeLa cells labelled with CA-JF552 and BG-JFX650 exhibit formation of long-aberrant Rab11/ARF1 compartments near the TGN. h, Pearson correlation coefficient of secretory TfR-RUSH cargo and the Golgi (masked by the Golgi-marker ManII) reveals that upon AP1µA KO, Golgi exit of secretory cargo is impaired in comparison to control cells, each dot represents the average of four cells, s.d. error bars. Scale bars, 5 µm (overviews) and 1 µm (crops). Source numerical data are available in source data. Source data
Fig. 8
Fig. 8. ARF1 compartments mediate endocytic recycling and direct cargo flow via maturation into REs.
a, Transferrin (Tfn) recycling assays were performed using fluorescently labelled Tfn (Tfn-AlexaFluor488). Live-cell confocal imaging in ARF1EN-Halo HeLa cells labelled with CA-JFX650 shows Tfn in ARF1 compartments 5 min after addition of Tfn. b, Live-cell confocal imaging of ARF1EN-Halo HeLa cells transiently expressing streptavidin-KDEL/TNF-SBP-SNAP labelled with BG-JFX650 and CA-JF552 shows that when performing both RUSH and Tfn recycling assay in parallel, both cargoes are in separate ARF1 compartments: (i) peripheral ARF1 compartments containing only endocytic recycling cargo and (ii) perinuclear ARF1 compartments containing only secretory RUSH cargo. c, Tfn recycling assays using Tfn-AlexaFluor488 were performed in ARF1EN-Halo, Halo-Rab6EN, Halo-Rab11EN HeLa cells and HeLa cells transiently expressing SNAP-Rab5 (SNAP-Rab5OE) labelled with CA-JFX650 or BG-JFX650. Cells were fixed at indicated time points post addition of Tfn to the culture media. Colocalization analysis using the Manders correlation coefficient showed that Tfn first enters EE, then ARF1 compartments and REs. Halo-Rab6EN cells were used as a negative control (neg. ctrl.). Each data point represents the average of 10 cells of two independent experiments, s.e.m. error bars. d, Live-cell confocal microscopy of Tfn recycling using Tfn-AlexaFluor488 in ARF1EN-SNAP/Halo-Rab11EN HeLa cells labelled with BG-JFX552 and CA-JFX650. Tfn-containing ARF1 compartments are seen to shed ARF1 from their membrane and mature into REs. e, Correlation analysis using the Manders coefficient of ARF1 and Tfn in ARF1EN-Halo HeLa cells or ARF1EN-Halo/AP1µA KO HeLa cells shows that Tfn retains longer in ARF1 compartments upon KO of AP1µA. Each dot represents the average of 5 cells, s.d. error bars. f, Live-cell confocal microscopy of Tfn recycling using Tfn-AlexaFluor488 in ARF1EN-Halo/AP1µAEN-SNAP HeLa cells labelled with BG-JFX552 and CA-JFX650. AP-1 localizes to maturing ARF1 compartments that contain Tfn. g, Model illustrating how ARF1 compartments orchestrate cargo flow via maturing into RE. Clathrin-dependent post-Golgi pathways are mediated by two classes of ARF1 compartments that harbour AP nanodomains, allowing for site-specific cargo enrichment. Secretory cargoes flow is mediated by maturation of ARF1 compartments into Rab11-positive REs, whereas retrieval to the Golgi transport would be driven by AP-1 carriers (grey arrow). A segregated Rab6-dependent pathway coordinates direct Golgi-to-PM traffic (magenta arrow). Endocytic cargo is first taken up in Rab5-positive early endosomes. Downstream of Rab5, maturation of ARF1 compartments into Rab11-positive REs would allow recycling of cargoes back to the PM (green arrow). It is unclear whether Rab11-positive endosomes are the last compartment that can fuse with the PM (indicated by ‘?’). Scale bars, 5 µm (overviews ac), 10 µm (overviews in d and f) and 1 µm (crops). Source numerical data are available in source data. Source data
Extended Data Fig. 1
Extended Data Fig. 1. Clathrin is associated to ARF1 compartments in different cell types and fission occurs at sites of clathrin enrichment.
(a-b) Live-cell confocal imaging of ARF1EN-Halo/SNAP-CLCaEN haploid HAP1 cells labelled with CA-JF552 and BG-JFX650 and ARF1EN-SNAP/Halo-CLCaEN Jurkat T cells labelled with CA-JF571 and BG-JFX650 highlight ARF1 compartments decorated by clathrin domains. (c) (i-iv) Multiple examples of time-lapse confocal spinning disk imaging of ARF1EN-Halo/SNAP-CLCaEN HeLa cells labelled with CA-JF552 and BG-JFX650 showing clathrin at the site of fission on ARF1 compartments (yellow arrows highlight the localization of clathrin). Selected frames are shown, movie was taken with a frame rate of 5 frames/s. EN=endogenous, HaloTag substrate CA=chloroalkane, SNAP-tag substrate BG=benzylguanine. Scale bars: 10 µm (overviews) and 1 µm (crops).
Extended Data Fig. 2
Extended Data Fig. 2. Endogenous tagging of AP subunits does not affect AP function.
(a-b) Live-cell confocal imaging of ARF1EN-Halo/AP1γ1EN-SNAP and ARF1EN-Halo/AP3δ1EN-SNAP HeLa cells labelled with CA-JF552 and BG-JFX650 shows that C-terminal tagging of a large subunit of the adaptor complexes leads to comparable association with ARF1 compartments as observed for C-terminal tagging of the µ-subunit. (c-d) Live-cell confocal imaging of AP1µAEN-Halo/AP1γ1EN-SNAP and AP3µAEN-Halo/AP3γ1EN-SNAP HeLa cells labelled with CA-JF552 and BG-JFX650 shows that C-terminal tagging of two subunits of an APs has no effect on the localization of the complexes. (e) Confocal imaging of fixed AP1µAEN-Halo HAP1 cells labelled with CA-JFX650 before fixation and then immunostained with an anti-CHC (clathrin heavy chain) antibody. The recruitment of clathrin to AP-1 domains is unaffected by tagging of AP1µA (yellow arrows indicate domains where CHC and AP1µAEN-Halo colocalize). (f) Quantification of clathrin puncta normalized to the cell area in wild-type (WT) and AP1µAEN-Halo knock-in (KI) HAP1 cells show no change in the number of cytosolic clathrin structures. In total 30 cells from 3 independent experiments for each condition were analysed, replicates are shown in different colours and each dot represents a single cell, SD error bars. (g) Live-cell confocal imaging of ARF1EN-Halo/AP4µEN-eGFP HeLa cells labelled with CA-JFX650 showing AP-4 puncta at the TGN. EN=endogenous, HaloTag substrate CA=chloroalkane, SNAP-tag substrate BG=benzylguanine. Scale bars: 10 µm (overviews) and 1 µm (crops). Source numerical data and unprocessed blots are available in source data. Source data
Extended Data Fig. 3
Extended Data Fig. 3. ARF1 defines a subpopulation of Golgi-derived Rab6 carriers.
(a) Live-cell STED imaging of ARF1EN-SNAP/Halo-Rab6EN HeLa cells labelled with CA-JF571 and BG-JFX650 shows that (i) ARF1 and Rab6 on carriers that form at the TGN whereas (ii) peripheral ARF1 compartments are devoid of Rab6 and (iii) peripheral Rab6 carriers are devoid of ARF1. (b) Live-cell confocal imaging ARF1EN-SNAP/Halo-Rab6EN HeLa cells labelled with BG-JF552 and CA-JFX650 shows that two distinct populations of Rab6 carriers emerging from the TGN: (i) half of the Rab6 carriers are devoid of ARF1 and (ii) half are marked by ARF1. Carriers emerging from the Golgi were counted manually from 3 different cells. (c) Live-cell confocal imaging of ARF1EN-SNAP/Halo-Rab6EN/AP1µAEN-mStayGold HeLa cells labelled with BG-JF552 and CA-JFX650 shows that AP-1 only localizes to (i) ARF1/Rab6 double-positive carriers and (ii) ARF1 only but not to (iii) Rab6 only carriers. EN=endogenous, HaloTag substrate CA=chloroalkane, SNAP-tag substrate BG=benzylguanine. Scale bars: 5 µm (overview) and 1 µm (crops). Source numerical data are available in source data. Source data
Extended Data Fig. 4
Extended Data Fig. 4. AP-1 and clathrin are recruited by ARF1 to RE membranes.
(a) Live-cell STED microscopy of CLCaEN-SNAP/Halo-Rab11EN HeLa cells labelled with CA-JFX650 and BG-JF585 highlights (i) close proximity of clathrin-coated structures to a RE and (ii) a RE devoid of clathrin. (b) Live-cell STED imaging of ARF1EN-eGFP/Halo-Rab11EN/AP1µAEN-SNAP HeLa cells (two-colour STED imaging with ARF1EN-eGFP imaged in confocal mode) labelled with BG-JFX650 and CA-JF571 shows (i) AP-1 on ARF1/Rab11 double-positive compartments, (ii) AP-1 on ARF1 compartments devoid of Rab11, (iii) Rab11-positive RE devoid of AP-1 and separated from ARF1 compartments. (c) Time-lapse confocal spinning disk imaging shows a moving ARF1 compartment that harbours AP-1 domains (yellow arrows) (d) Quantitative colocalization analysis between ARF1, AP-1 and RE. Normalized Manders coefficient shows comparable correlation of AP-1 to RE and ARF1 to RE, whereas correlation of AP-1 to ARF1 is significantly higher. Five replicates are shown in different colours each small dot representing a single cell of the replicate. P value of an unpaired two-tailed t-test is 0.0023, **P < 0.01. EN=endogenous, HaloTag substrate CA=chloroalkane, SNAP-tag substrate BG=benzylguanine. Scale bars: 1 µm. Source numerical data are available in source data. Source data
Extended Data Fig. 5
Extended Data Fig. 5. ARF1 compartments transiently interact with REs.
(a) Live-cell STED microscopy of ARF1EN-SNAP/Halo-Rab11EN HeLa cells labelled with CA-JF571 and BG-JFX650 highlights ARF1 compartments and REs at nanoscale resolution. Line profile showing close association of ARF1 compartments and REs. (b) Live-cell STED imaging of ARF1EN-SNAP/Halo-Rab11EN HeLa cells labelled with CA-JF571 and BG-JFX650 shows transient interaction of a peripheral ARF1 compartments and REs. Fixed-cell 3D-STED microscopy highlights close proximity of a single ARF1 compartment to multiple REs. (c) Live-cell confocal imaging of ARF1EN-eGFP/Halo-Rab11EN/AP1µAEN-SNAP HeLa cells labelled with CA-JFX650 and BG-JF552 shows AP-1 at the interface of ARF1 compartment and RE located in the (i) periphery and (ii) perinuclear area of the cell. EN=endogenous, HaloTag substrate CA=chloroalkane, SNAP-tag substrate BG=benzylguanine. Scale bars: 10 µm (confocal overview), 5 µm (STED overview) and 1 µm (z-stack, crops and time-lapse), Δz=0,2 µm.
Extended Data Fig. 6
Extended Data Fig. 6. Perinuclear ARF1 compartments mediate secretory transport.
(a) Live-cell confocal imaging of ARF1EN-Halo HeLa cells transiently expressing (i) Streptavidin-li/ssSBP-eGFP-VSV-G (labelled with CA-JFX650) or (ii) Streptavidin-KDEL/ssSBP-SNAP (soluble SNAP (sSNAP), labelled with BG-JFX650 and CA-JF552) highlights the transmembrane (VSV-G) and soluble RUSH cargo in ARF1 compartments. Image taken at 21 min (VSV-G) and 52 min (sSNAP) after addition of biotin. (b) Live-cell confocal imaging of ARF1EN-Halo/SNAP-CLCaEN HeLa cells transiently expressing (i) Streptavidin-KDEL/TfR-SBP-eGFP or (ii) Streptavidin-KDEL/TNFα-SBP-eGFP labelled with BG-JFX650 and CA-JF552 highlights transmembrane RUSH cargo (TfR, TNFα) in ARF1 compartments decorated by clathrin (yellow arrows highlight clathrin on ARF1 compartments). Images were taken (i) 20 min and (ii) 16 min after addition of biotin. (c) Live-cell confocal imaging of AP3µAEN-Halo HeLa cells transiently expressing Streptavidin-KDEL/TfR-SBP-eGFP labelled with CA-JFX650 show that RUSH carriers are devoid of AP-3. Image taken 23 min after addition of biotin. (d) Live-cell confocal time-lapses of ARF1EN-Halo HeLa cells transiently expressing Streptavidin-KDEL/TfR-SBP-SNAP labelled with BG-JFX650 and CA-JF552 show ARF1 compartments decorated by TfR-RUSH detaching from the Golgi and moving away (highlighted by a yellow arrow). The first frame was taken at 23 min after addition of biotin. (e) Live-cell confocal imaging of Halo-Rab11EN HeLa cells transiently expressing (i) Streptavidin-li/ssSBP-eGFP-VSV-G (labelled with CA-JFX650) or (ii) Streptavidin-KDEL/ssSBP-SNAP (labelled with BG-JFX650 and CA-JF552) highlights the transmembrane (VSV-G) and soluble (sSNAP) RUSH cargo localization to recycling endosomes. Image taken at 25 min (VSV-G) and 70 min (sSNAP) after addition of biotin. (f) Live-cell confocal imaging of ARF1EN-Halo/AP1µA KO HeLa cells transiently expressing (i) Streptavidin-KDEL/TfR-SBP-SNAP (ii) Streptavidin-KDEL/TfR-SBP-eGFP or (iii) Streptavidin-KDEL/TNFα-SBP-SNAP labelled with (i, iii) BG-JFX650 and CA-JF552 or (ii) CA-JFX650 show transmembrane RUSH cargo in aberrant elongated ARF1 compartments. (i-iii) Different CRISPR-Cas9 KO clones display the same phenotype. Images taken (i) 32 min or (ii) 25 min or (iii) 30 min after addition of biotin. EN=endogenous, HaloTag substrate CA=chloroalkane, SNAP-tag substrate BG=benzylguanine, ss=signal sequence. Scale bars: 5 µm (confocal overviews), 1 µm (crops).
Extended Data Fig. 7
Extended Data Fig. 7. Peripheral ARF1 compartments mediate endocytic recycling of Tfn and are not derived from early endosomes.
Live-cell confocal imaging of fluorescently labelled Tfn (Tfn-AlexaFluor488) in different KI and KO HeLa cells. (a-b) ARF1EN-Halo/AP1µAEN-SNAP and ARF1EN-Halo/AP3µAEN-SNAP HeLa cells labelled with CA-JF552 and BG-JFX650. Fluorescent transferrin localizes to ARF1 compartments harbouring AP-1 and AP-3 domains (yellow arrows). (c) AP1µAEN-Halo/AP3µAEN-SNAP HeLa cells labelled with CA-JF552 and BG-JFX650. Fluorescent transferrin localizes to ARF1 compartments harbouring AP-1 (yellow arrows) and AP-3 (white arrows) domains. (d) Tfn recycling assays using Tfn-AlexaFluor488 were performed in ARF1EN-Halo, Halo-Rab6EN, Halo-Rab11EN HeLa cells and Hela cells transiently expressing SNAP-Rab5 (SNAP-Rab5OE) labelled with CA-JFX650 or BG-JFX650. Cells were fixed at indicated timepoints post addition of Tfn to the culture media. Exemplary images showing colocalization of Tfn with Rab5 (7 mins post Tfn addition), ARF1 (10 mins) and Rab11 (15 mins). (e) Live-cell confocal imaging of gene-edited ARF1EN-Halo HeLa cells transiently overexpressing SNAP-Rab5OE labelled with CA-JF503 and BG-JFX650. ARF1 compartments are not derived from early endosomes (EE) and (i) Rab5 positive EE and (ii) ARF1 compartments move independently. (f) ARF1EN-Halo/AP1µA KO HeLa cells labelled with CA-JFX650. Tfn fills ARF1 compartments which morphology is unaffected upon loss of AP1µA. (i-ii) yellow arrows highlight aberrant elongated ARF1 compartments devoid of Tfn. (ii-iv) white arrows highlight shorter ARF1 compartments filled with Tfn. EN=endogenous, HaloTag substrate CA=chloroalkane, SNAP-tag substrate BG=benzylguanine. Scale bars: 10 µm (A-C, E overviews), 5 µm (D overviews), 1 µm (crops).

Similar articles

Cited by

References

    1. Robinson, M. S. Forty years of clathrin-coated vesicles. Traffic16, 1210–1238 (2015). - PubMed
    1. Ford, C., Parchure, A., von Blume, J. & Burd, C. G. Cargo sorting at the trans-Golgi network at a glance. J. Cell Sci.134, jcs259110 (2021). - PMC - PubMed
    1. Traub, L. M., Ostrom, J. A. & Kornfeld, S. Biochemical dissection of AP-1 recruitment onto Golgi membranes. J. Cell Biol.123, 561–573 (1993). - PMC - PubMed
    1. Ooi, C. E., Dell’Angelica, E. C. & Bonifacino, J. S. ADP-ribosylation factor 1 (ARF1) regulates recruitment of the AP-3 adaptor complex to membranes. J. Cell Biol.142, 391–402 (1998). - PMC - PubMed
    1. Ren, X., Farías, G. G., Canagarajah, B. J., Bonifacino, J. S. & Hurley, J. H. Structural basis for recruitment and activation of the AP-1 clathrin adaptor complex by Arf1. Cell152, 755–767 (2013). - PMC - PubMed

Publication types

LinkOut - more resources