

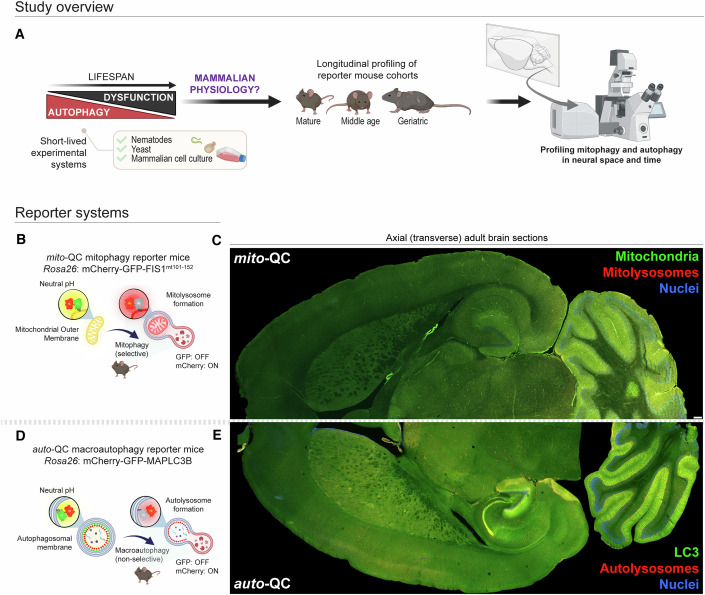
Longitudinal autophagy profiling of the mammalian brain reveals sustained mitophagy throughout healthy aging
- PMID: 39367235
- PMCID: PMC11612485
- DOI: 10.1038/s44318-024-00241-y
Longitudinal autophagy profiling of the mammalian brain reveals sustained mitophagy throughout healthy aging
Abstract
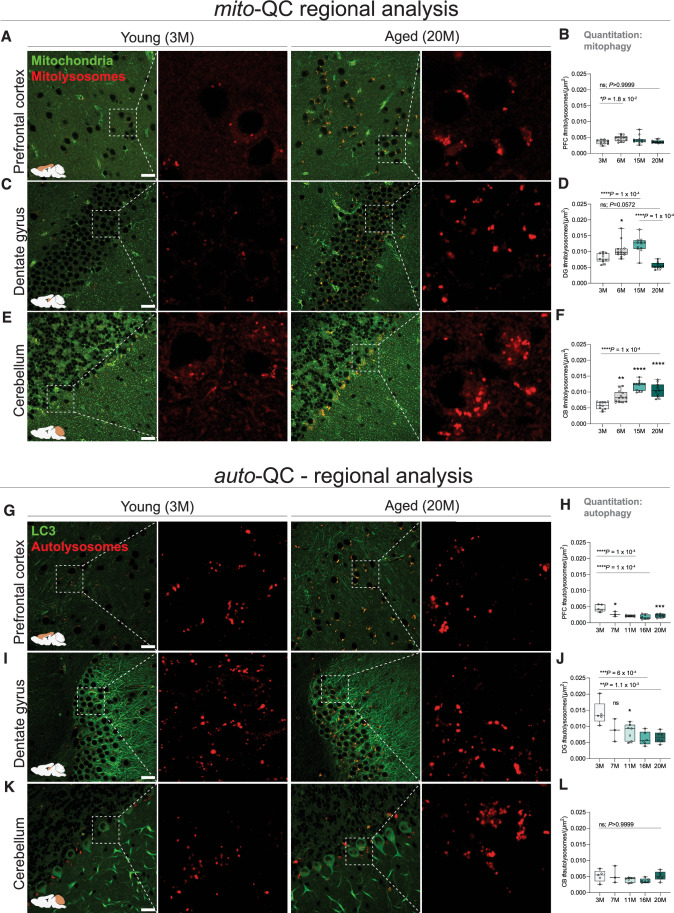
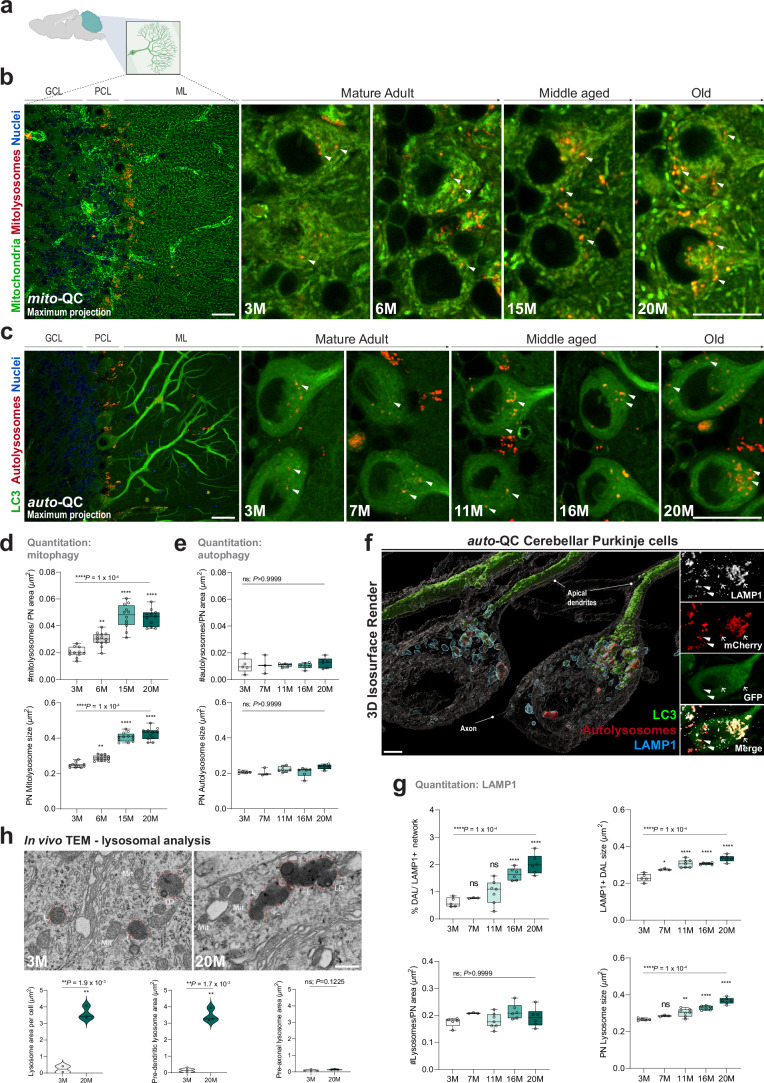
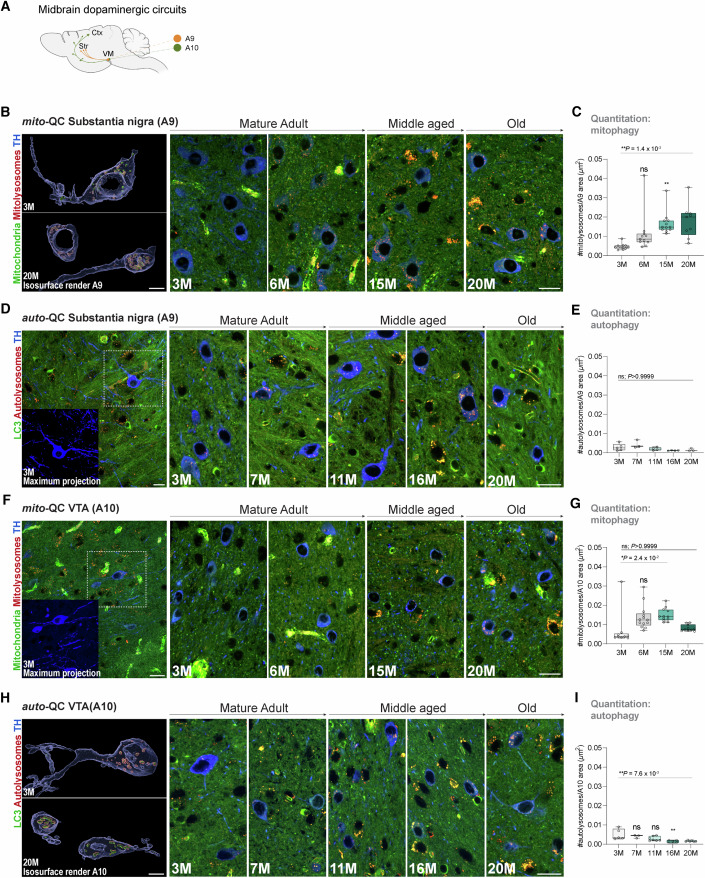
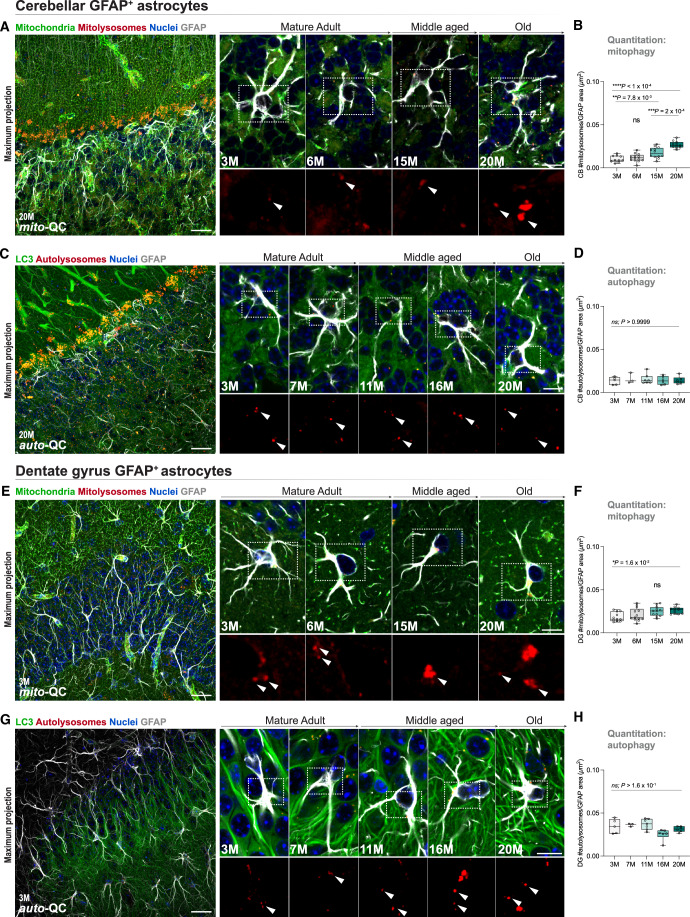
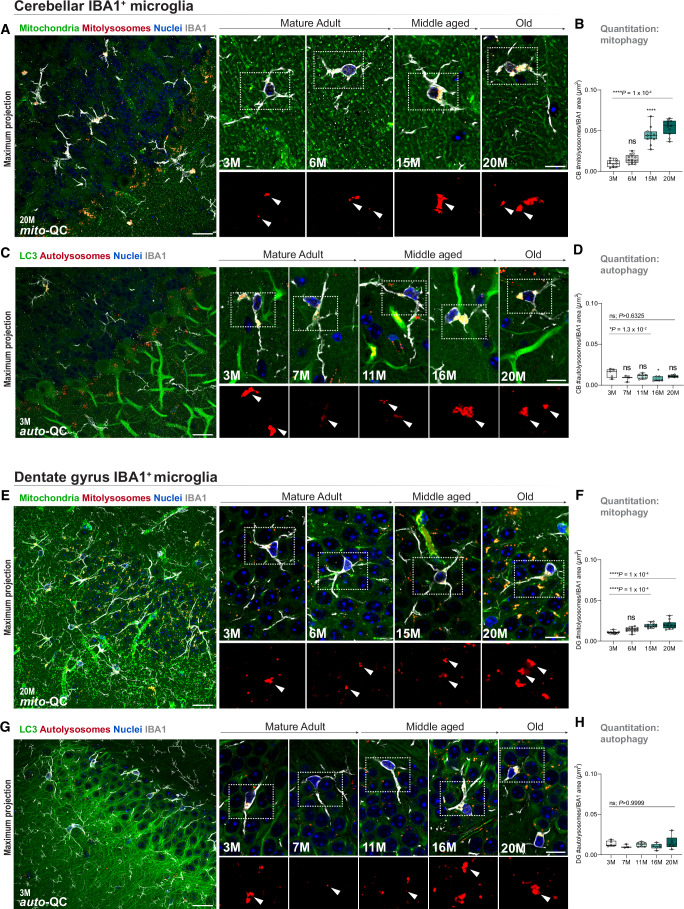
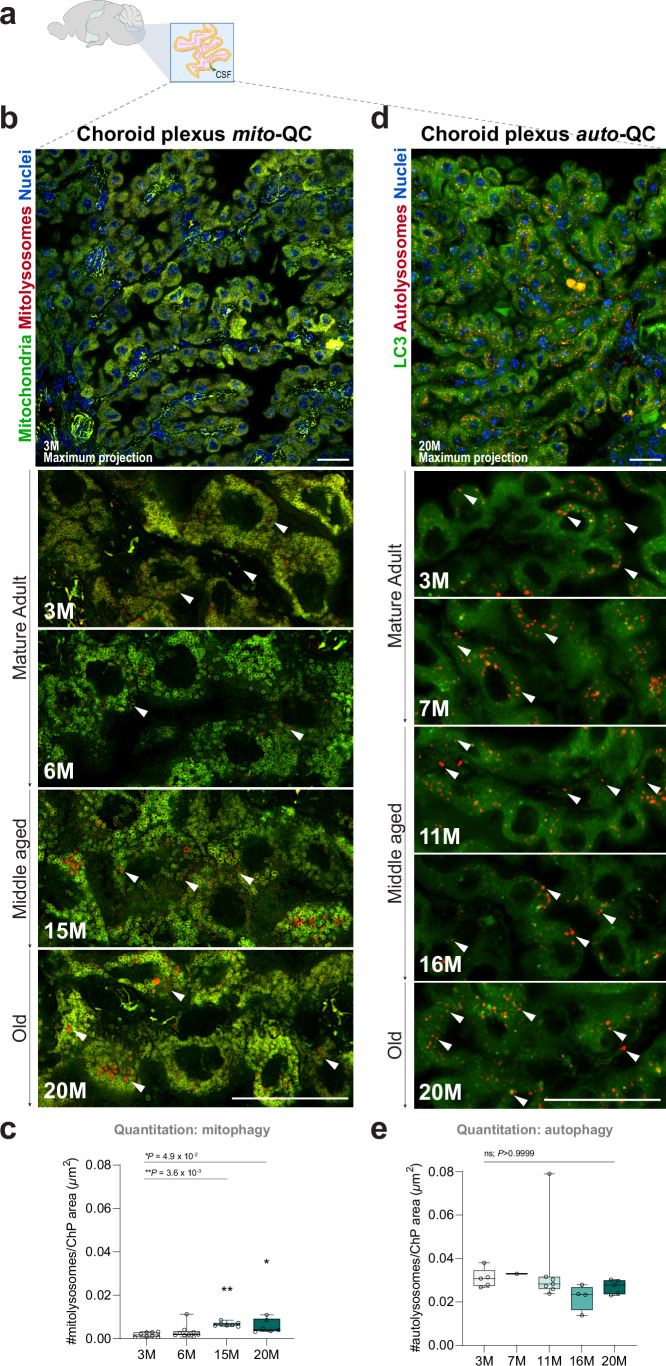
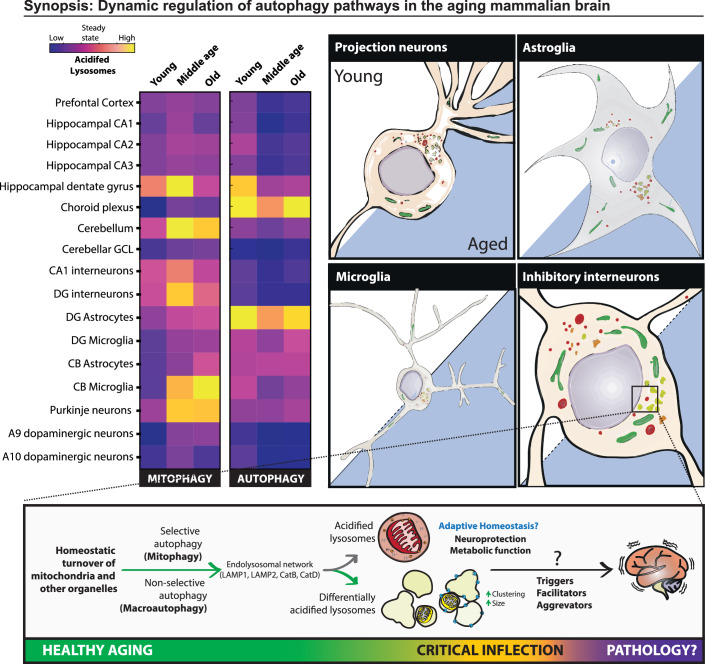
Mitophagy neutralizes mitochondrial damage, thereby preventing cellular dysfunction and apoptosis. Defects in mitophagy have been strongly implicated in age-related neurodegenerative disorders such as Parkinson's and Alzheimer's disease. While mitophagy decreases throughout the lifespan of short-lived model organisms, it remains unknown whether such a decline occurs in the aging mammalian brain-a question of fundamental importance for understanding cell type- and region-specific susceptibility to neurodegeneration. Here, we define the longitudinal dynamics of basal mitophagy and macroautophagy across neuronal and non-neuronal cell types within the intact aging mouse brain in vivo. Quantitative profiling of reporter mouse cohorts from young to geriatric ages reveals cell- and tissue-specific alterations in mitophagy and macroautophagy between distinct subregions and cell populations, including dopaminergic neurons, cerebellar Purkinje cells, astrocytes, microglia and interneurons. We also find that healthy aging is hallmarked by the dynamic accumulation of differentially acidified lysosomes in several neural cell subsets. Our findings argue against any widespread age-related decline in mitophagic activity, instead demonstrating dynamic fluctuations in mitophagy across the aging trajectory, with strong implications for ongoing theragnostic development.
Keywords: Aging; Autophagy; Brain; Mitochondria; Mitophagy.
© 2024. The Author(s).
Conflict of interest statement
Disclosure and competing interests statement. The authors declare no competing interests.
Figures


References
-
- Björklund A, Dunnett SB (2007) Dopamine neuron systems in the brain: an update. Trends Neurosci 30:194–202 - PubMed
MeSH terms
Grants and funding
LinkOut - more resources
Full Text Sources
Molecular Biology Databases
