. 2024 Nov;56(11):2434-2446.
doi: 10.1038/s41588-024-01929-x. Epub 2024 Oct 4.

Multiomic profiling identifies predictors of survival in African American patients with acute myeloid leukemia

Andrew Stiff #  1 Maarten Fornerod #  2 Bailee N Kain #  3 Deedra Nicolet  1   4   5 Benjamin J Kelly  6 Katherine E Miller  6   7 Krzysztof Mrózek  1   5 Isaiah Boateng  1 Audrey Bollas  6 Elizabeth A R Garfinkle  6 Omolegho Momoh  8 Foluke A Fasola  9 Hannah O Olawumi  10 Nuria Mencia-Trinchant  11 Jean F Kloppers  12   13 Anne-Cecilia van Marle  12   13 Eileen Hu  1   14 Saranga Wijeratne  6 Gregory Wheeler  6 Christopher J Walker  1 Jill Buss  1   5 Adrienne Heyrosa  1   5 Helee Desai  1   5 Andrea Laganson  1   5 Ethan Hamp  1   5 Yazan Abu-Shihab  1   5 Hasan Abaza  1   5 Parker Kronen  1 Sidharth Sen  15 Megan E Johnstone  16 Kate Quinn  16 Ben Wronowski  16 Erin Hertlein  16 Linde A Miles  17 Alice S Mims  1   18 Christopher C Oakes  1   18 James S Blachly  1   18 Karilyn T Larkin  1   18 Bethany Mundy-Bosse  1   18 Andrew J Carroll  19 Bayard L Powell  20 Jonathan E Kolitz  21 Richard M Stone  22 Cassandra Duarte  23 Diana Abbott  23 Maria L Amaya  23 Craig T Jordan  23 Geoffrey L Uy  24 Wendy Stock  25 Kellie J Archer  26 Electra D Paskett  1   27 Monica L Guzman  11   28 Ross L Levine  29 Kamal Menghrajani  29 Debyani Chakravarty  29 Michael F Berger  29 Daniel Bottomly  30 Shannon K McWeeney  30 Jeffrey W Tyner  30 John C Byrd  16 Nathan Salomonis  3 H Leighton Grimes  3 Elaine R Mardis  31   32 Ann-Kathrin Eisfeld  33   34   35
Affiliations

Multiomic profiling identifies predictors of survival in African American patients with acute myeloid leukemia

Andrew Stiff et al. Nat Genet. 2024 Nov.

Abstract

Genomic profiles and prognostic biomarkers in patients with acute myeloid leukemia (AML) from ancestry-diverse populations are underexplored. We analyzed the exomes and transcriptomes of 100 patients with AML with genomically confirmed African ancestry (Black; Alliance) and compared their somatic mutation frequencies with those of 323 self-reported white patients with AML, 55% of whom had genomically confirmed European ancestry (white; BeatAML). Here we find that 73% of 162 gene mutations recurrent in Black patients, including a hitherto unreported PHIP alteration detected in 7% of patients, were found in one white patient or not detected. Black patients with myelodysplasia-related AML were younger than white patients suggesting intrinsic and/or extrinsic dysplasia-causing stressors. On multivariable analyses of Black patients, NPM1 and NRAS mutations were associated with inferior disease-free and IDH1 and IDH2 mutations with reduced overall survival. Inflammatory profiles, cell type distributions and transcriptional profiles differed between Black and white patients with NPM1 mutations. Incorporation of ancestry-specific risk markers into the 2022 European LeukemiaNet genetic risk stratification changed risk group assignment for one-third of Black patients and improved their outcome prediction.


Conflict of interest statement

C.J.W. is a consultant for Vigeo Therapeutics and is employed by Karyopharm Therapeutics; he has ownership interest in Karyopharm Therapeutics and Bristol Myers Squibb Co. A.S.M. has served in a consulting or advisory role for AbbVie, Bristol Meyers Squibb, Novartis and Treadwell Therapeutics; he has served on a data monitoring safety committee for Daiichi Sankyo and Foghorn Therapeutics and currently serves as a Senior Medical Director for the Leukemia and Lymphoma Society Beat AML Study. J.S.B. is a consultant and advisory board member for AbbVie, AstraZeneca, Syndax, INNATE and KITE. B.L.P. has received honoraria from Jazz Pharmaceuticals, Novartis and Pfizer. J.F.K. has received honoraria from Gilead, Magellan and Novartis; consulting fees from Gilead, Magellan, Novartis, Pharmacyclics and Seattle Genetics; institutional research funding from Boehringer Ingelheim, Cantex, Erytech and Millennium; and travel support from Gilead, Novartis and Seattle Genetics. R.M.S. has served on independent data safety monitoring committees for trials supported by Celgene, Takeda and Argenx; has consulted for AbbVie, Actinium, Agios, Amgen, Arog, Astellas, AstraZeneca, BioLineRx, Celgene, Daiichi Sankyo, Fujifilm, Janssen, Juno, Macrogenics, Novartis, Ono, Orsenix, Pfizer, Roche, Stemline Therapeutics, Sumitomo, Takeda and Trovagene; and has received research support (to his institution) for clinical trials sponsored by AbbVie, Agios, Arog and Novartis. E.D.P. has received grants from the Merck Foundation and Pfizer. M.L.G. holds research contracts and consults with Bridge Medicines and holds stock options for SeqRx. M.F.B. has a consultancy role with AstraZeneca, Eli Lilly and Paige.AI and has received research support from Boundless Bio. J.C.B. has a consultancy and advisory role with Syndax, Novartis and Vincera; research funding from Pharmacyclics, an AbbVie company, Genentech, Janssen and Acerta; and ownership for Vincera. E.R.M. has received research support (to her institution) from Pfizer, the Merck Foundation, Genentech, Guardant Health and Astra Zeneca; and has served as an advisory board member for GSK and Merck, and as member of the Board of Directors of the Alliance Foundation and American Association for Cancer Research. R.L.L. is on the supervisory board of QIAGEN and is a scientific adviser to Imago, Mission Bio, Syndax, Zentalis Pharmaceuticals, Ajax, Bakx, Auron, Prelude, C4 Therapeutics and Isoplexis, for which he receives equity support. R.L.L. receives research support from Ajax and Abbvie and has consulted for Incyte, Janssen, MorphoSys and Novartis. He has received honoraria from AstraZeneca and Incyte for invited lectures. A.-K.E. has received a research grant from Novartis, and an honorarium from AstraZeneca for serving on their Diversity, Equity and Inclusion Advisory Board; her spouse has ownership interest in Karyopharm Therapeutics. The other authors declare no completing interests.

Figures
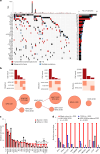
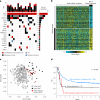
Fig. 1
Fig. 1. Mutational landscape of Black patients with AML who were treated on CALGB/Alliance study protocols.
a, Oncoprint showing mutations detected in 4% or more of Black patients by WES. b, Clonality of driver mutations detected in three Black patients with AML, identified using scDNA-seq. c, Difference in mutation percentage between white (Beat AML) and Black patients in genes mutated in 4% or more of Black patients. The P value was calculated using a two-sided Fisher’s exact test. d, Mutation percentage for genes mutated in 4% of Black patients compared with other major AML sequencing studies. TMB, tumor mutational burden.
Fig. 2
Fig. 2. Hitherto unreported mutations in the PHIP gene and depiction of the fusion gene landscape.
a, Schematic of the PHIP gene with location of posttranslational modifications and the location of mutations detected in Black patients by WES. Depicted are PHIP mutations found in the CALGB/Alliance cohort and mutations detected using targeted sequencing in three patients with AML who were diagnosed and treated in Nigeria. b, Circos plot displaying fusion genes detected using RNA-seq-based discovery in Black patients. The width of each arc represents the frequency with numbers indicated in the legend. dbPTM, database of Protein Post-Translational Modifications.
Fig. 3
Fig. 3. Clustering of patients with AML using transcriptome-based gene expression profiling and t-SNE visualization.
a, Clustering of Black and white patients according to gene expression with the presence of major oncogenic driver mutations. The dot color corresponds to the presence of the indicated driver mutation. Black patients are circled. b, Presence of myelodysplasia-related mutations in Black and white patients clustered according to gene expression. The dot color corresponds to the presence of the indicated myelodysplasia-related mutation. c, Similarity of Black and white patient gene expression profiles to a previously published myelodysplasia gene expression signature. d, Age distribution of patients clustered according to gene expression. The dot colors correspond to patient age as indicated in the legend. Black patients are circled. e, Age comparison between Black and white patients with myelodysplasia-related mutations. P values were calculated using a two-sided Wilcoxon rank-sum test (box plots: centerline, median; box limits, first and third quartiles; whiskers, minimum and maximum). ‘-r’ behind a gene symbol indicates fusion genes involving the gene indicated and other partner gene(s). CEBPA bZIP, in-frame mutations affecting the basic leucine zipper (bZIP) region of the CEBPA gene; MDS, myelodysplastic syndrome; NS, not significant.
Fig. 4
Fig. 4. Comparison of clinical outcomes of Black and white patients with AML.
a,b, Comparison of treatment response and survival of age-matched, sex-matched and study date-matched cohorts of Black and white patients, a, EFS, rates of early death (ED), CR and relapse. b, OS. c, OS of Black and white patients with NPM1 mutations compared with the OS of 2022 ELN adverse-risk patients. d, OS of Black and white patients with NPM1 mutations and the presence or absence of a co-occurring FLT3-ITD in comparison with OS of 2022 ELN adverse-risk patients. e, OS of Black and white patients with NRAS mutations compared with the OS of 2022 ELN adverse-risk patients. f, OS of Black and white patients with IDH1 and IDH2 mutations compared with the OS of 2022 ELN adverse-risk patients. g, Frequencies of gene mutations detected in 43 relapsed or refractory adult Black patients cared for at the Memorial Sloan Kettering Comprehensive Cancer Center, profiled using an MSK-IMPACT assay. In a, for ED, CR and relapse rates, P values were calculated using a two-sided Fisher’s exact test. af, for time-to-event analyses, survival estimates were calculated using the Kaplan–Meier method and compared using a two-sided log-rank test. Adv, adverse.
Fig. 5
Fig. 5. Ancestry-associated differences in transcriptional profiles.
a, Mutational oncoprint of Black patients with NPM1 mutations. The red color denotes frameshift, nonsense and splice site mutations; black denotes missense and in-frame mutations; gray denotes ITDs of the FLT3 gene; and blue represents multiple mutations. b, Marker heatmap (MarkerFinder algorithm) of ancestry-associated gene expression differences in bulk RNA-seq data derived from patients with NPM1-mutated AML with genotype-confirmed ancestry (n = 260 patients). c, Visualization of the top two principal components of the NPM1 gene expression variation. White patients of European ancestry who clustered together with Black patients of African ancestry (‘white adjacent to Black’, n = 9), based on supervised classification, are denoted separately in red. d, OS of patients with NPM1 mutations aged younger than 60 years with respect to their ancestry and separate depiction of the identified white patients adjacent to Black patients (n = 7). Survival estimates were calculated using the Kaplan–Meier method and compared using a two-sided log-rank test.
Fig. 6
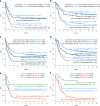
Fig. 6. Treatment outcomes of Black and white patients classified according to three genetic risk stratification systems.
a, EFS of Black and white patients according to high and low iScore status. b, OS of Black and white patients according to high and low iScore status. c, EFS of Black and white patients with low or high LSC17 scores. d, OS of Black and white patients with low or high LSC17 scores. e,f, EFS (e) and OS (f) of Black patients categorized into genetic risk groups according to our modification of the 2022 ELN genetic risk classification by the inclusion of NPM1, NRAS and IDH1 and IDH2 mutations as adverse-risk markers. Survival estimates were calculated using the Kaplan–Meier method and compared using a two-sided log-rank test. Adv, adverse; Fav, favorable; Int, intermediate.
Fig. 7
Fig. 7. Identification of a durable clonal gene expression program in patients with NPM1-mutated AML based on ancestry.
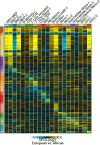
a, Uniform manifold approximation and projection (UMAP) of scRNA-seq profiles from 13 patients with NPM1-mutated AML (six with African ancestry, seven with European ancestry), and to a nonleukemic reference BM cell populations (inset). b, Cell population frequency for each patient with AML with respect to genetic ancestry (two-sided uncorrected Welch t-test). c, Differential expression heatmap of pseudobulk clusters (cellHarmony), comparing patients with European and African ancestry (fold change greater than 1.2, eBayes t-test P < 0.01). d, Heatmap showing differentially expressed genes (DEGs) in MEP-2 according to ancestry derived from cellHarmony. Red, splicing regulator. e, Gene set enrichment of European-enriched (left) and African-enriched (right) differentially expressed Gene Ontology terms in MPP/MEP combined pseudobulk RNA-seq data (raw P values from a two-sided Fisher’s exact test). BMCP, basophil/mast cell progenitor; cDC, conventional dendritic cell; DC, dendritic cell; EGFR, epidermal growth factor receptor; ER, endoplasmic reticulum; eryth, erythroid; GMP, granulocyte-monocyte progenitor; LMPP, lympho-myeloid primed progenitor; MAIT, mucosal associated invariant T; MAPK, mitogen-activated protein kinase; MDP, monocyte-dendritic progenitor; mono, monocyte; MKP, megakaryocyte progenitor; MPP, multipotent progenitor; Neu, neutrophil; NK, natural killer; pDC, plasmacytoid dendritic cell; TCM, central memory T; TEM, effector memory T.
Extended Data Fig. 1
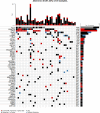
Extended Data Fig. 1. Variant calling, filtering and analyses workflow for determination of variants identified via paired tumor/normal whole-exome sequencing (WES) of 100 Black patients with AML.
Comparisons with White patients were done based on paired tumor-normal WES data of self-identified White patients who were sequenced as part of the BeatAML study and database. To ensure comparability, BeatAML WES data were re-analyzed with identical variant calling workflow and variant allele fraction threshold of ≥2%. Genes recurrently mutated in AML were curated via consensus of major AML databases.
Extended Data Fig. 2
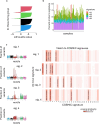
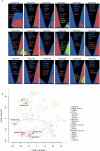
Extended Data Fig. 2. Mutational signatures identified in Black patients with AML.
a, Identification of 4 signatures with optimal performance. b, Presence of 4 signatures at the patient level. c, Similarity with COSMIC signatures. On the left are the identified mutational signatures, the color-coded bars on the left indicate similarity to known COSMIC mutational signatures. The etiologies of these signatures, if known, are shown for the 4 most similar signatures.
Extended Data Fig. 3
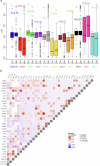
Extended Data Fig. 3. Driver mutations and mutational co-occurence patters found in Black patients with AML.
a, Box plots depicting variant allele fractions of frequent driver mutations, comparing Black and White patients treated on Alliance protocols, P-values were calculated using a two-sided Wilcoxon rank sum test (boxplots: centerline, median; box limits, first and third quartiles; whisker, 1.5x interquartile range). b, Triangle plot depicting mutational co-occurrence patterns found in Black patients with AML. Included are all genes mutated in at least 4 patients.
Extended Data Fig. 4
Extended Data Fig. 4. Oncoprint of cytogenetically normal Black patients with AML.
Depicted are all genes with recurrent variants detected in ≥2 patients.
Extended Data Fig. 5
Extended Data Fig. 5. Consort diagram.
Depicted are the different patient cohorts used for comparative analyses.
Extended Data Fig. 6
Extended Data Fig. 6. Clonality analysis of paired diagnosis and relapse samples of 18 patients.
a, Transcriptomic changes between diagnosis and relapse. b, Changes in gene expression between diagnosis and relapse samples.
Extended Data Fig. 7
Extended Data Fig. 7. Overall survival of Black and White patients aged < 60 years with AML and NPM1 mutations treated with intensive chemotherapy from the Flatiron database.
Survival estimates were calculated using the Kaplan-Meier method and compared using the two-sided log-rank test, confidence bands are the 95% Hall-Wellner Bands.
Extended Data Fig. 8
Extended Data Fig. 8. Outcome of Black and White patients with AML with myelodysplasia related mutations.
a, Disease free survival. The table contains the rates of early death (ED), complete remission (CR), and relapse. b, Event-free survival. c, Overall survival. For ED, CR and relapse rates (a), P-values were calculated using two-sided Fisher’s exact test. For time-to-event analyses (a-c), survival estimates were calculated using the Kaplan-Meier method and compared using the two-sided log-rank test.
Extended Data Fig. 9
Extended Data Fig. 9. Outcome of Black and White patients according to 2022 ELN genetic-risk group.
a, Event-free survival, b, overall survival. Survival estimates were calculated using the Kaplan-Meier method and compared using two-sided log-rank test.
Extended Data Fig. 10
Extended Data Fig. 10. ScRNA-seq analysis.
Heatmap depicting cell-state and lineage analyses of scRNA-seq profiles of Black and White patients.

References

    1. Döhner, H., Weisdorf, D. J. & Bloomfield, C. D. Acute myeloid leukemia. N. Engl. J. Med.373, 1136–1152 (2015). - PubMed
    1. Duncavage, E. J. et al. Genome sequencing as an alternative to cytogenetic analysis in myeloid cancers. N. Engl. J. Med.384, 924–935 (2021). - PMC - PubMed
    1. Ley, T. J. et al. Genomic and epigenomic landscapes of adult de novo acute myeloid leukemia. N. Engl. J. Med.368, 2059–2074 (2013). - PMC - PubMed
    1. Papaemmanuil, E. et al. Genomic classification and prognosis in acute myeloid leukemia. N. Engl. J. Med.374, 2209–2221 (2016). - PMC - PubMed
    1. Mardis, E. R. et al. Recurring mutations found by sequencing an acute myeloid leukemia genome. N. Engl. J. Med.361, 1058–1066 (2009). - PMC - PubMed