. 2024 Dec;30(12):3555-3567.
doi: 10.1038/s41591-024-03280-4. Epub 2024 Oct 4.

Noninvasive, microbiome-based diagnosis of inflammatory bowel disease

Affiliations

Noninvasive, microbiome-based diagnosis of inflammatory bowel disease

Jiaying Zheng et al. Nat Med. 2024 Dec.

Abstract

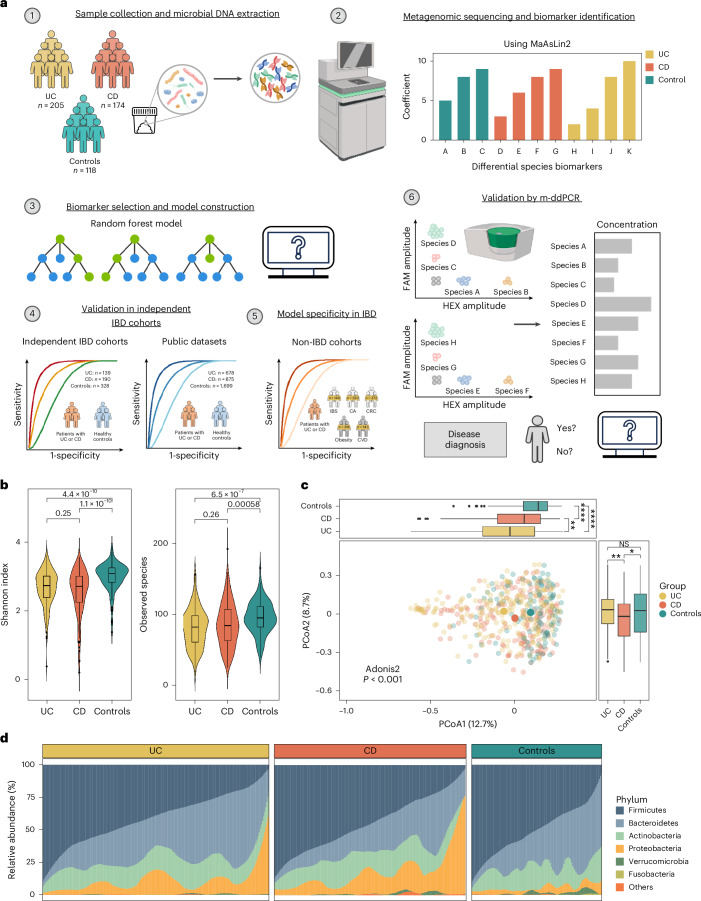
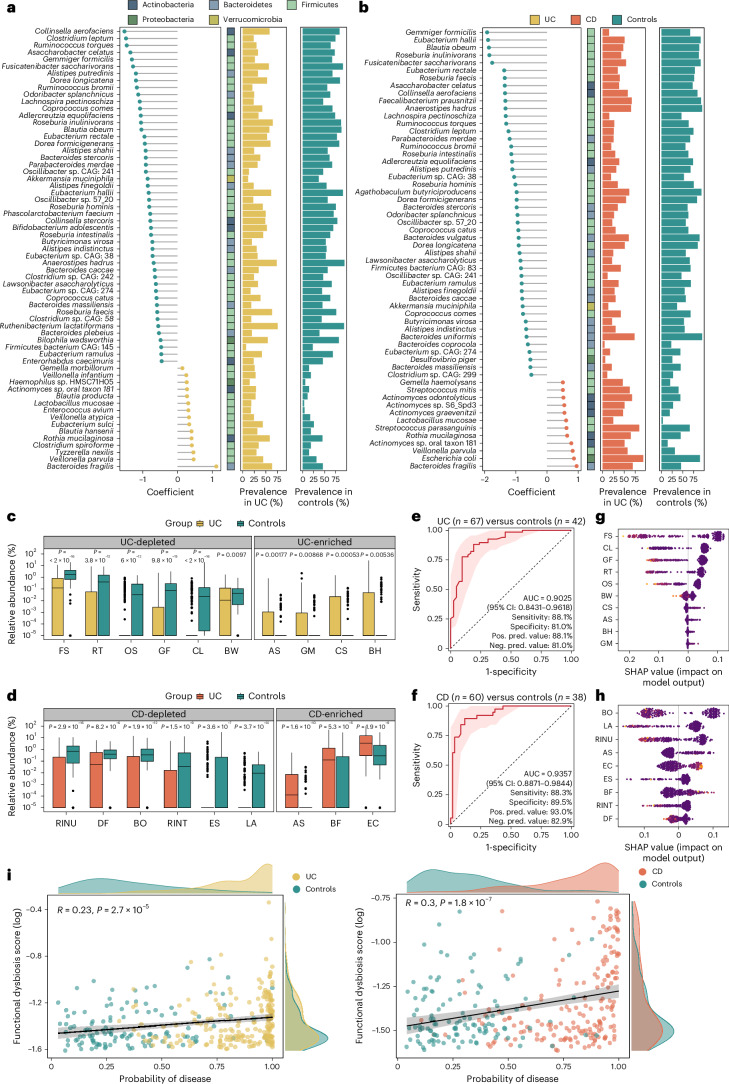
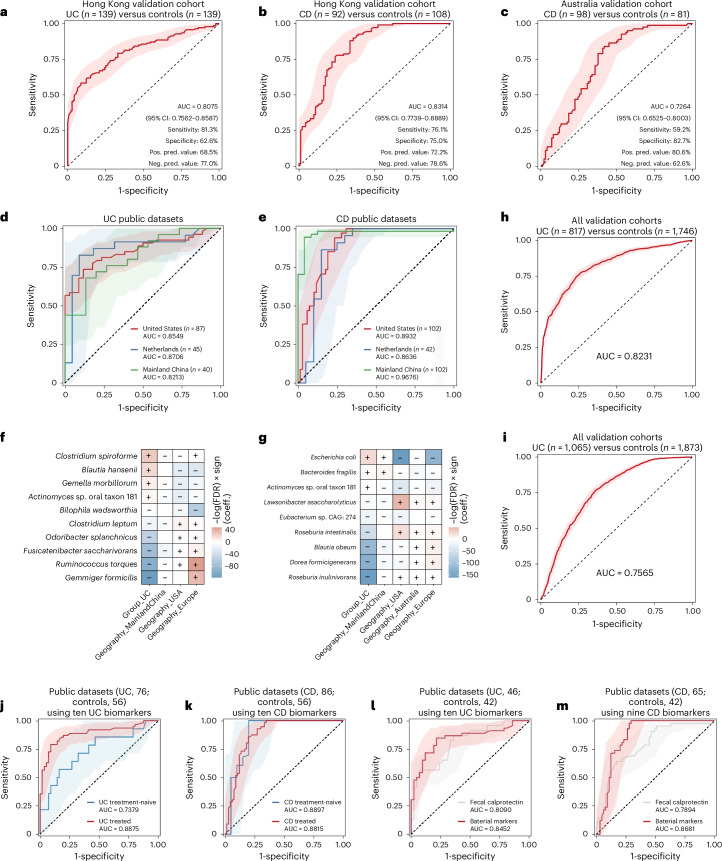
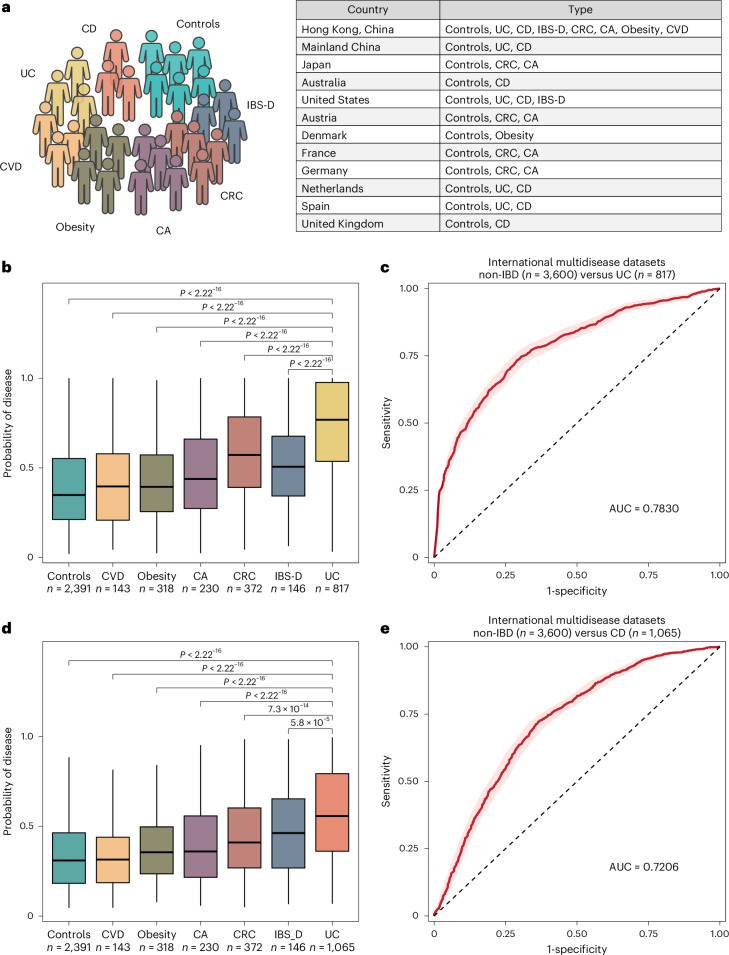
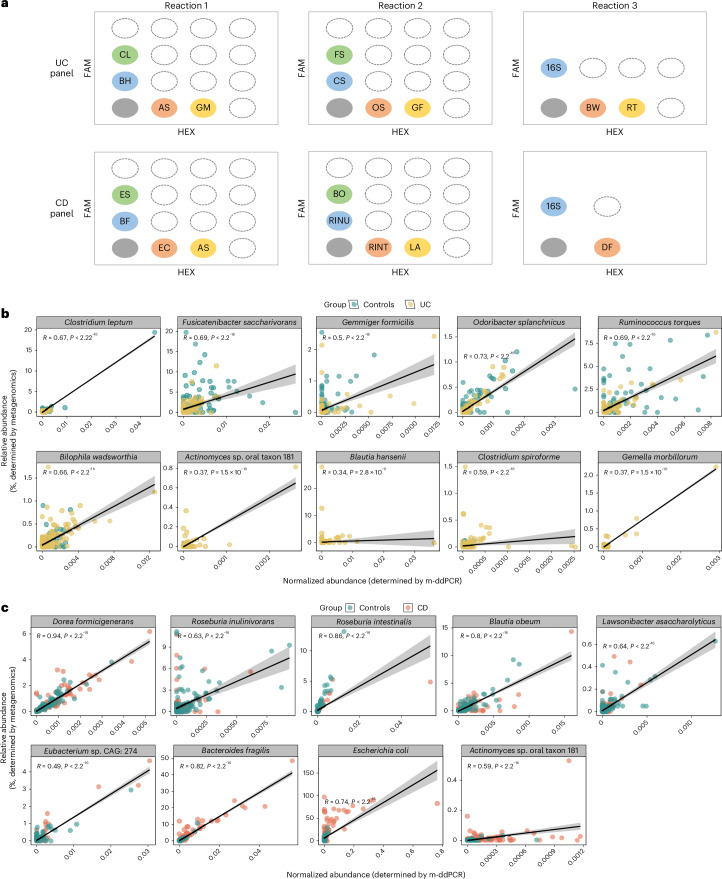
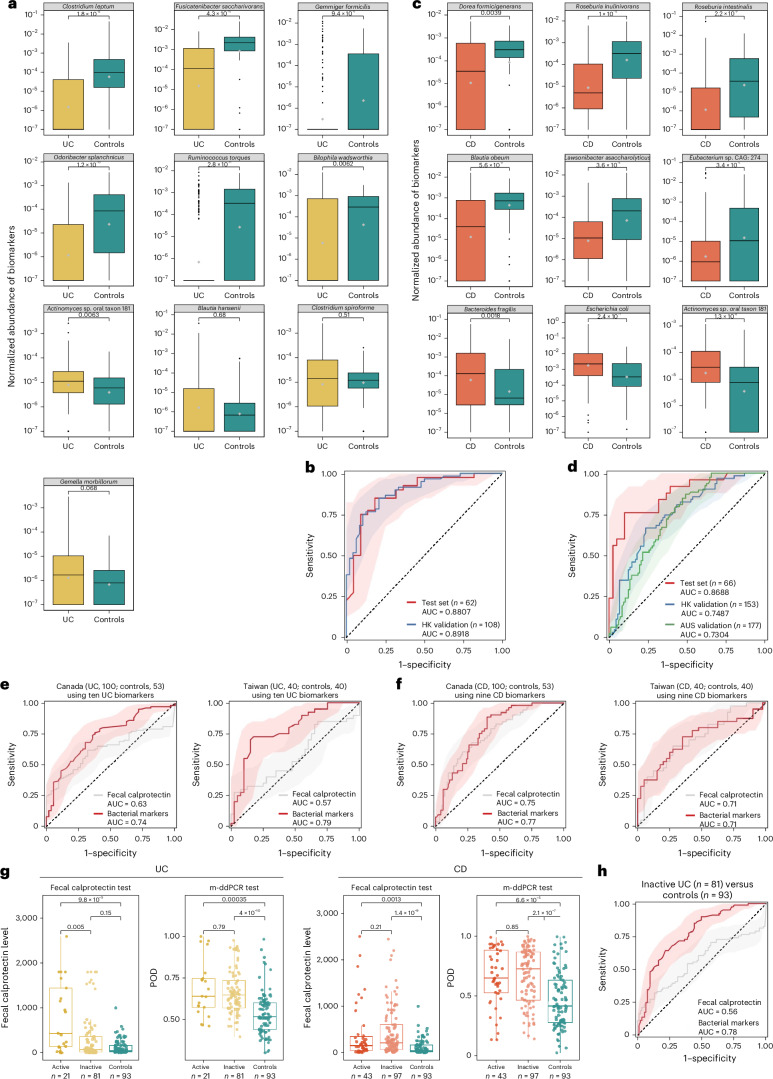
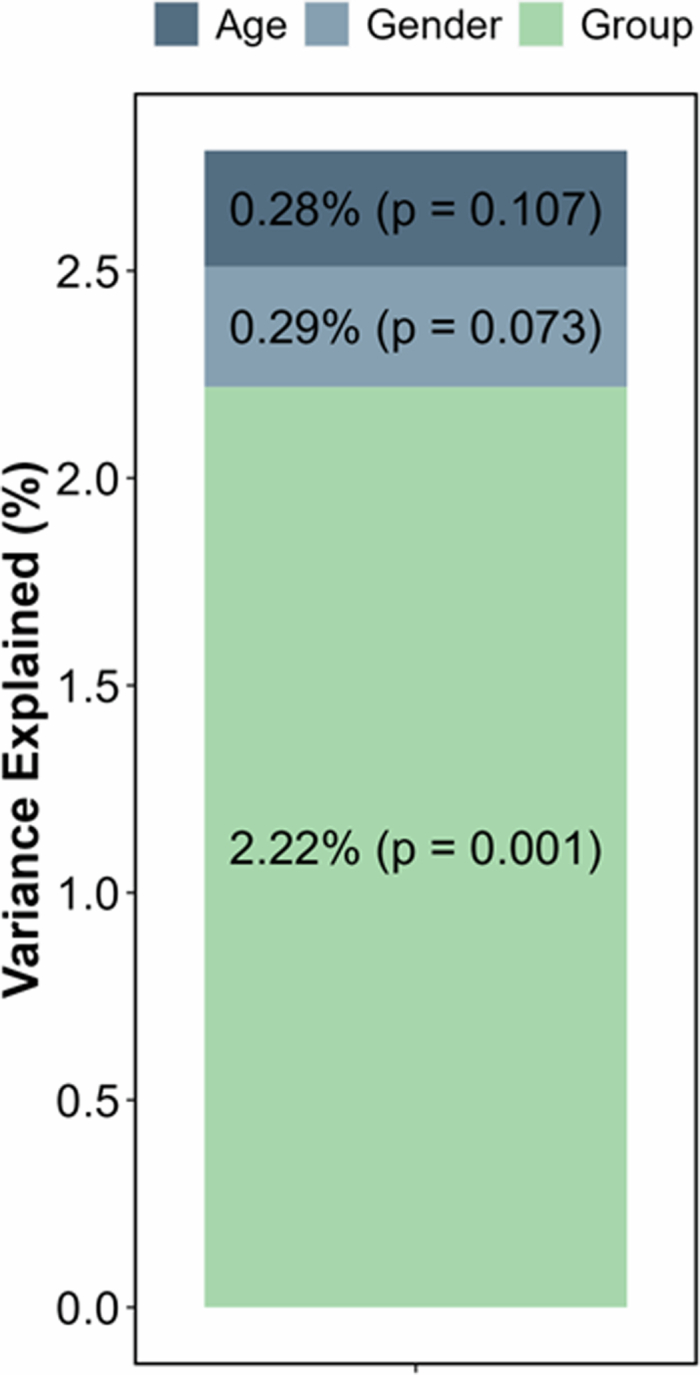
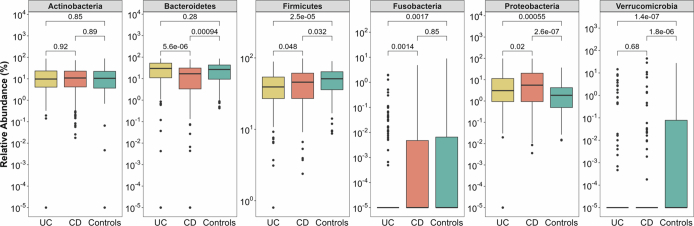
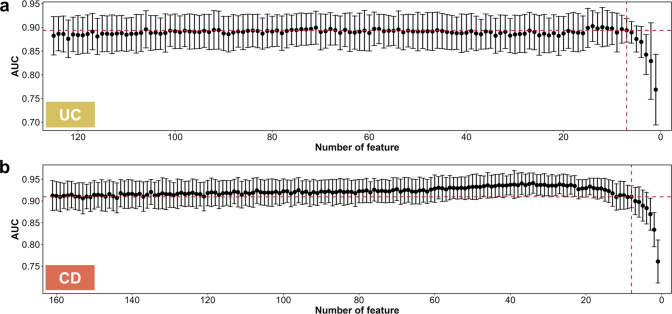
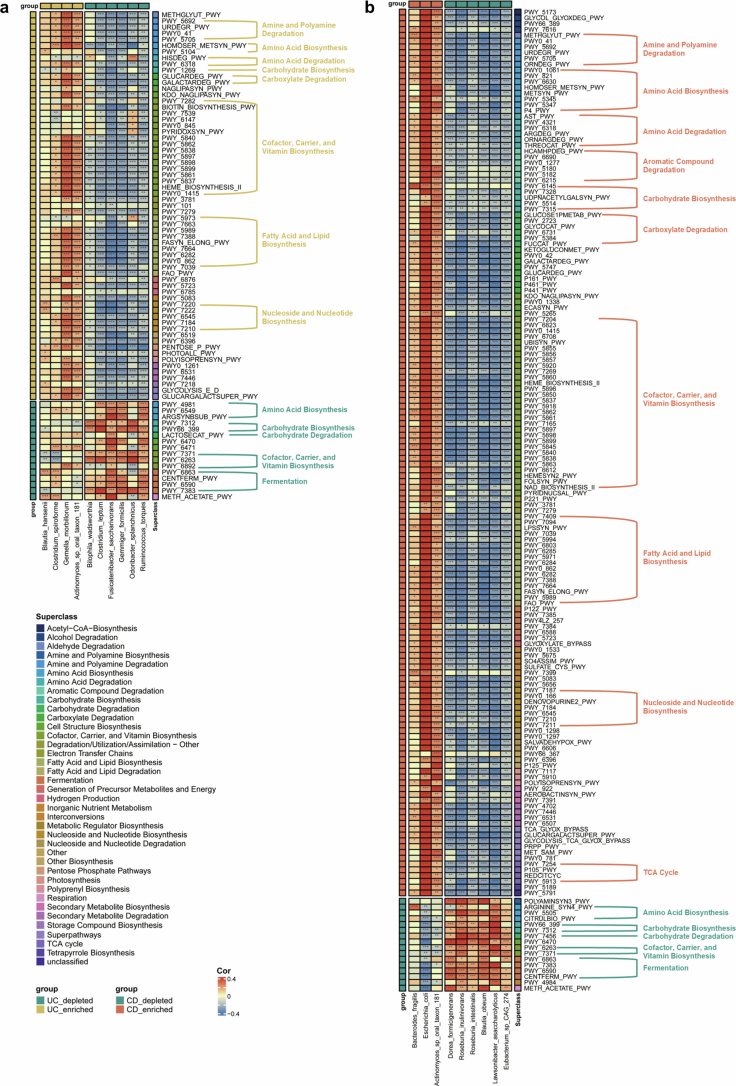
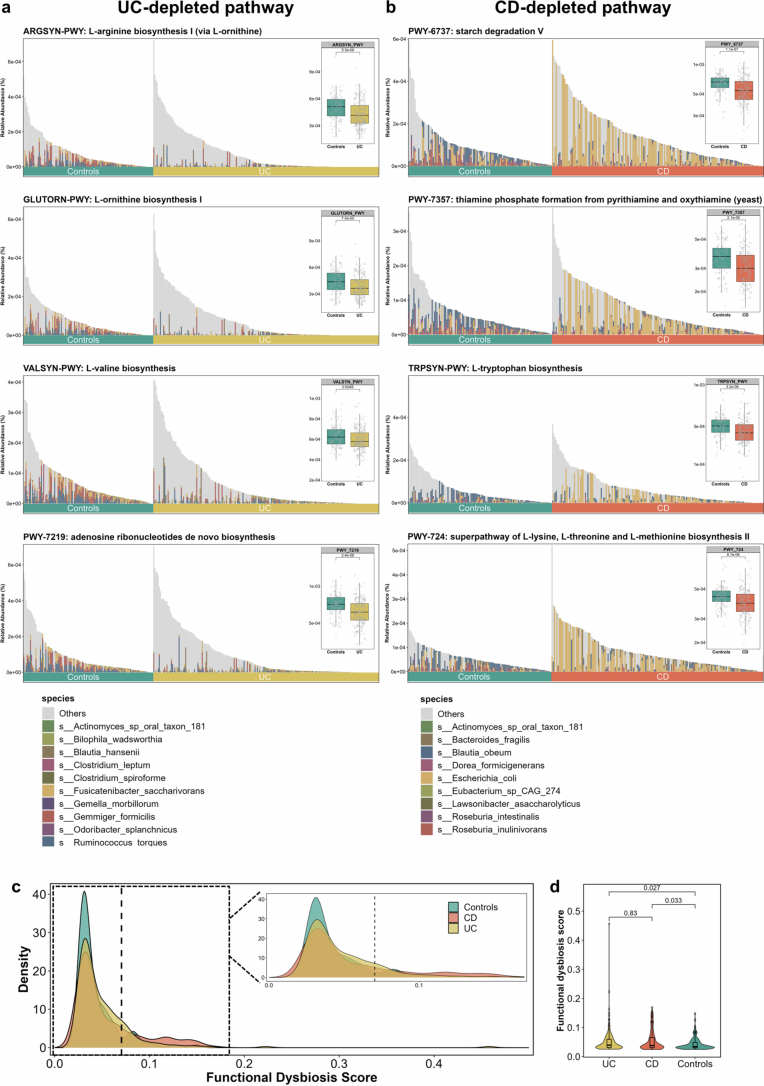
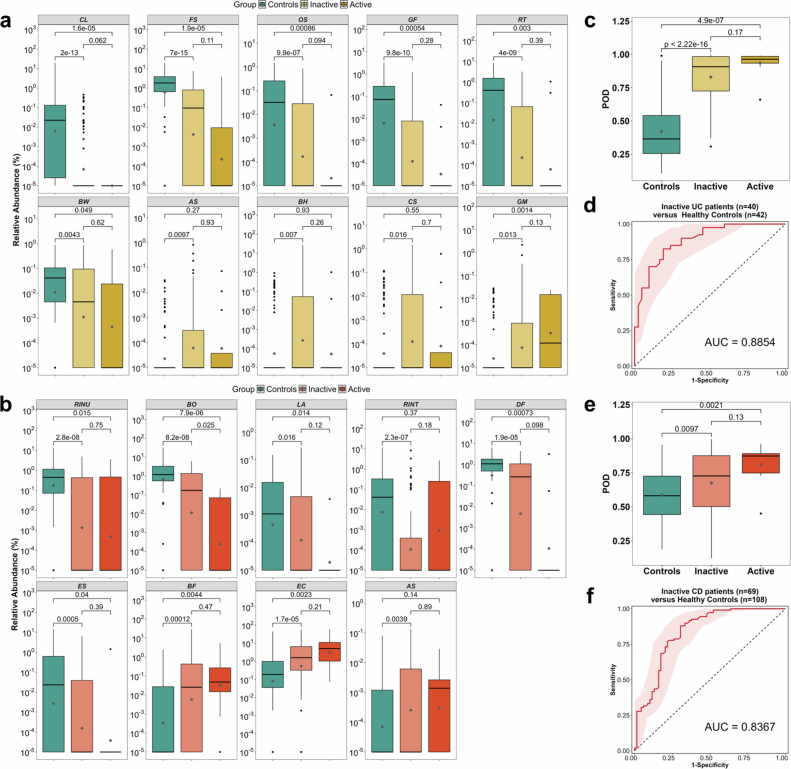
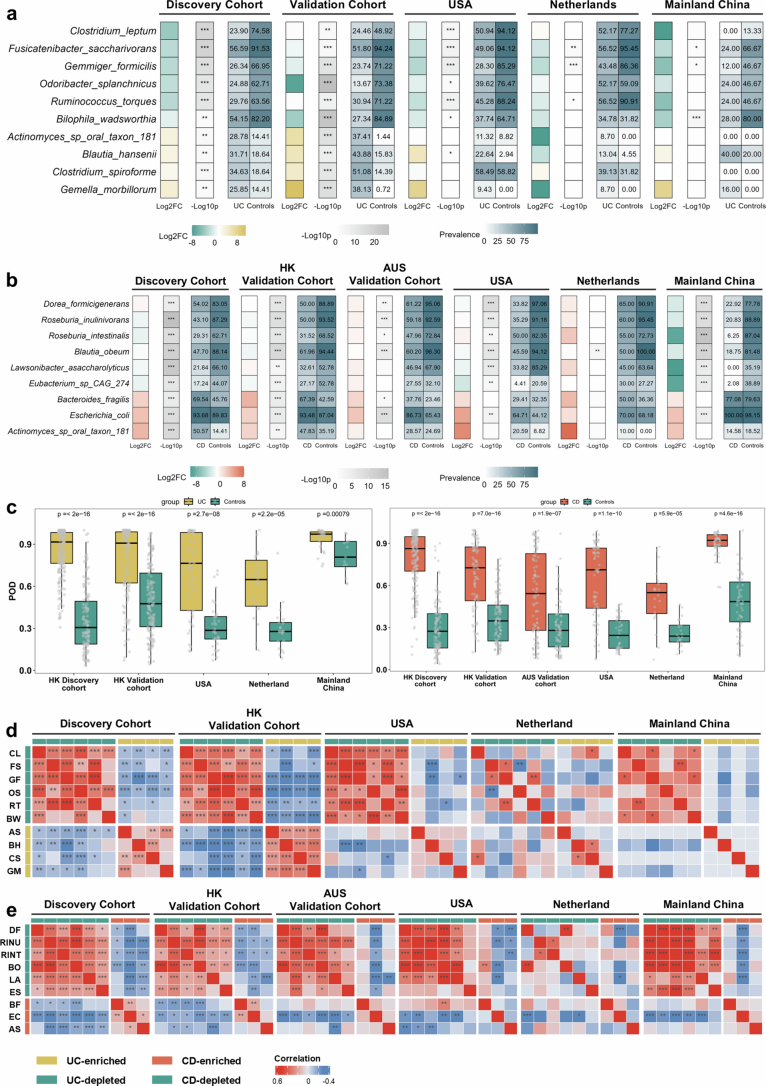
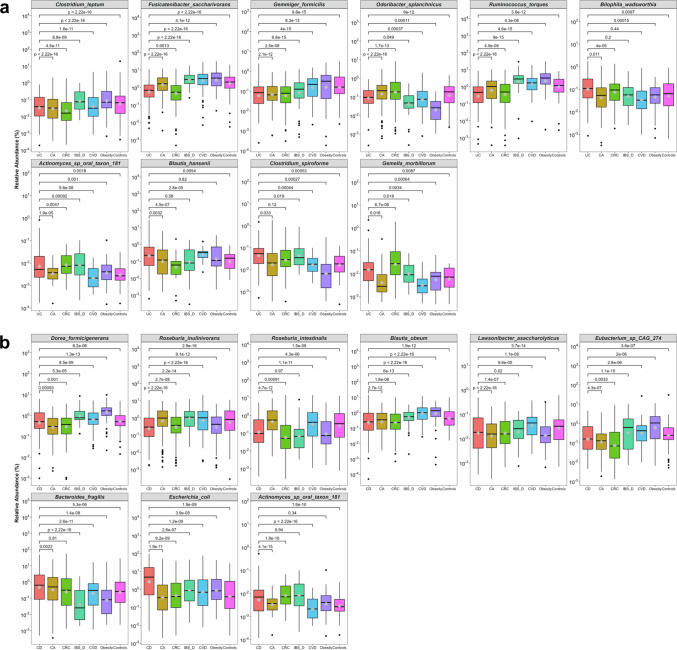
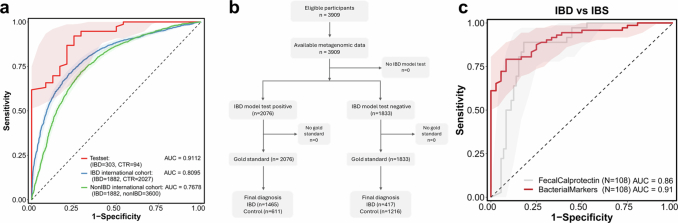
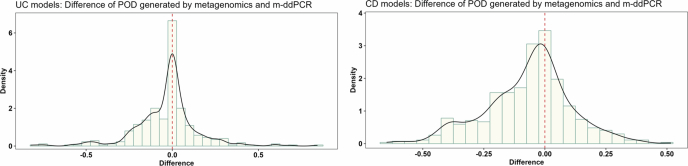
Despite recent progress in our understanding of the association between the gut microbiome and inflammatory bowel disease (IBD), the role of microbiome biomarkers in IBD diagnosis remains underexplored. Here we developed a microbiome-based diagnostic test for IBD. By utilization of metagenomic data from 5,979 fecal samples with and without IBD from different geographies and ethnicities, we identified microbiota alterations in IBD and selected ten and nine bacterial species for construction of diagnostic models for ulcerative colitis and Crohn's disease, respectively. These diagnostic models achieved areas under the curve >0.90 for distinguishing IBD from controls in the discovery cohort, and maintained satisfactory performance in transethnic validation cohorts from eight populations. We further developed a multiplex droplet digital polymerase chain reaction test targeting selected IBD-associated bacterial species, and models based on this test showed numerically higher performance than fecal calprotectin in discriminating ulcerative colitis and Crohn's disease from controls. Here we discovered universal IBD-associated bacteria and show the potential applicability of a multibacteria biomarker panel as a noninvasive tool for IBD diagnosis.


Conflict of interest statement

Competing interests: S.C.N. has served as an advisory board member for Pfizer, Ferring, Janssen and Abbvie and received honoraria as a speaker for Ferring, Tillotts, Menarini, Janssen, Abbvie and Takeda; has received research grants through her affiliated institutions from Olympus, Ferring and Abbvie; is a founder member, nonexecutive director, nonexecutive scientific advisor and shareholder of GenieBiome Ltd; and receives patent royalties through her affiliated institutions. F.K.L.C. is a Board Member of CUHK Medical Centre; is a cofounder, nonexecutive Board Chairman, nonexecutive scientific advisor, Honorary Chief Medical Officer and shareholder of GenieBiome Ltd; receives patent royalties through his affiliated institutions; and has received fees as an advisor and honoraria as a speaker for Eisai Co. Ltd, AstraZeneca, Pfizer Inc., Takeda Pharmaceutical Co. and Takeda (China) Holdings Co. Ltd. Q. Su and Z.X. are Scientists (Diagnostics) of GenieBiome Ltd. W.T. is Consultant (Regulatory Affairs) of GenieBiome Ltd. J. Zhang is Chief Scientist (Diagnostics) of GenieBiome Ltd. J. Zheng, W.T., J. Zhang, F.K.L.C. and S.C.N. are named inventors of patent applications held by MagIC that cover the therapeutic and diagnostic use of microbiome related to IBD (nos. 63/562,232; 63/675,266; 63/689,864 USA, 2024). C.N.B. is supported by the Bingham Chair in Gastroenterology; has served on advisory Boards for AbbVie Canada, Amgen Canada, Bristol Myers Squibb Canada, Ferring Canada, JAMP Pharmaceuticals, Lilly Canada, Janssen Canada, Pendopharm Canada, Sandoz Canada, Takeda Canada and Pfizer Canada; has received educational grants from Abbvie Canada, Bristol Myers Squibb Canada, Ferring Canada, organon Canada, Pfizer Canada, Takeda Canada, Boston Scientific and Janssen Canada; has served on a Speaker’s panel for Abbvie Canada, Janssen Canada, Pfizer Canada and Takeda Canada; and has received research funding from Abbvie Canada, Amgen Canada, Sandoz Canada, Takeda Canada and Pfizer Canada. D.T.R. has received grant support from Takeda and has served as a consultant for Abbvie, Altrubio, Amgen, Bausch Health, Bristol Myers Squibb, Connect BioPharma, Ferring Pharma, Image Analysis Group, Iterative Health, Janssen Pharmaceuticals, Lilly, Merck, Pfizer, Prometheus Biosciences (now Merck), Reistone Biopharma, USA, Takeda and Trellus Health. E.B.C. is Founder and Chief Scientific Officer of Gateway Biome, Inc. M.M. has received research grants from Soho Flordis International Australia Research, Bayer Steigerwald Arzneimittelwerk (Bayer Consumer Health) and Yakult-Nature Global Grant for Gut Health; Speaker’s honoraria and travel sponsorship from Janssen Australia; consultancy fees from Bayer Steigerwald Arzneimittelwerk (Bayer Consumer Health), Sanofi Australia and Danone-Nutricia Australia; Speaker honoraria and travel sponsorship from Perfect Company (China); and travel sponsorship from Yakult Inc. (Japan); is coinventor of PCT/AU2022/050556 ‘Diagnostic marker for functional gastrointestinal disorders’ from the University of Newcastle and UniQuest (University of Queensland), and US20110076356 A1 ‘Novel Fibro-biotic bacterium isolate’ via the US Department of Agriculture; acknowledges funding from NHMRC Australia, Australian Research Council, Princess Alexandra Hospital Research Foundation, Medical Research Futures Fund of Australia, Helmsley Charitable Trust via the Australasian Gastrointestinal Research Foundation and the United States Department of Defense; and serves on the science advisory board (nonremunerated) for GenieBiome, Hong Kong. The other authors declare no competing interests.

Figures

Fig. 1
Fig. 1. Overview of study workflow and comparison of fecal microbiome in patients with UC and CD and controls.
a, Workflow of the study. A total of 5,979 samples, including 1,884 from in-house sequencing datasets and 4,095 from public datasets, were included in this study. The discovery cohort includes 174 patients with CD, 205 with UC and 118 controls. Independent IBD cohorts include 139 patients with UC, 190 with CD and 328 controls. Public datasets include 678 patients with UC, 875 with CD and 1,699 controls. Non-IBD cohorts include 146 patients with IBS, 230 with CA, 372 with CRC, 318 with obesity, 143 with CVD and 364 corresponding controls. FAM and HEX represent fluorescent modification groups of different colors. b, Violin plots showing the Shannon index and observed species of fecal microbiome in patients with UC (n = 205) and CD (n = 174) and controls (n = 118). Data in boxplots are median (center line), 25th and 75th percentiles (box limits) and 5th and 95th percentiles (whiskers). P values were calculated using two-sided Wilcoxon rank-sum test. c, PCoA plot showing the varied microbial composition among groups (174 patients with CD, 205 with UC and 118 controls). Data in boxplots are median (center line), 25th and 75th percentiles (box limits) and 5th and 95th percentiles (whiskers). P values of beta-diversity based on Bray–Curtis distance were calculated with permutational multivariate analysis of variance using 999 permutations (df = 2, R2 = 0.02219, F = 5.606, P < 0.001). d, Stacked bar chart showing the relative abundance of the six most abundant phyla in patients with UC (n = 205) and CD (n = 174) and controls (n = 118). ‘Others’ includes phyla not shown in the figure. *P < 0.05, **P < 0.01, ***P < 0.001. NS, not significant. Illustrations in a were created with BioRender. Source data
Fig. 2
Fig. 2. Differential bacterial species and dysbiosis of metabolic pathways in patients with UC and CD compared with controls.
a,b, Top bacterial species associated with UC (a) and CD (b). Left, lollipop plot showing the coefficient of each species, with disease calculated by MaAsLin2 including adjustment for age and gender. Middle, the phylum of each species is indicated. Right, bar plot demonstrating the proportion of each species present in UC, CD and control groups. c,d, Relative abundance of ten bacterial species biomarkers in UC (n = 205) and controls (n = 118) (c), and of nine bacterial species biomarkers in CD (n = 174) and controls (n = 118) (d) as determined by metagenomics. Data shown as median (center line), 25th and 75th percentiles (box limits) and 5th and 95th percentiles (whiskers). P values were calculated using two-sided Wilcoxon rank-sum test. e,f, Performance of model with ten UC and nine CD bacterial species biomarkers for classification of patients with UC (e) and CD (f) compaerd with controls in discovery cohort. Shaded areas of ROC curves represent the 95% CI of AUC for the test set. g, SHAP values of the ten UC bacterial species biomarkers for each sample. h, SHAP values of the nine CD bacterial species biomarkers for each sample. Each point represents the SHAP value of each biomarker for each sample; the distribution of points indicates the impact of each biomarker on model output. Colors represent relative abundance of the biomarkers (yellow, high; purple, low). i, Correlation between functional dysbiosis scores and probability of disease generated by models based on ten UC and nine CD bacterial species biomarkers. Shaded area corresponds to 95% CI for the regression fit. Correlation coefficient and two-sided P values are given by Spearman correlation. Coeff., coefficient; pos. pred., positive prediction; neg. pred., negative prediction. Source data
Fig. 3
Fig. 3. Performance of model with bacterial species biomarkers in discrimination of patients with UC or CD from controls in independent cohorts and public datasets.
a, Performance of model with ten UC selected bacterial species biomarkers for classification of patients with UC versus controls in Hong Kong validation cohort. b,c, Performance of model with nine CD selected bacterial species biomarkers for classification of patints with CD versus controls in Hong Kong (b) and Australia validation cohorts (c). d,e, Performance of model with the selected bacterial species biomarkers for classification of patients with UC (d) or CD (e) versus controls in the three downloaded public datasets. f, Associations among disease group, geography, ethnicity and the relative abundance of ten UC bacterial species biomarkers were calculated by MaAsLin2 in cohorts with UC patients and controls. g, Associations among disease group, geography, ethnicity and the relative abundance of the nine CD bacterial species biomarkers were calculated by MaAsLin2 in cohorts with CD patients and controls. Positive and negative associations are colored red and blue, respectively. Significant associations (FDR < 0.05) are marked with a plus sign for positive associations and a minus for negative associations. FDR was computed by Benjamini–Hochberg correction. h, Performance of model with the selected bacterial species biomarkers for classification of patients with UC (n = 817) versus controls (n = 1,746) in all UC validation cohorts. i, Performance of model with the selected bacterial species biomarkers for classification of patients with CD (n = 1,065) versus controls (n = 1,873) in all CD validation cohorts. j, Model performance in distinguishing treated and treatment-naive patients with UC from controls in two downloaded public datasets. k, Model performance in distinguishing treated and treatment-naive patients with CD from controls in two downloaded public datasets. l, Model performance in distinguishing patients with UC from controls, compared using fecal calprotectin test in two downloaded public datasets. m, Model performance in distinguishing patients with CD from controls, compared using fecal calprotectin test in two downloaded public datasets. Shaded areas of ROC curves represent 95% CI of the AUC for each cohort. Source data
Fig. 4
Fig. 4. Performance of model with bacterial species biomarkers in discrimination of patients with UC or CD from other subjects with and without GI disorders in international cohorts.
a, Composition of international multidisease datasets from different countries and regions. b, Comparison of the probability of disease generated by the UC model based on ten UC bacterial species biomarkers in controls (n = 2,391) and in patients with CVD (n = 143), obesity (n = 318), CA (n = 230), CRC (n = 372), IBS-D (n = 146) and UC (n = 817). Data in boxplots show the median (center line), 25th and 75th percentiles (box limits) and 5th and 95th percentiles (whiskers). c, Performance of UC model in classification of patients with UC (n = 817) versus other non-IBD subjects (n = 3,600). d, Comparison of the probability of disease generated by the CD model based on nine CD bacterial species biomarkers in controls (n = 2,391) and in patients with CVD (n = 143), obesity (n = 318), CA (n = 230), CRC (n = 372), IBS-D (n = 146) and CD (n = 1,065). Data in boxplots show the median (center line), 25th and 75th percentiles (box limits) and 5th and 95th percentiles (whiskers). e, Performance of CD model in classification of patients with CD (n = 1,065) versus other non-IBD subjects (n = 3,600). Boxplots represent the minimum (Q1), median (Q3) and maximum. P values were calculated using the two-sided Wilcoxon rank-sum test. Shaded areas of ROC curves represent 95% CI of the AUC for each cohort.
Fig. 5
Fig. 5. Panel design of m-ddPCR and correlation between the abundance of bacterial species biomarkers determined by metagenomics and m-ddPCR.
a, Panel design of m-ddPCR for UC and CD bacterial species biomarkers. b,c, Correlation between the abundance of ten UC (b) and nine CD bacterial species biomarkers (c), as determined by metagenomics and m-ddPCR. Shaded areas correspond to 95% CI for the regression fit. The correlation coefficient and two-sided P value are given by Spearman correlation.
Fig. 6
Fig. 6. Bacterial species biomarkers in patients and controls as determined by m-ddPCR.
a, Relative abundance of ten bacterial species biomarkers in UC and controls in the discovery cohort (205 UC, 84 controls). b, Diagnostic performance of UC model with ten bacterial species biomarkers, as determined by m-ddPCR in the discovery cohort (test set, n = 62) and the Hong Kong (HK) cohort (n = 108). c, Relative abundance of nine bacterial species biomarkers in CD and control groups in the discovery cohort (172 CD; 86 controls). Gray diamonds represent mean values. d, Diagnostic performance of CD model with nine bacterial species biomarkers, as determined by m-ddPCR in the discovery cohort (test set, n = 66), the Hong Kong cohort (n = 153) and Australia (AUS) cohort (n = 177). e, Diagnostic performance of fecal calprotectin and UC model with ten bacterial species biomarkers, as determined by m-ddPCR in the Canada cohort (left; 100 UC, 53 Controls) and Taiwan cohort (right; 40 UC, 40 controls). f, Diagnostic performance of fecal calprotectin and CD model with ten bacterial species biomarkers, as determined by m-ddPCR in the Canada cohort (left; 100 CD, 53 controls) and Taiwan cohort (right; 40 CD, 40 controls). g, Comparison of the probability of disease (POD), calculated by the UC/CD model using m-ddPCR data and fecal calprotectin, between patients with inactive or active UC/CD and controls in the Canada and Taiwan cohorts. h, Diagnostic performance of fecal calprotectin and the UC model with ten bacterial species biomarkers determined by m-ddPCR in distinguishing patients with inactive UC (n = 81) and controls (n = 93). Shaded areas of ROC curves represent 95% CI of the AUC for each cohort. Data in boxplots show the median (center line), 25th and 75th percentiles (box limits) and 5th and 95th percentiles (whiskers). P values were calculated using the two-sided Wilcoxon rank-sum test.
Extended Data Fig. 1
Extended Data Fig. 1. Factors explaining microbiota variance.
Multivariate analysis showing the amount of explained variance and the respective P value determined by PERMANOVA based on Bray-Curtis dissimilarity at species level. Source data
Extended Data Fig. 2
Extended Data Fig. 2. Comparisons of the relative abundance of six phyla among patients with UC (N = 205), CD (N = 174), and controls (N = 118).
Data were shown in boxplots as the median (centre line), 25th and 75th percentiles (box limits), and 5th and 95th percentiles (whiskers). P values were calculated using the two-sided Wilcoxon rank-sum test. CD: Crohn’s disease; UC: Ulcerative colitis. Source data
Extended Data Fig. 3
Extended Data Fig. 3. Performance of model with different number of used features to discriminate patients with UC (N = 205) or CD (N = 174) from controls (N = 118).
a, A total of 125 species features were used in the UC diagnostic model. The vertical dotted line in x = 7 represented the minimum number of features to maintain a relatively stable performance of the model (horizontal dotted line, AUC = 0.8937). b, A total of 161 species features were used in the CD diagnostic model. The vertical dotted line in x = 8 represented the minimum number of features to maintain relatively stable performance of the model (horizontal dotted line, AUC = 0.9096). The AUC values were yield from 5-fold validation. The black dot indicates the mean, and the error bars indicate standard deviation. CD: Crohn’s disease; UC: Ulcerative colitis. Source data
Extended Data Fig. 4
Extended Data Fig. 4. Differential functional pathway between UC/ CD patients and controls, and their correlation with bacterial species biomarkers.
a, Differential functional pathways between UC patients and controls determined by MaAsLin2 with age and gender adjusted. b, Differential functional pathways between CD patients and controls determined by MaAsLin2 with age and gender adjusted. The correlation coefficient and two-sided P value between ten UC or nine CD bacterial species biomarkers and differential functional pathways were given by Spearman correlation. *, p < 0.05; **, p < 0.01; ***, p < 0.001. CD: Crohn’s disease; UC: Ulcerative colitis. Source data
Extended Data Fig. 5
Extended Data Fig. 5. Functional pathways in UC and CD patients compared with controls.
a-b, Contribution of bacterial species biomarkers in differential functional pathways in UC (N = 205) and CD patients (N = 174) compared with controls (N = 118). The stacked bar plot indicates the contribution of bacterial species biomarkers and other bacteria in each sample. Data were shown in boxplots as the median (centre line), 25th and 75th percentiles (box limits), and 5th and 95th percentiles (whiskers). The gray diamond represents the mean value. c, Distribution of functional dysbiosis scores determined by median Bray-Curtis dissimilarity between a sample and controls. The dash line indicates the 90th percentile of the functional dysbiosis scores for controls samples. d, Comparison of functional dysbiosis scores among UC (N = 205), CD (N = 174) and controls (N = 118). The dash lines in violin plot represent Q1, median, Q3. P values were calculated using the two-sided Wilcoxon rank-sum test. CD: Crohn’s disease; UC: Ulcerative colitis. Source data
Extended Data Fig. 6
Extended Data Fig. 6. Relative abundance of bacterial species biomarkers in controls and patients at inactive and active status.
a, The relative abundance of ten UC bacterial species biomarkers in controls and UC patients at inactive and active status. b, The relative abundance of nine CD bacterial species biomarkers in controls and CD patients at inactive and active status. e, Comparison of the probability of disease calculated by the random forest model between CD patients at inactive (N = 69) and active (N = 9) status. c, Comparison of the probability of disease calculated by the random forest model between UC patients at inactive (N = 110) and active (N = 11) status. d, Model performance in distinguishing inactive UC patients (N = 40) and controls (N = 42). f, Model performance in distinguishing inactive CD patients (N = 69) and controls (N = 108). Shaded areas of the ROC curves represent the 95% confidence interval of the AUC for each cohort. Data were shown in boxplots as the median (centre line), 25th and 75th percentiles (box limits), and 5th and 95th percentiles (whiskers). The gray diamond represents the mean value. P values were given by the two-sided Wilcoxon rank sum test. CD: Crohn’s disease; UC: Ulcerative colitis; IBS, Irritable bowel syndrome.
Extended Data Fig. 7
Extended Data Fig. 7. Abundance and prevalence of bacterial species biomarkers and the performance of diagnostic models in cohorts from different ethnicities and regions.
a-b, Signature of bacterial species biomarkers for UC and CD diagnosis in patients and healthy individuals of discovery cohort, validation cohort, and three downloaded public datasets. The abundance of species was normalized to log2 fold change (log2FC) relative to the mean of control samples. P values were calculated using the two-sided Wilcoxon rank-sum test. P values were then converted to -log10(P-value) after using Benjamini–Hochberg correction to control for multiple testing. Prevalence indicates the proportion of bacterial presence in UC, CD, and healthy group of each cohort. c, The probability of disease calculated by the random forest model between UC/CD patients and controls in Hong Kong discovery cohort (205 UC,174 CD, 118 controls), validation cohort from Hong Kong (139 UC, 139 controls; 92 CD, 108 controls) and Australia (98 CD, 81 controls), and public datasets from the United States (53 UC, 68 CD, 34 controls), Netherlands (23 UC, 20 CD, 22 controls) and mainland China (25 UC, 15 controls; 48 CD, 54 controls). Data were shown in boxplots as the median (centre line), 25th and 75th percentiles (box limits), and 5th and 95th percentiles (whiskers). P values were calculated using the two-sided Wilcoxon rank-sum test. d, Correlation among the ten UC bacterial species biomarkers. UC-depleted bacteria were labelled with green color while the UC-enriched ones were labeled with yellow color. e, Correlation among the nine CD bacterial species biomarkers. CD-depleted bacteria were labelled with green color while the CD-enriched ones were labeled with orange color. Grids in red indicated positive correlation, while grids in blue indicated negative correlation. The correlation coefficient and two-sided P value were given by Spearman correlation. *p < 0.05, **p < 0.01, ***p < 0.001. CD: Crohn’s disease; UC: Ulcerative colitis. Source data
Extended Data Fig. 8
Extended Data Fig. 8. Relative abundance of bacterial species biomarkers in UC/CD and other non-IBD disease groups in Hong Kong cohort.
a, Relative abundance of 10 UC bacterial species biomarkers in UC (N = 205) and other non-IBD disease group (162 CA, 160 CRC, 117 IBS-D, 148 obesity, 143 CVD, 118 Controls). b, Relative abundance of 9 CD bacterial species biomarkers in CD (N = 174) and other non-IBD disease group (162 CA, 160 CRC, 117 IBS-D, 148 obesity, 143 CVD, 118 Controls). Data were shown in boxplots as the median (centre line), 25th and 75th percentiles (box limits), and 5th and 95th percentiles (whiskers). The gray diamond represents the mean value. P values were calculated using the two-sided Wilcoxon rank-sum test. CD: Crohn’s disease; UC: Ulcerative colitis; IBS-D, Irritable bowel syndrome (diarrhea subtype); CA, Colorectal adenomas; CRC, Colorectal cancer; CVD, Cardiovascular disease.
Extended Data Fig. 9
Extended Data Fig. 9. Performance of general IBD model in classifying IBD from and non-IBD subjects.
a, ROC of general IBD model in classifying IBD from controls and non-IBD in test set, IBD validation cohort, and non-IBD cohort. b, Prototypical standards for reporting diagnostic accuracy studies (STARD) diagram reporting the flow of participants in independent international IBD cohort (IBD = 1882, Controls=2027). c, Comparison of diagnostic performance of general IBD model and fecal calprotectin in classifying IBD from and IBS subjects. Shaded areas of the ROC curves represent the 95% confidence interval of the AUC for each cohort. IBD, Inflammatory Bowel Disease; IBS, Irritable bowel syndrome.
Extended Data Fig. 10
Extended Data Fig. 10. Difference of probability of disease (POD) calculated by metagenomics-based model and m-ddPCR-based model for UC and CD.
CD: Crohn’s disease; UC: Ulcerative colitis.

References

    1. GBD 2017 Inflammatory Bowel Disease Collaborators. The global, regional, and national burden of inflammatory bowel disease in 195 countries and territories, 1990-2017: a systematic analysis for the Global Burden of Disease Study 2017. Lancet Gastroenterol. Hepatol.5, 17–30 (2020). - PMC - PubMed
    1. Ng, S. C. Emerging trends of inflammatory bowel disease in Asia. Gastroenterol. Hepatol. (N. Y.)12, 193–196 (2016). - PMC - PubMed
    1. Ng, S. C. et al. Worldwide incidence and prevalence of inflammatory bowel disease in the 21st century: a systematic review of population-based studies. Lancet390, 2769–2778 (2017). - PubMed
    1. Noble, A. J., Nowak, J. K., Adams, A. T., Uhlig, H. H. & Satsangi, J. Defining interactions between the genome, epigenome, and the environment in inflammatory bowel disease: progress and prospects. Gastroenterology165, 44–60 (2023). - PubMed
    1. Ananthakrishnan, A. N. et al. Environmental triggers in IBD: a review of progress and evidence. Nat. Rev. Gastroenterol. Hepatol.15, 39–49 (2018). - PubMed

MeSH terms

LinkOut - more resources