. 2024 Oct 4;21(1):250.
doi: 10.1186/s12974-024-03244-y.

Interleukin-2 improves insulin sensitivity through hypothalamic sympathetic activation in obese mice

Affiliations

Interleukin-2 improves insulin sensitivity through hypothalamic sympathetic activation in obese mice

Subin Moon et al. J Neuroinflammation. .

Abstract

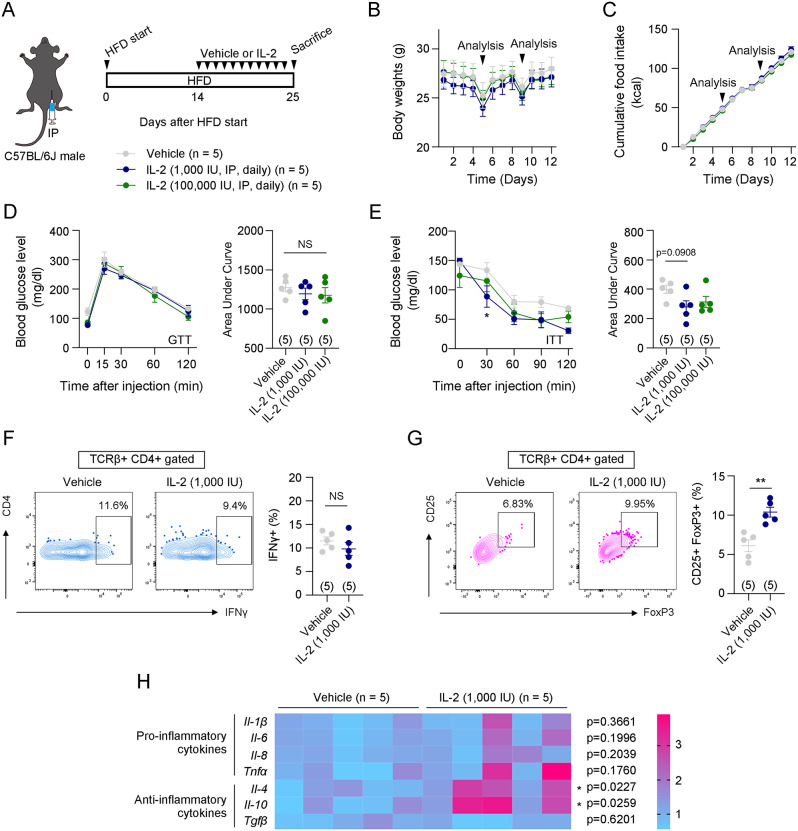
Background: IL-2 regulates T cell differentiation: low-dose IL-2 induces immunoregulatory Treg differentiation, while high-dose IL-2 acts as a potent activator of cytotoxic T cells and NK cells. Therefore, high-dose IL-2 has been studied for use in cancer immunotherapy. We aimed to utilize low-dose IL-2 to treat inflammatory diseases such as obesity and insulin resistance, which involve low-grade chronic inflammation.

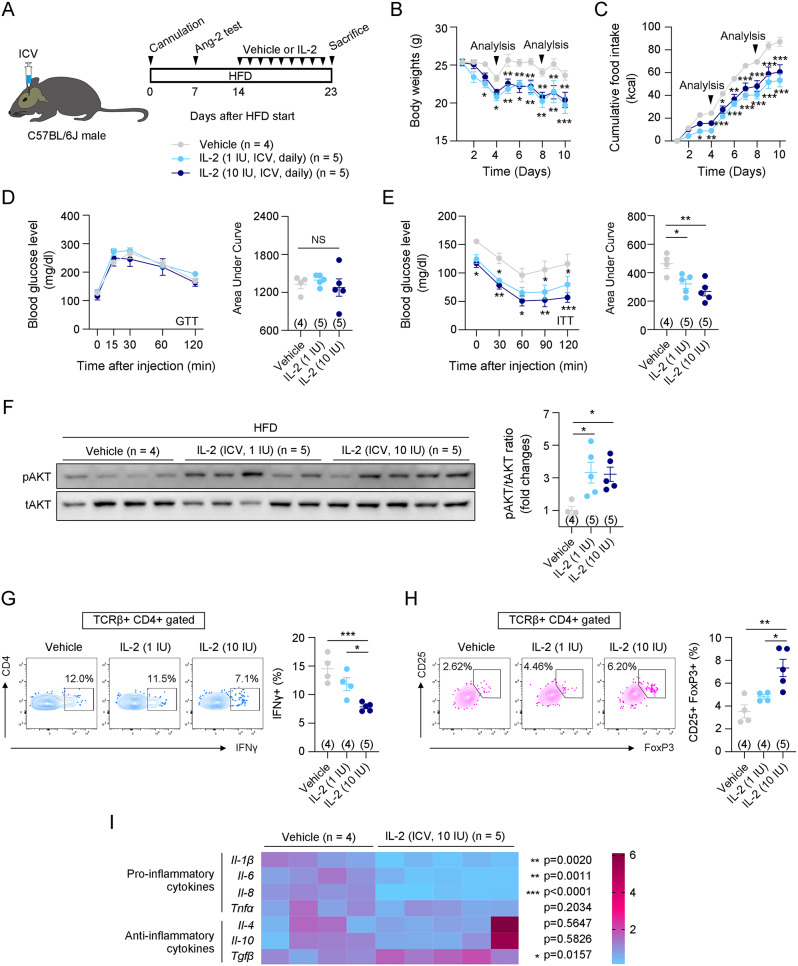
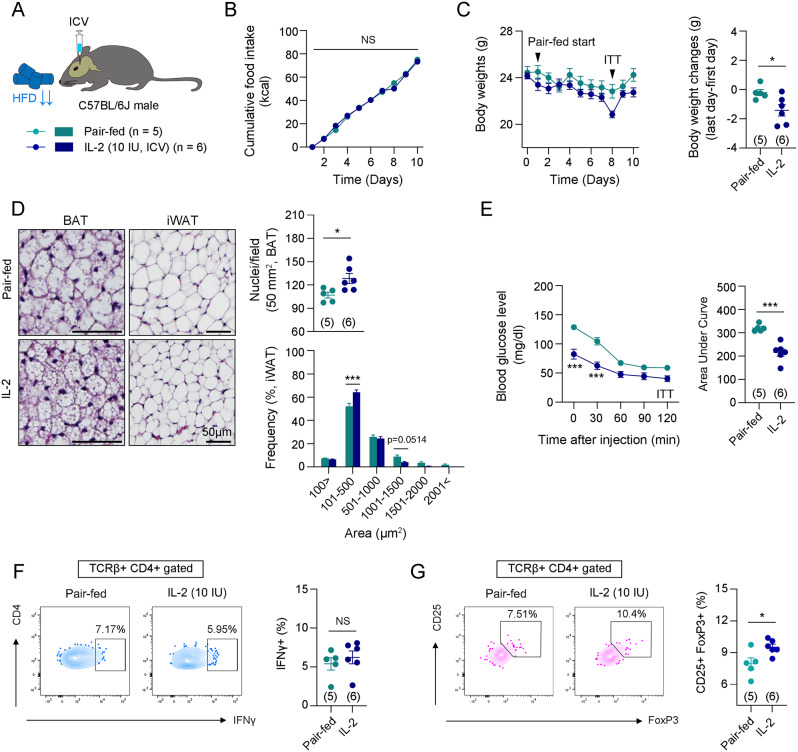
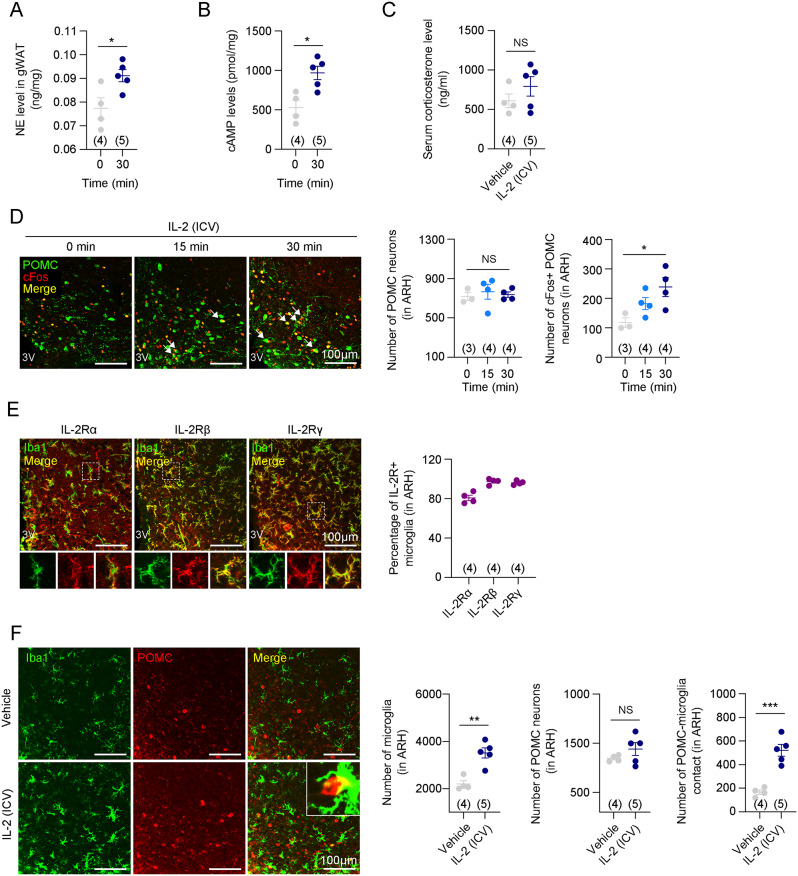
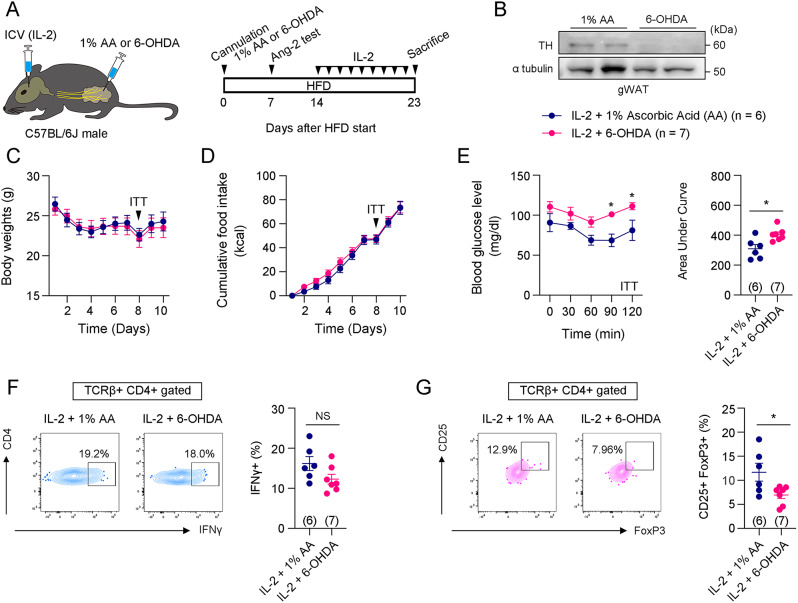
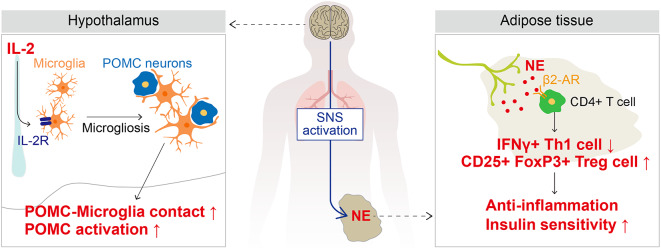
Main body: Systemic administration of low-dose IL-2 increased Treg cells and decreased inflammation in gonadal white adipose tissue (gWAT), leading to improved insulin sensitivity in high-fat diet-fed obese mice. Additionally, central administration of IL-2 significantly enhanced insulin sensitivity through the activation of the sympathetic nervous system. The sympathetic signaling induced by central IL-2 administration not only decreased interferon γ (IFNγ) + Th1 cells and the expression of pro-inflammatory cytokines, including Il-1β, Il-6, and Il-8, but also increased CD4 + CD25 + FoxP3 + Treg cells and Tgfβ expression in the gWAT of obese mice. These phenomena were accompanied by hypothalamic microgliosis and activation of pro-opiomelanocortin neurons. Furthermore, sympathetic denervation in gWAT reversed the enhanced insulin sensitivity and immune cell polarization induced by central IL-2 administration.

Conclusion: Overall, we demonstrated that IL-2 improves insulin sensitivity through two mechanisms: direct action on CD4 + T cells and via the neuro-immune axis triggered by hypothalamic microgliosis.

Keywords: Adipose tissue inflammation; Hypothalamic microglia; Insulin resistance; Interleukin-2; Pro-opiomelanocortin (POMC) neurons; Sympathetic nervous system.


Conflict of interest statement

The authors declare no competing interests.

Figures

Fig. 1
Fig. 1
Systemic IL-2 administration improved insulin sensitivity in HFD-induced obese mice. A. Illustration of systemic IL-2 administration and the experimental timeline. B and C. Changes in body weight and food intake during intraperitoneal injection of vehicle or IL-2. The arrows indicate the time points of metabolic analysis (n = 5). D and E. Glucose and insulin tolerance tests were performed on the 5th and 9th day after the first vehicle or IL-2 administration (n = 5) F and G. Flow cytometry analysis of Th1 cells (CD45 + TCRβ + CD4 + IFNγ+) and Treg cells (CD45 + TCRβ + CD4 + CD25 + FoxP3+) in gWATs of vehicle and IL-2 [1,000 IU] groups (n = 5) H. Comparison of mRNA expressions of inflammation-related genes, including Il-1β, Il-6, Il-8, Tnfα, Il-4, Il-10, and Tgfβ (n = 5) Results are presented as mean ± SEM. Statistical analyses were performed using one-sided two-way ANOVA (B, C, D [left], E [left]), one-sided one-way ANOVA (D [right], E [right]), and two-sided Student’s t-test (F, G, H). *p < 0.05, **p < 0.01, and ***p < 0.001 between the indicated groups. NS, not significant
Fig. 2
Fig. 2
Central IL-2 administration improved insulin sensitivity in HFD-induced obese mice. A. Illustration of central IL-2 administration and the experimental timeline. B and C. Changes in body weight and food intake during intraperitoneal injection of vehicle or IL-2. The arrows indicate the time points of metabolic analysis (n = 4 for vehicle, n = 5 for IL-2 [1 IU] and IL-2 [10 IU]). D and E. Glucose and insulin tolerance tests were performed on the 4th and 8th day after the first vehicle or IL-2 administration (n = 4 for vehicle, n = 5 for IL-2 [1 IU] and IL-2 [10 IU]). F. Western blot data and quantification of pAKT and tAKT after insulin administration in the vehicle, IL-2 [1 IU], and IL-2 [10 IU] groups (n = 4 for vehicle, n = 5 for IL-2 [1 IU] and IL-2 [10 IU]). G and H. Flow cytometry analysis of Th1 cells (CD45 + TCRβ + CD4 + IFNγ+) and Treg cells (CD45 + TCRβ + CD4 + CD25 + FoxP3+) in gWATs of vehicle, IL-2 [1 IU], and IL-2 [10 IU] groups (n = 4 for vehicle and IL-2 [1 IU] and n = 5 for IL-2 [10 IU]). I. Comparison of mRNA expressions of inflammation-related genes, including Il-1β, Il-6, Il-8, Tnfα, Il-4, Il-10, and Tgfβ (n = 4 for vehicle and n = 5 for IL-2 [10 IU]) Results are presented as mean ± SEM. Statistical analyses were performed using one-sided two-way ANOVA (B, C, D [left], E [left]), one-sided one-way ANOVA (D [right], E [right], F, G, H), and two-sided Student’s t-test (I). *p < 0.05, **p < 0.01, and ***p < 0.001 between the indicated groups. NS, not significant
Fig. 3
Fig. 3
Central IL-2 administration improved insulin sensitivity compared to pair-fed mice. A. Illustration of central IL-2 administration. B. Cumulative food intakes between the vehicle-administered pair-fed group and the IL-2 administered-group (n = 5 for pair-fed group and n = 6 for IL-2 group). C. Graphs of body weights and body weight changes between the vehicle-administered pair-fed group and the IL-2 administered group (n = 5 for pair-fed group and n = 6 for IL-2 group). D. Representative images and quantification of H&E staining of BAT and iWAT of the pair-fed or IL-2-administered mice (n = 5 for pair-fed group and n = 6 for IL-2 group). Scale bars: 50 μm. E. Insulin tolerance test was performed on the 8th day after starting pair-feeding (n = 5 for pair-fed group and n = 6 for IL-2 group). F and G. Flow cytometry analysis of Th1 cells (CD45 + TCRβ + CD4 + IFNγ+) and Treg cells (CD45 + TCRβ + CD4 + CD25 + FoxP3+) in gWATs (n = 5 for pair-fed group and n = 6 for IL-2 group). Results are presented as mean ± SEM. Statistical analyses were performed using one-sided two-way ANOVA (B, C [left], D [lower], E [left]) and two-sided Student’s t-test (C [right], D [upper], E [right], F, G). *p < 0.05 and ***p < 0.001 between the indicated groups. NS, not significant
Fig. 4
Fig. 4
Central IL-2 administration stimulated the SNS through the activation of hypothalamic microglia and POMC neurons. A. Time-dependent concentration of norepinephrine levels in gWAT at 0 and 30 min after central IL-2 administration (n = 4 for 0 min and n = 5 for 30 min) B. cAMP levels in gWAT 30 min after central IL-2 administration (n=4 for 0 min and n=5 for 30 min). C. Serum corticosterone level 30 min after central IL-2 administration (n=4 for the vehicle and n=5 for the IL-2 groups). D. Double immunostaining images and quantification of POMC and cFos at 0, 15, and 30 min after central administration of IL-2 in the ARH (n=3 for 0, and n=4 for 15 and 30 min). Scale bars: 100 µm. E. Representative immunostaining images and quantifications of IL-2Rα, IL-2Rβ, and IL-2Rγ expressions in the hypothalamic microglia (n=4). Scale bars: 100 µm. F. Double immunostaining images and quantification of Iba1 and POMC after central administration of vehicle or IL-2 (n=4 for the vehicle and n=5 for the IL-2 groups). Scale bars: 100 µm. Results are presented as mean ± SEM. Statistical analyses were performed using one-sided one-way ANOVA (D) and two-sided Student’s t-test (A, B, C, F). *p<0.05, **p<0.01, and ***p<0.001 between the indicated groups. NS, not significant
Fig. 5
Fig. 5
Sympathetic denervation reversed improved insulin sensitivity induced by central IL-2 administration. A. Illustration and experimental timetable of central IL-2 administration and 1% ascorbic acid (AA) or 6-OHDA injection into gWAT. B. Representative western blotting images of TH and α-tubulin in gWAT of mice injected with 1% AA or 6-OHDA into gWAT. C and D. Changes in body weight and food intake during central IL-2 administration after 1% AA- or 6-OHDA-injected mice (n = 6 for the 1% AA and n = 7 for the 6-OHDA groups). E. Insulin tolerance tests performed on the 8th day after the first vehicle or IL-2 administration (n = 6 for the 1% AA and n = 7 for the 6-OHDA groups). F and G. Flow cytometry analysis of Th1 cells (CD45 + TCRβ + CD4 + IFNγ+) and Treg cells (CD45 + TCRβ + CD4 + CD25 + FoxP3+) in gWATs (n = 6 for the 1% AA and n = 7 for the 6-OHDA groups). Results are presented as mean ± SEM. Statistical analyses were performed using two-sided Student’s t-test (E [right], F, G) and one-sided two-way ANOVA (C, D, E [left])
Fig. 6
Fig. 6
Illustration of the mechanism underlying how IL-2 improves insulin sensitivity through the hypothalamic-immune axis

Similar articles

Cited by

References

    1. Morgan DA, Ruscetti FW, Gallo R. Selective in vitro growth of T lymphocytes from normal human bone marrows. Science. 1976;193:1007–8. 10.1126/science.181845. - PubMed
    1. Rosenberg SA, Yang JC, Topalian SL, Schwartzentruber DJ, Weber JS, Parkinson DR, et al. Treatment of 283 consecutive patients with metastatic melanoma or renal cell cancer using high-dose bolus interleukin 2. JAMA. 1994;271:907–13. 10.1001/jama.1994.03510360033032. - PubMed
    1. Rosenberg SA, Lotze MT, Muul LM, Leitman S, Chang AE, Ettinghausen SE, et al. Observations on the systemic administration of autologous lymphokine-activated killer cells and recombinant interleukin-2 to patients with metastatic cancer. N Engl J Med. 1985;313:1485–92. 10.1056/NEJM198512053132327. - PubMed
    1. Fyfe G, Fisher RI, Rosenberg SA, Sznol M, Parkinson DR, Louie AC. Results of treatment of 255 patients with metastatic renal cell carcinoma who received high-dose recombinant interleukin-2 therapy. J Clin Oncol. 1995;13:688–96. 10.1200/JCO.1995.13.3.688. - PubMed
    1. Rosenberg SA. IL-2: the first effective immunotherapy for human cancer. J Immunol. 2014;192:5451–8. 10.4049/jimmunol.1490019. - PMC - PubMed