. 2024 Oct 5;23(1):222.
doi: 10.1186/s12943-024-02115-7.

Pharmacological targeting of P300/CBP reveals EWS::FLI1-mediated senescence evasion in Ewing sarcoma

Affiliations

Pharmacological targeting of P300/CBP reveals EWS::FLI1-mediated senescence evasion in Ewing sarcoma

Erdong Wei et al. Mol Cancer. .

Abstract

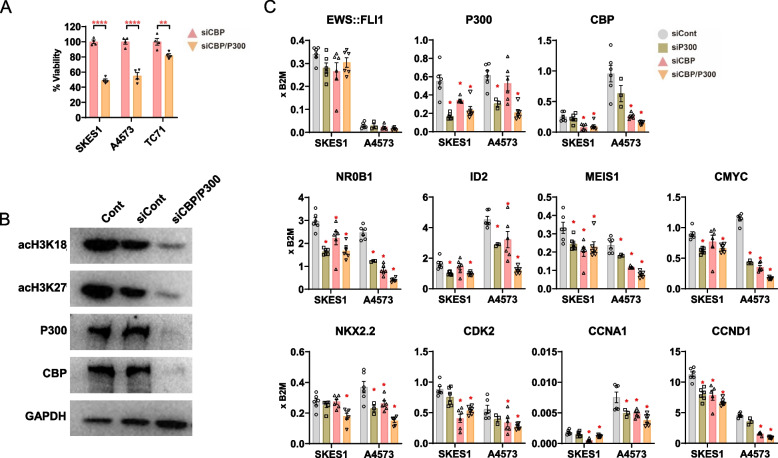
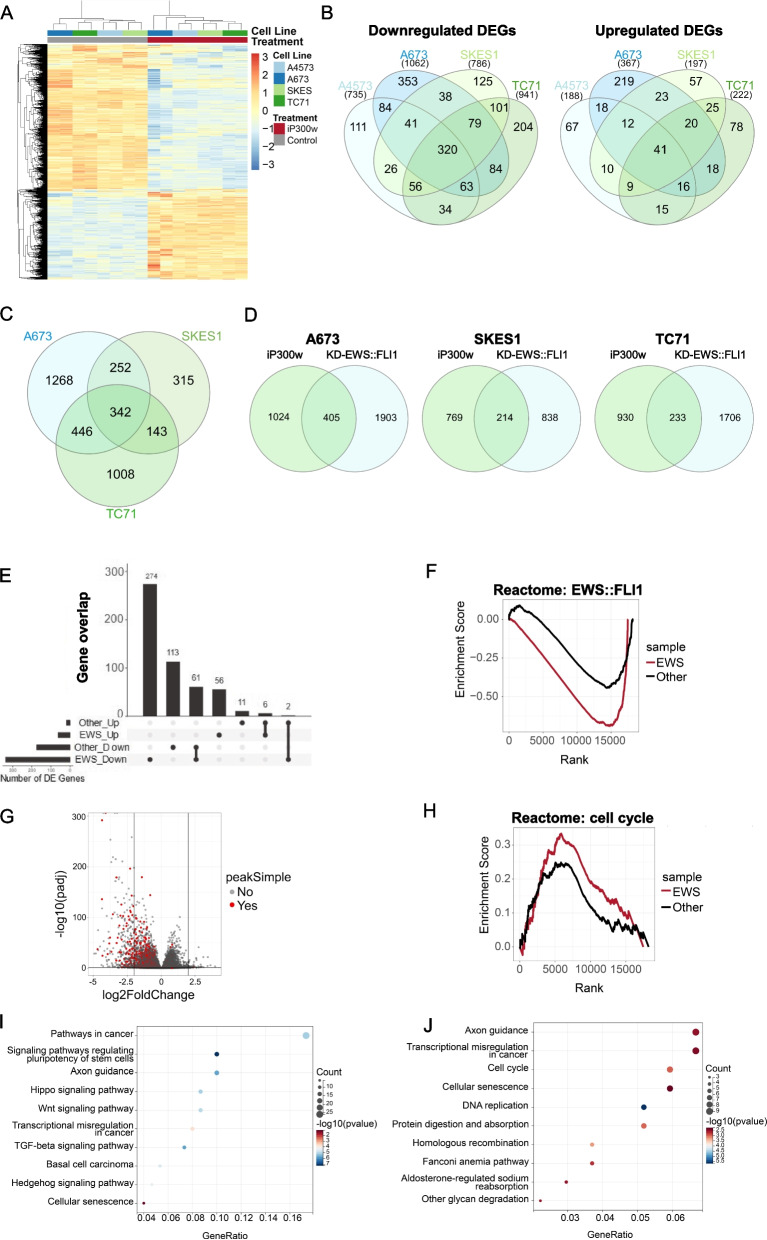
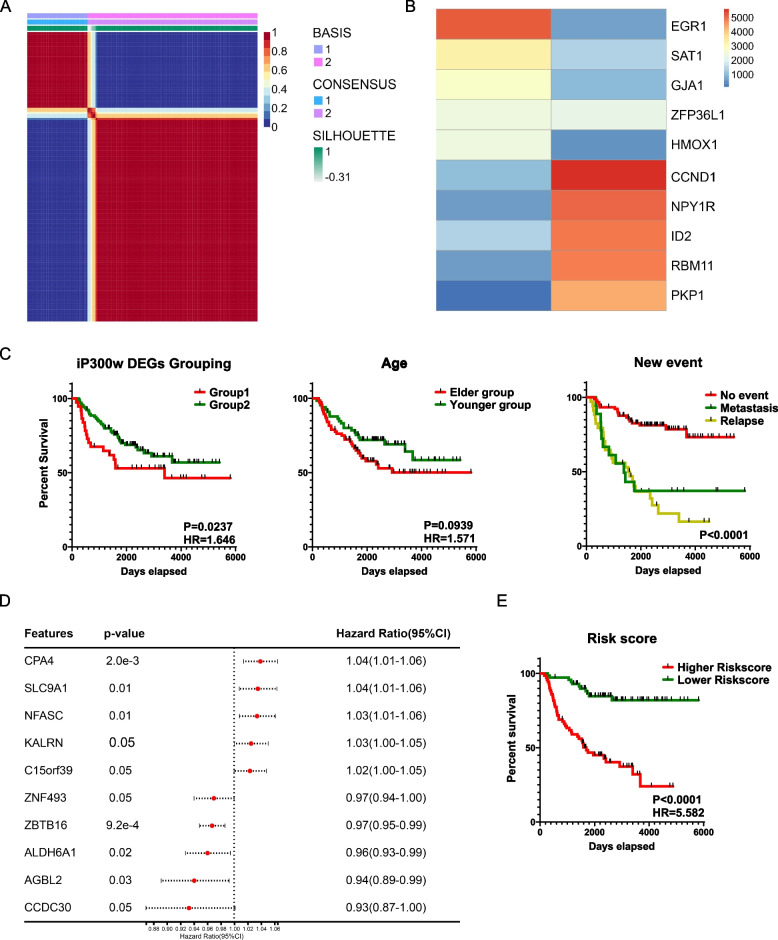
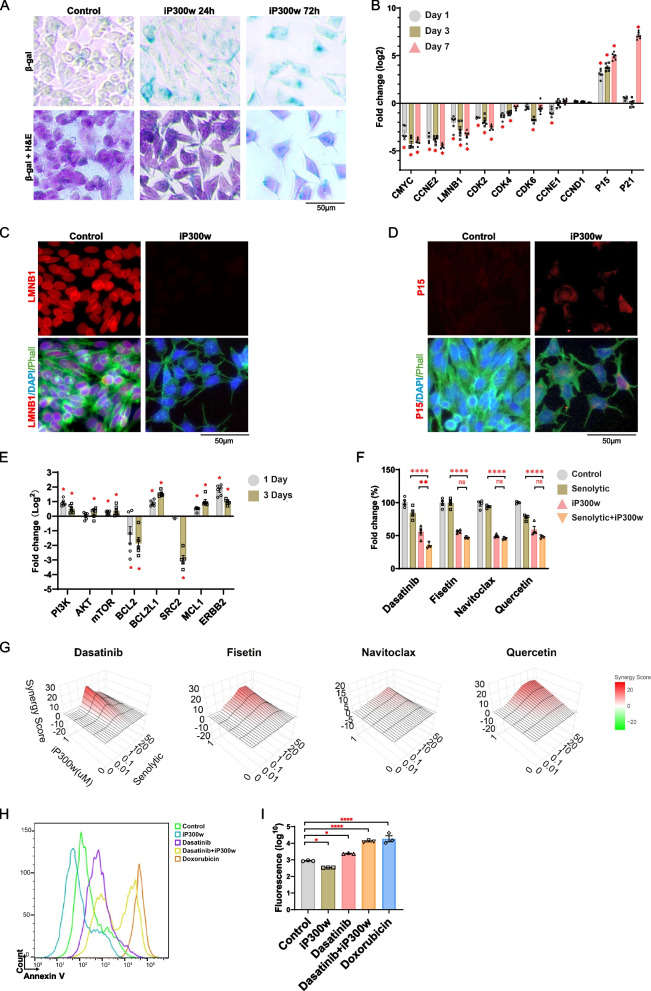
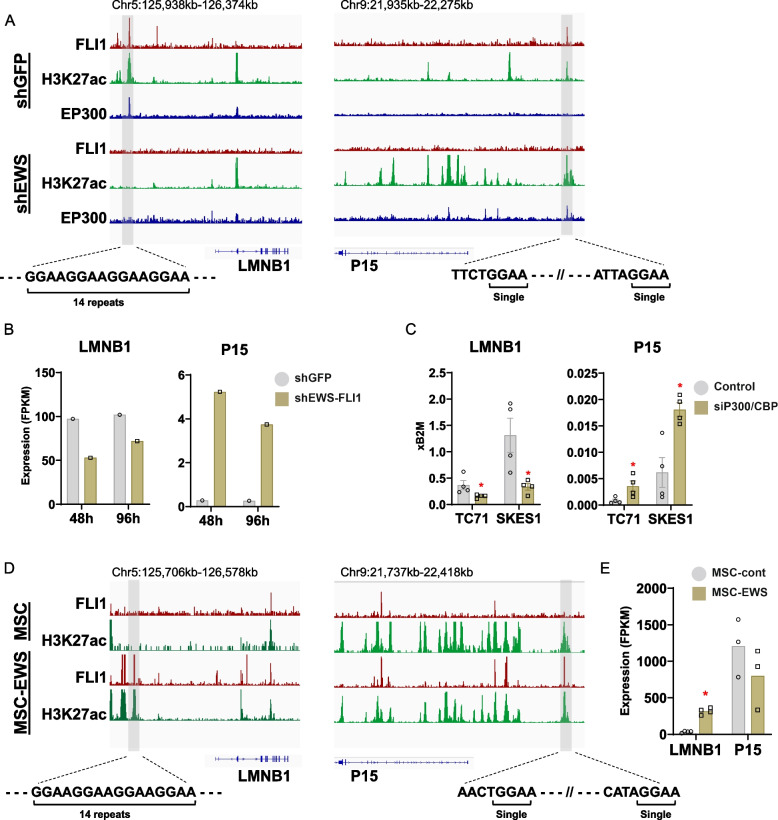
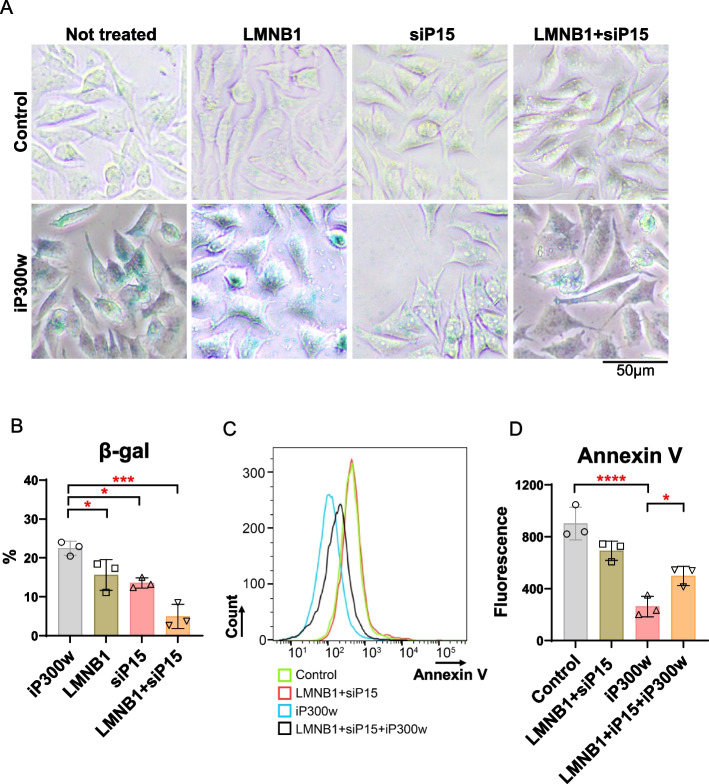
Ewing sarcoma (ES) poses a significant therapeutic challenge due to the difficulty in targeting its main oncodriver, EWS::FLI1. We show that pharmacological targeting of the EWS::FLI1 transcriptional complex via inhibition of P300/CBP drives a global transcriptional outcome similar to direct knockdown of EWS::FLI1, and furthermore yields prognostic risk factors for ES patient outcome. We find that EWS::FLI1 upregulates LMNB1 via repetitive GGAA motif recognition and acetylation codes in ES cells and EWS::FLI1-permissive mesenchymal stem cells, which when reversed by P300 inhibition leads to senescence of ES cells. P300-inhibited senescent ES cells can then be eliminated by senolytics targeting the PI3K signaling pathway. The vulnerability of ES cells to this combination therapy suggests an appealing synergistic strategy for future therapeutic exploration.

Keywords: EWS::FLI1; Ewing sarcoma; Lamin B1; P300/CBP; Pharmacological targeting; Senescence; Senolytics.


Conflict of interest statement

The authors declare no competing interests.

Figures

Fig. 1
Fig. 1
siRNA-mediated knockdown of P300/CBP unveils a pivotal role in ES. A Bar graphs show the significant reduction in cell viability across SKES1, A4573, and TC71 ES cell lines after siRNA-mediated knockdown of P300/CBP at 72 hours. The data represent mean ± SEM; **p<0.001, ****p<0.0001 by two-way ANOVA, n=4. Results are presented as percentage viability, normalized to the control sample. B Western blot analysis confirms the knockdown of P300/CBP at the protein level and reveals decreased levels of acetylated histone markers (acH3K18 and acH3K27) after 48 hours of siRNA treatment. “Cont” refers to untreated cells, “siCont” indicates cells treated with scramble siRNA, and “siCBP/P300” refers to cells treated with siRNA targeting both CBP and P300. C RT-qPCR analysis at 48 hours following P300/CBP knockdown shows decreased expression of EWS::FLI1 regulated genes (NR0B1, MEIS1, c-MYC, ID2) in SKES1 and A4573 cell lines. Silencing P300 or CBP individually led to a reduction in the target genes, with a more pronounced effect observed upon concurrent silencing of both. Data are presented as mean ± SEM; *p<0.05, by two-way ANOVA. Results are presented as relative expression to B2M (n=6)
Fig. 2
Fig. 2
Successful pharmacological targeting of ES using iP300w. A Bar graphs show the dose-dependent inhibition of viability in ES cell lines (SKES1, A673, A4573, and TC71) compared to normal human myoblast cells (LHCN) following iP300w treatment for 48 hours. The ATP assay data are represented as mean ± SEM; p<0.05, by two-way ANOVA. Results are presented as fold difference compared to control (untreated group at 48 hours) (n=3). B SKES1 cell morphology after 48 hours of treatment with 1µM iP300w. Scale bar 100µm. C Immunofluorescence for Ki67 (red) expression in SKES1 cells indicates cell-cycle arrest after 48 hours of iP300w treatment (1 µM). DAPI (blue) was used to stain the nuclei. D Western blot analysis reveals for EWS::FLI1, P300, CBP, acH3K9, acH3K18 and acH3K27, in SKES1 and TC71 cell lines treated with 1 µM iP300w for 4 and 12 hours. E Bar graphs show RT-qPCR results illustrating unchanged EWS::FLI1 expression following P300/CBP inhibition, with a significant reduction in EWS::FLI1 target gene expression (NKX2.2 and CMYC) at 24 hours post-treatment. Data were normalized to B2M. The data represent the mean ± SEM, p< 0.05, by t-test. Results are presented as fold differences compared to the control (untreated group at 24 hours) (n = 6). F Gross morphology of tumors from treated (iP300w, 5.6 mg/kg daily) and control mice at the terminal point of the experiment (day 14). G The graphs display tumor volume and weight measurements, demonstrating significant reductions in tumor size and mass following treatment. Data are presented as mean ± SEM; ***p< 0.001, ****p< 0.0001, by t-test (control, n=6; treatment, n=7). H Western blot for acetylated H3K18 and H3K27 in tumor samples presented in “F”. I RT-qPCR analysis of EWS::FLI1, its target genes, senescence-related genes, and cell cycle genes in the xenografts from experiment “F”. Data were normalized to B2M and compared to the control group using a t-test. The data represent mean ± SEM; *p< 0.05, **p< 0.01, ***p< 0.001, ****p< 0.0001, (control, n=6; treatment, n=7)
Fig. 3
Fig. 3
P300/CBP inhibition and EWS::FLI1 knockdown yield comparable transcriptional changes in ES. A Heatmap illustrates the gene expression profiles of ES cells treated with iP300w (1 µM) for 4 hours, with hierarchical clustering indicating significant concordance among different ES samples. B Venn diagram shows the overlap of DEGs in ES cells post P300/CBP inhibition, with a predominant downregulation of gene expression. C The Venn diagram of DEGs in three ES cell lines following EWS::FLI1 knockdown reveals both common and unique DEGs across the cell lines [23]. D The comparative Venn diagram illustrates the overlap between DEGs in iP300w-treated cells and EWS::FLI1 knockdown cells. E The UpsetR comparative analysis shows the overlap of DEGs between ES cell lines and non-ES cell lines treated with iP300w. F GSEA enrichment analyses revealed significant enrichment (p=8.54e-52) of EWS-FLI1 related pathways (Reactome Riggi) in iP300w-treated ES cell lines compared to other cancer cell lines. The EWS-FLI1 related genes in the “Reactome Riggi” were identified through the overexpression of EWS-FLI1 in human mesenchymal stem cells. G Volcano plot showing the distribution of DEGs influenced by the treatment, with EWS::FLI1 binding sites within 50KB of the promoter region, Canonical GGAA microsatellite EWS-ETS activation sites were identified through ChIP-Seq and selected based on their presence in at least 15 out of 18 ES cell lines [23]. H GSEA enrichment analyses reveal significant enrichment (p=2.18e-4) of cell cycle checkpoints in iP300w-treated ES cell lines (EWS) compared to other cancer cell lines (Other). I KEGG pathway enrichment analyses on DEG in iP300w treated ES cells (4 hours). J KEGG pathway analyses were conducted on DEGs following EWS::FLI1 knockdown in ES cell lines. Note that iP300w and EWS::FLI1 knockdown both affect the cell cycle and induce cell senescence
Fig. 4
Fig. 4
P300/CBP-related genes are linked to poor prognosis in patients with ES. A NMF clustering consensus map categorizing 142 ES patients into two distinct groups based on the expression patterns of iP300w-induced DEGs. B Heatmap illustrates the expression profiles of the top five genes from each group identified by NMF clustering. C Kaplan-Meier survival curves reveal significant differences in survival outcomes between the two patient groups identified through NMF clustering. Additional analyses include survival stratification by median age, as well as metastatic and relapse states. D Cox regression analysis presenting the top five and bottom five hazard ratio genes significantly associated with overall survival among the 74 identified genes. E The Lasso Cox regression model correlates gene expression with overall survival, assigning risk scores based on gene expression levels. Higher risk scores are identified as significant risk factors
Fig. 5
Fig. 5
P300/CBP Inhibition triggers senescence in ES cancer cell lines. A β-Gal and H&E staining in SKES1 cells at 24 and 72 hours of treatments with iP300w. B Gene expression analysis shows changes in proliferation and senescence markers in SKES1 cells following 1, 3, and 7 days of treatment with 1 μM iP300w. Data were normalized to B2M and are presented as fold change compared to the control group. The data represent mean ± SEM; p< 0.05, by one-way ANOVA (n=6). C Immunostaining shows a complete absence of LMNB1 (red) expression in iP300w-treated cells after 72 hours. Phalloidin (green) highlights cell morphology, and DAPI (blue) stains the nuclei. Scale bar: 50 µm. D Immunostaining for P15 in cells treated with iP300w for 72 hours. E RT-qPCR analysis of senolytics target gene expression following 24 and 72 hours of iP300w (1µM) treatment. Data were normalized to B2M and are presented as fold change compared to the control group. The data represent mean ± SEM; *p<0.05, by one-way ANOVA (n=6). F ATP assays show cell viability of SKES1 with different senolytics (1 μM) used alone or combined with iP300w (1 μM) following 72 hours of treatment. The data represent mean ± SEM; **p<0.01, ****p<0.0001 by one-way ANOVA. Results are presented as fold change compared to the control group (n=4). G Synergy scores between iP300w and various senolytics (Dasatinib, Fisetin, Navitoclax, and Quercetin) were calculated using the Highest Single Agent (HSA) model via SynergyFinder Plus. The 3D plots display synergy scores across different concentrations of senolytics (X-axis: 0 μM, 0.01 μM, 0.1 μM, 1 μM, 10 μM, 50 μM) combined with iP300w (Y-axis: 0 μM, 1 μM). The Z-axis represents the synergy score, with positive values indicating synergy and negative values indicating antagonism. The strongest synergistic effects were observed with Dasatinib, while other senolytics demonstrated varying levels of synergy or antagonism. H FACS analysis of Annexin V staining (histogram) in SKES1 cells following 72 hours of treatment with iP300w (1 μM), Dasatinib (1 μM), Dasatinib + iP300w, and Doxorubicin (1 μM). I Quantification of Annexin V staining. Data are presented as log10 fluorescence intensity. The data represent mean ± SEM; *p<0.05, ****p<0.0001 by one-way ANOVA (n=3)
Fig. 6
Fig. 6
EWS::FLI1/ regulates LMNB1 and P15 and cellular senescence in ES. A ChIP-Seq analysis reveals that EWS::FLI1 binds to regulatory elements of LMNB1 and P15 in the SKNMC cell line [8]. Specifically, EWS::FLI1 targets the repetitive GGAA motif in the regulatory elements of LMNB1 and a single motif in P15. EWS::FLI1 binding sites in LMNB1 are associated with P300 and acetylation of H3K27. B Transcriptional levels (RNA-Seq) of LMNB1 and P15 following EWS::FLI1 knockdown (96 hours) reveals reduction of LMNB1 and induction of P15. C RT-qPCR for LMNB1 and P15 expression 48 hours post P300/CBP knockdown. Data were normalized to B2M and are presented as fold change compared to the control group. The data represent mean ± SEM; p<0.05 by t-test (n=4). D ChIP-Seq data shows EWS::FLI1 binding in LMNB1 and P15 regulatory elements in MSC overexpressing EWS::FLI1 [16]. E LMNB1 and P15 expression (RNA-Seq) in MSC overexpressing EWS::FLI1 and GFP control cells. Data are presented as mean expression levels. The data represent mean ± SEM; p<0.05 by t-test (n=4)
Fig. 7
Fig. 7
The restoration of LMNB1 and P15 expression in iP300w-treated cells delays senescence and induces apoptosis. A β-Gal staining was performed on SKES1 cells treated with iP300w (1 µM) for 48 hours, as well as on control untreated cells. LMNB1 refers to SKES1 cells that constitutively overexpress LMNB1 from a viral construct, while siP15 denotes SKES1 cells with P15 knocked down. LMNB1+siP15 refers to the condition where LMNB1 is expressed and P15 is knocked down for 48 hours. B Quantification of β-Gal positive cells presented in “A”. The data represent mean ± SEM; *p<0.05, ***p<0.001 by one-way ANOVA (n=3). C Annexin V staining (histogram) of SKES1 cells in the condition described above. D Quantification of intensity of Annexin V staining. The data represent mean ± SEM; *p<0.05, ****p<0.0001 by one-way ANOVA (n=3)
Fig. 8
Fig. 8
The proposed mechanism by which EWS::FLI1 regulates LMNB1 in ES cancer cell lines. In proliferative ES cells, the EWS::FLI1/P300 complex induces LMNB1 by binding to its enhancer motif containing 14 GGAA repeats. Inhibition of P300/CBP by iP300w treatment suppresses EWS::FLI1 transcriptional activity, leading to reduced LMNB1 transcription. Consequently, SA-β-Ga and other early senescence markers are induced. In a subset of ES cancer cell lines with non-functional P53, EWS::FLI1 binds to a single GGAA motif in the regulatory elements of P15, independent of P300, and represses its transcription. Following treatment with iP300w and subsequent LMNB1 suppression, P15 is rapidly induced, contributing to the induction of senescence in ES cells

References

    1. Hesla AC, Papakonstantinou A, Tsagkozis P. Current status of management and outcome for patients with Ewing Sarcoma. Cancers (Basel). 2021;13(6):1202. - PMC - PubMed
    1. Jurgens H, Dirksen U. Ewing sarcoma treatment. Eur J Cancer. 2011;47(Suppl 3):S366–7. - PubMed
    1. Esiashvili N, Goodman M, Marcus RB Jr. Changes in incidence and survival of Ewing sarcoma patients over the past 3 decades: surveillance epidemiology and end results data. J Pediatr Hematol Oncol. 2008;30(6):425–30. - PubMed
    1. Subbiah V, et al. Ewing’s sarcoma: standard and experimental treatment options. Curr Treat Options Oncol. 2009;10(1–2):126–40. - PubMed
    1. Ghisoli M, et al. Three-year follow up of GMCSF/bi-shRNA(furin) DNA-transfected autologous tumor immunotherapy (Vigil) in metastatic advanced Ewing’s Sarcoma. Mol Ther. 2016;24(8):1478–83. - PMC - PubMed

MeSH terms

LinkOut - more resources