. 2024 Oct 4;12(1):192.
doi: 10.1186/s40168-024-01901-1.

Visceral adiposity in postmenopausal women is associated with a pro-inflammatory gut microbiome and immunogenic metabolic endotoxemia

Affiliations

Visceral adiposity in postmenopausal women is associated with a pro-inflammatory gut microbiome and immunogenic metabolic endotoxemia

Mohamed Gaber et al. Microbiome. .

Abstract

Background: Obesity, and in particular abdominal obesity, is associated with an increased risk of developing a variety of chronic diseases. Obesity, aging, and menopause are each associated with differential shifts in the gut microbiome. Obesity causes chronic low-grade inflammation due to increased lipopolysaccharide (LPS) levels which is termed "metabolic endotoxemia." We examined the association of visceral adiposity tissue (VAT) area, circulating endotoxemia markers, and the gut bacterial microbiome in a cohort of aged postmenopausal women.

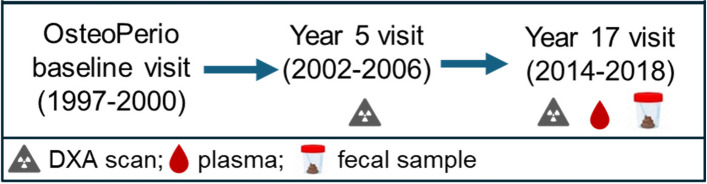
Methods: Fifty postmenopausal women (mean age 78.8 ± 5.3 years) who had existing adipose measurements via dual x-ray absorptiometry (DXA) were selected from the extremes of VAT: n = 25 with low VAT area (45.6 ± 12.5 cm2) and n = 25 with high VAT area (177.5 ± 31.3 cm2). Dietary intake used to estimate the Healthy Eating Index (HEI) score was assessed with a food frequency questionnaire. Plasma LPS, LPS-binding protein (LBP), anti-LPS antibodies, anti-flagellin antibodies, and anti-lipoteichoic acid (LTA) antibodies were measured by ELISA. Metagenomic sequencing was performed on fecal DNA. Female C57BL/6 mice consuming a high-fat or low-fat diet were treated with 0.4 mg/kg diet-derived fecal isolated LPS modeling metabolic endotoxemia, and metabolic outcomes were measured after 6 weeks.

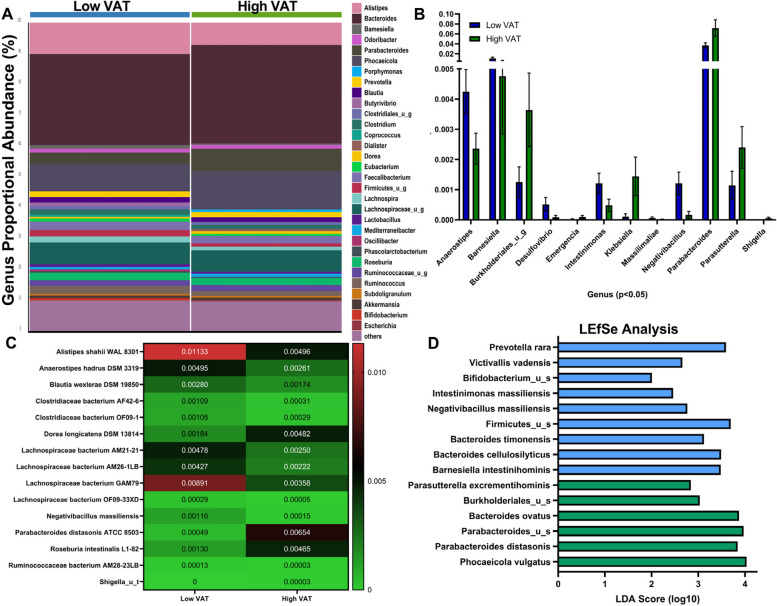
Results: Women in the high VAT group showed increased Proteobacteria abundance and a lower Firmicutes/Bacteroidetes ratio. Plasma LBP concentration was positively associated with VAT area. Plasma anti-LPS, anti-LTA, and anti-flagellin IgA antibodies were significantly correlated with adiposity measurements. Women with high VAT showed significantly elevated LPS-expressing bacteria compared to low VAT women. Gut bacterial species that showed significant associations with both adiposity and inflammation (anti-LPS IgA and LBP) were Proteobacteria (Escherichia coli, Shigella spp., and Klebsiella spp.) and Veillonella atypica. Healthy eating index (HEI) scores negatively correlated with % body fat and anti-LPS IgA antibodies levels. Preclinical murine model showed that high-fat diet-fed mice administered a low-fat diet fecal-derived LPS displayed reduced body weight, decreased % body fat, and improved glucose tolerance test parameters when compared with saline-injected or high-fat diet fecal-derived LPS-treated groups consuming a high-fat diet.

Conclusions: Increased VAT in postmenopausal women is associated with elevated gut Proteobacteria abundance and immunogenic metabolic endotoxemia markers. Low-fat diet-derived fecal-isolated LPS improved metabolic parameters in high-fat diet-fed mice giving mechanistic insights into potential pro-health signaling mediated by under-acylated LPS isoforms. Video Abstract.

Keywords: Aging; Inflammation; Leaky gut; Lipopolysaccharide; Menopause; Metabolic endotoxemia; Microbiome; Obesity; Women’s Health Initiative.


Conflict of interest statement

The authors declare no competing interests.

Figures

Fig. 1
Fig. 1
OsteoPerio study visits and sample collection
Fig. 2
Fig. 2
Visceral adipose tissue (VAT) area and gut microbiome diversity in elderly postmenopausal women. A There was no discernable difference in the Chao1 α-diversity measurements in women with differing VAT areas (p = 0.49). B Shannon α-diversity was not modified by visceral adiposity (p = 0.12). n = 23–24; two-tailed Mann–Whitney U-test. C Principal coordinate analysis (PCoA) Bray–Curtis β-diversity PERMANOVA analysis indicates a trend (p = 0.06) in dissimilarity between the gut bacterial populations in elderly postmenopausal women with high vs low VAT area. n = 23–24; PERMANOVA
Fig. 3
Fig. 3
Adiposity is associated with key differences in phyla gut microbiome populations. Phyla level changes in gut bacterial microbiome populations in postmenopausal women with high or low VAT area. A Relative abundance of bacterial phyla in fecal samples is visualized by bar plots. Each bar represents the subjects aggregated by cohort and each colored box a bacterial taxon. The height of a color box represents the relative abundance of that organism within the sample. “Other” represents lower abundance taxa. B VAT area did not affect Bacteroidetes phylum proportional abundance. C There were no significant differences in the proportional abundance of Firmicutes in fecal samples from high VAT or low VAT postmenopausal women. D Postmenopausal women with low VAT area display an elevated Firmicutes/Bacteroidetes ratio when compared with participants with higher visceral adiposity. E Postmenopausal women with high VAT area display elevated proportional abundance of fecal Proteobacteria. n = 23–24. *p < 0.05, **p < 0.01 two-tailed Mann–Whitney U-test
Fig. 4
Fig. 4
Postmenopausal women with differing VAT status display differential enrichment of bacterial genera, species, and strains within their gut microbiomes. A Relative abundance of bacterial genera in fecal samples is visualized by bar plots. Each bar represents the subjects aggregated by cohort and each colored box a bacterial taxon. The height of a color box represents the relative abundance of that organism within the group. “Other” represents lower abundance taxa. B Proportional abundance of significant genera by VAT area. C Heatmap of bacterial strains identified as significantly different by VAT area. Relative mean abundance is displayed in cell. n = 23–24. *p < 0.05, two-tailed Mann–Whitney U-test. D Linear discriminant analysis Effect Size (LEfSe) method identifying differentially enriched taxa by VAT area
Fig. 5
Fig. 5
Circulating LPS-binding protein and anti-LPS IgA antibody concentrations correlates with body fat mass and BMI indexes. A Plasma LPS (pg/mL) was not significantly modulated by VAT area. B Plasma LPS-binding protein (LBP) was elevated in the high VAT group compared with the low VAT group (13.6 µg/mL vs 9.3 µg/mL). C Plasma anti-LPS IgG was not shifted by VAT area. D Plasma anti-LPS IgA was elevated in high VAT group when compared with low VAT group (0.69 AU vs. 0.39 AU). n = 23–24, *p < 0.05 Welch’s t-test. E Plasma LBP concentrations significantly correlated with participant BMI (r = 0.396; p = 0.006). F Plasma LBP concentrations significantly correlated with participant % body fat (r = 0.359; p = 0.013). E Plasma anti-LPS IgA concentrations significantly correlated with participant BMI (r = 0.441; p = 0.0014). F Plasma anti-LPS IgA concentrations significantly correlated with participant % body fat (r = 0.440; p = 0.0014). n = 23–24. Pearson’s correlation coefficient (r)
Fig. 6
Fig. 6
LPS-expressing bacterial species correlate with both body adiposity measurements and inflammatory indicators in elderly postmenopausal women. A LPS-expressing bacteria proportional abundance by lpxA and lpxB gene expression in low VAT and high VAT women. B % Alistipes of LPS-expressing microbes is significantly higher in low VAT women than in high VAT women. C No difference in proportional abundance % Bacteroides of LPS-expressing microbes in fecal samples between groups. D No difference in proportional abundance % Prevotella of LPS-expressing microbes in fecal samples between groups. E Elevated proportional abundance of Proteobacteria of the LPS-expressing microbes is observed in high VAT area participants when compared with low VAT women. F Correlation matrix of LPS-containing gut bacteria that are significantly associated with body anthropometric and gut inflammation markers. Bacteria are presented in ascending order of p-value for association with BMI. Bacteria in bold are those that significantly correlated with both BMI and anti-LPS IgA production
Fig. 7
Fig. 7
Diet-associated LPS differentially modulates metabolic outcomes. A Healthy Eating Index 2015 (HEI-2015) scores negatively correlated with total % body fat (Pearson’s correlation coefficient r =  − 0.3448, p = 0.0153, n = 50). B HEI-2015 score negatively correlated with plasma anti-LPS IgA antibody concentrations (Pearson’s correlation coefficient r =  − 0.3421, p = 0.0200, n = 50). C Correlation matrix of LPS-containing gut bacteria that are significantly associated with body anthropometric and HEI-2015. Bacteria in bold are those that significantly correlated with both BMI and anti-LPS IgA production. *p < 0.05, n = 50. D. Female C57BL/6 mouse body weight of low-fat and high-fat diet-fed mice given saline and LPS interventions modeling metabolic endotoxemia concentrations. LPS was isolated from fecal samples collected from low-fat diet-fed mice (LF-LPS) and high-fat diet-fed mice (HF-LPS); n = 5–6, *p < 0.05. E Body fat composition of low-fat diet-fed and high-fat diet-fed saline and diet-fecal-derived LPS-treated animals at the end of the study. F Blood glucose concentrations in low-fat diet-fed and high-fat diet-fed saline and diet-fecal-derived LPS-treated animals at the end of the study during a glucose tolerance test. *p < 0.05 compared to low-fat diet groups, *colored to group. G Blood glucose area under the curve (AUC) of low-fat diet-fed and high-fat diet-fed saline and diet-fecal-derived LPS-treated animals at the end of the study. n = 5–6; *p < 0.05

References

    1. Hales CM, Carroll MD, Fryar CD, Ogden CL. Prevalence of obesity and severe obesity among adults: United States, 2017–2018. NCHS Data Brief. 2020;360:1–8. - PubMed
    1. Ley RE, Turnbaugh PJ, Klein S, Gordon JI. Microbial ecology: human gut microbes associated with obesity. Nature. 2006;444(7122):1022–3. - PubMed
    1. Nagpal R, Newman TM, Wang S, Jain S, Lovato JF, Yadav H. Obesity-linked gut microbiome dysbiosis associated with derangements in gut permeability and intestinal cellular homeostasis independent of diet. J Diabetes Res. 2018;2018:3462092. - PMC - PubMed
    1. Turnbaugh PJ, Ley RE, Mahowald MA, Magrini V, Mardis ER, Gordon JI. An obesity-associated gut microbiome with increased capacity for energy harvest. Nature. 2006;444(7122):1027–31. - PubMed
    1. Nicholson JK, Holmes E, Kinross J, Burcelin R, Gibson G, Jia W, et al. Host-gut microbiota metabolic interactions. Science. 2012;336(6086):1262–7. - PubMed

MeSH terms

LinkOut - more resources