. 2024 Oct 4;22(1):900.
doi: 10.1186/s12967-024-05685-8.

Multi-omics analysis unveils the predictive value of IGF2BP3/SPHK1 signaling in cancer stem cells for prognosis and immunotherapeutic response in muscle-invasive bladder cancer

Affiliations

Multi-omics analysis unveils the predictive value of IGF2BP3/SPHK1 signaling in cancer stem cells for prognosis and immunotherapeutic response in muscle-invasive bladder cancer

Yaobang Wang et al. J Transl Med. .

Erratum in

Abstract

Background: Muscle invasive bladder cancer (MIBC) is a life-threatening malignant tumor characterized by high metastasis rates, poor prognosis, and limited treatment options. Immune checkpoint inhibitors (ICIs) targeting PD-1 and PD-L1 represent an emerging treatment for MIBC immunotherapy. However, the characteristics of patients likely to benefit from immunotherapy remain unclear.

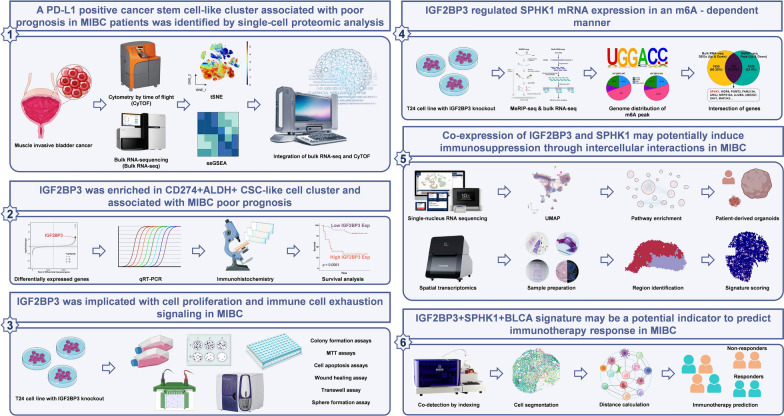
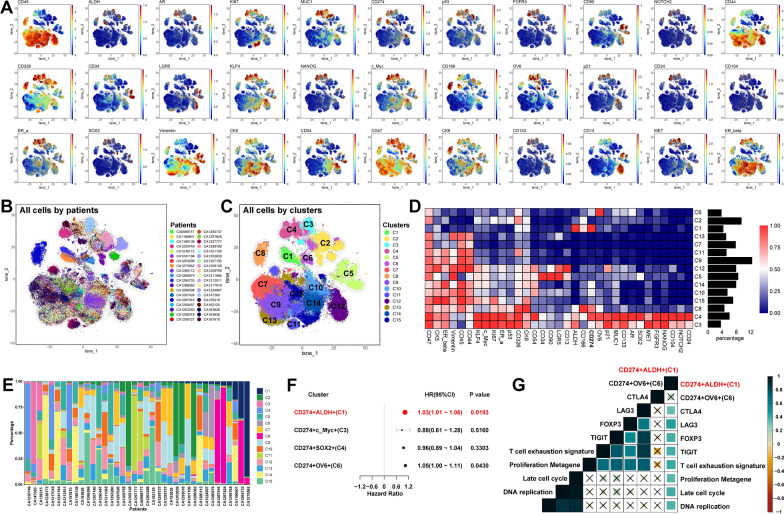
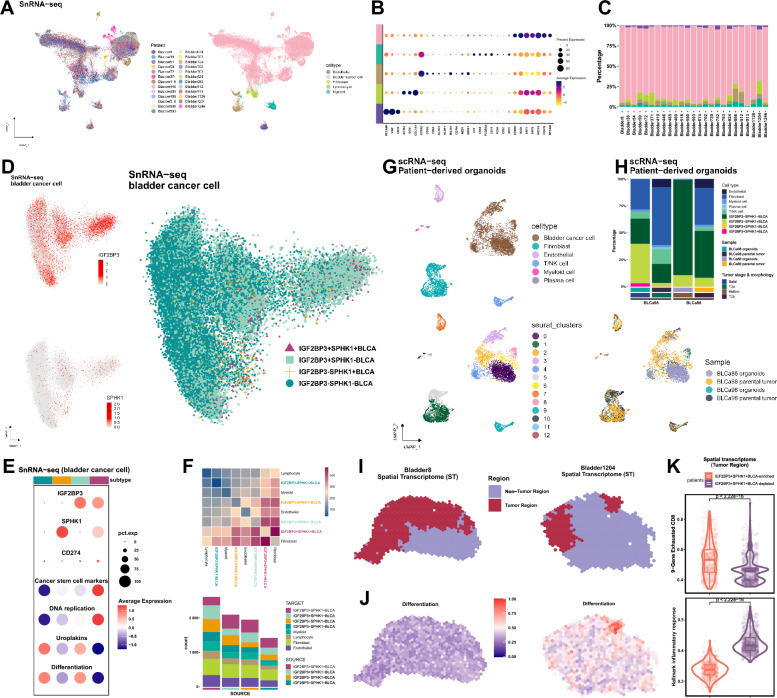
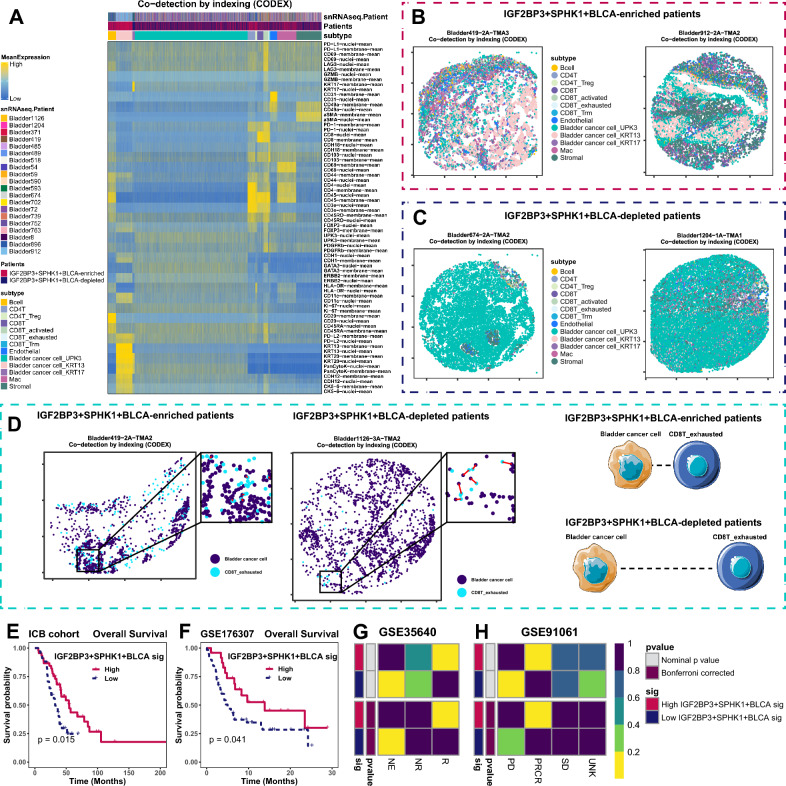
Methods: We performed single-cell mass cytometry (CyTOF) analysis of 179,483 single cells to characterize potential immunotherapy-related cancer stem cells (CSCs)-like populations in the tumor microenvironment of 38 MIBC tissues. The upregulated expression of IGF2BP3 in CD274 + ALDH + CSC-like cells, which was associated with poor clinical prognosis, was analyzed by bulk RNA-sequencing data from an in-house cohort. The functional role of IGF2BP3 was determined through cell proliferation, colony formation, cell apoptosis and sphere formation assays. The regulation of SPHK1 expression by IGF2BP3 was investigated using methylated RNA immunoprecipitation sequencing (MeRIP-seq) and bulk RNA-sequencing (bulk RNA-seq). We further utilized single-nucleus RNA sequencing (snRNA-seq) data from 67,988 cells of 25 MIBC tissues and single-cell RNA sequencing (scRNA-seq) data from MIBC patient-derived organoids to characterize the molecular features of bladder cancer cells co-expressing IGF2BP3 and SPHK1. Spatial transcriptomics (ST) and co-detection by indexing (CODEX) analysis were used to describe the spatial distribution and interactions of IGF2BP3 + SPHK1 + bladder cancer cells and immune cells.

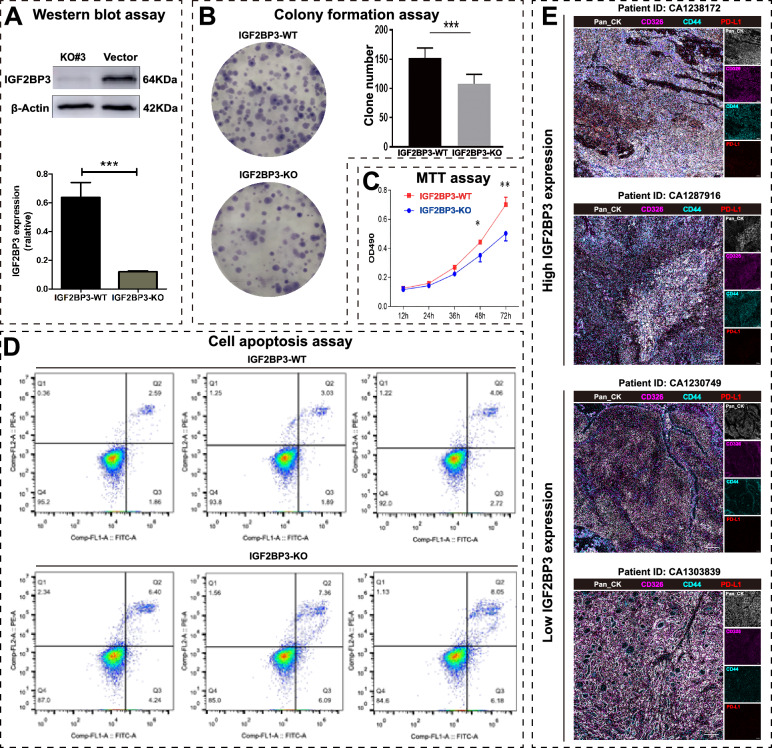
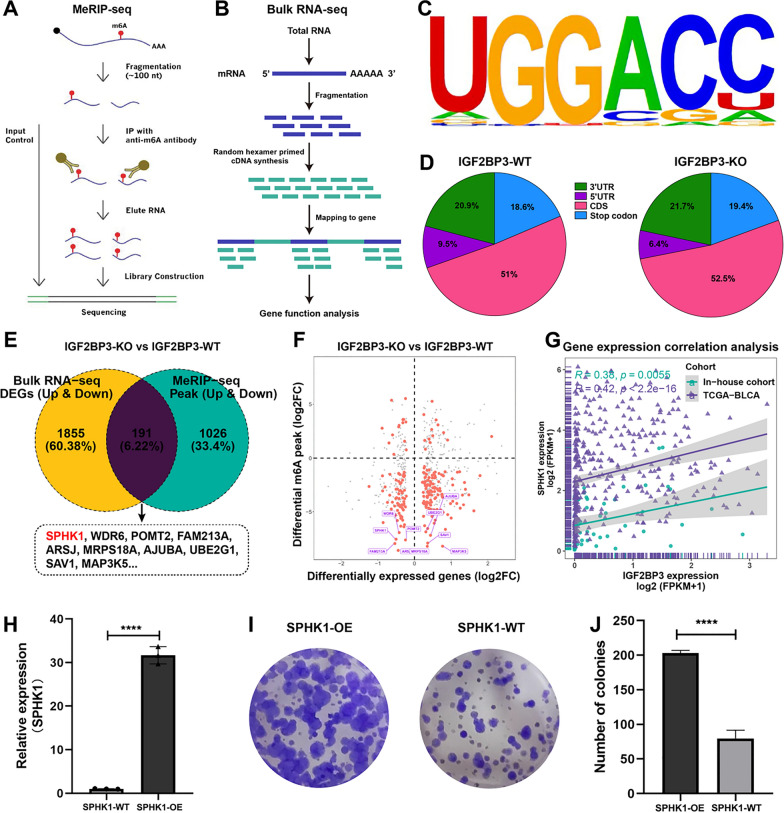
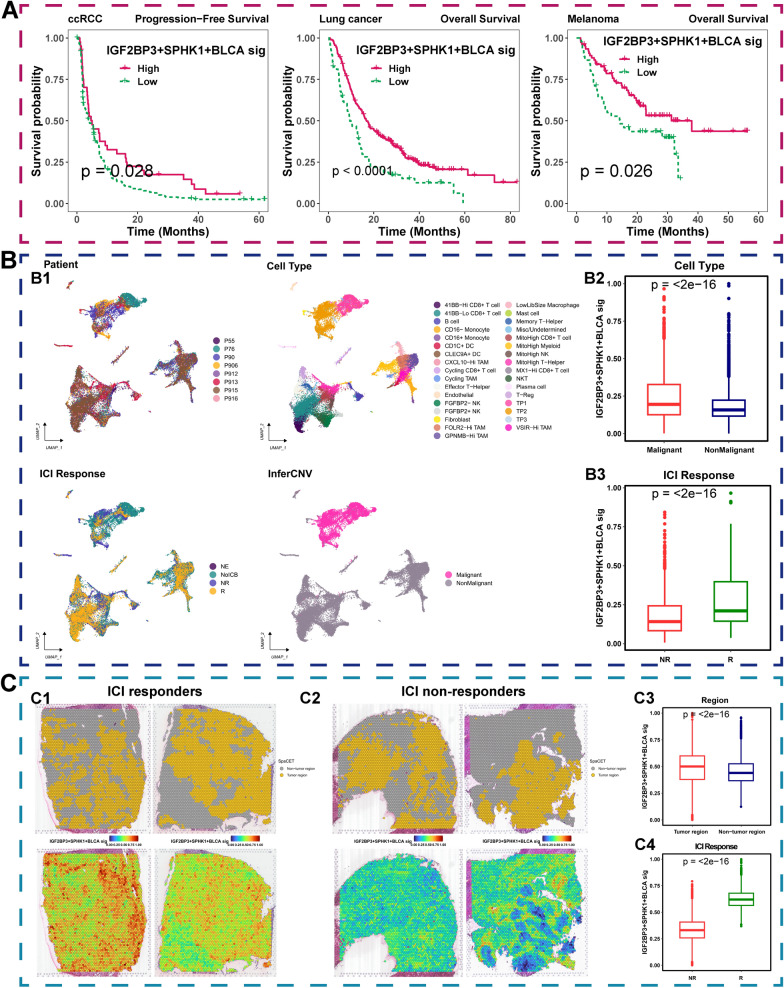
Results: A subset of CD274 + ALDH + CSC-like cells was identified, associating with immunosuppression and low survival rates in MIBC patients. IGF2BP3, an m6A reader gene, was found to be upregulated in the CD274 + ALDH + CSC-like cell population and linked to poor clinical prognosis in MIBC. Knockout of IGF2BP3 dramatically promoted cell apoptosis and reduced cell proliferation in T24 cells. By integrating MeRIP-seq and bulk RNA-seq analyses, we identified SPHK1 served as a substrate for IGF2BP3 in an m6A-dependent manner. Further snRNA-seq, scRNA-seq, ST, and CODEX analysis revealed a closer topographical distance between IGF2BP3 + SPHK1 + bladder cancer cells and exhausted CD8 + T cells, providing one explanation for the superior response to immunotherapy in IGF2BP3 + SPHK1 + bladder cancer cells-enriched patients. Finally, an ICI-associated signature was developed based on the enriched genes of IGF2BP3 + SPHK1 + bladder cancer cells, and its potential ability to predict the response to immunotherapy was validated in two independent immunotherapy cohort.

Conclusions: Our study highlighted the critical involvement of the IGF2BP3/SPHK1 signaling in maintaining the stemness of CSCs and promoting MIBC progression. Additionally, these findings suggested that the IGF2BP3/SPHK1 signaling might serve as a biomarker for prognosis and immunotherapy response in MIBC.

Keywords: Cancer stem cells; IGF2BP3; Immunotherapy; Muscle invasive bladder cancer; SPHK1.


Conflict of interest statement

The authors have declared no competing interests.

Figures

Fig. 1
Fig. 1
Workflow of our research
Fig. 2
Fig. 2
Cytometry by time of flight (CyTOF) analysis illustrates CSC-like cell clusters associated with poor patient prognosis and immunosuppression. A The t-SNE plot displays the expression of tumor microenvironment related markers in different cell clusters. B, C The t-SNE plot displays the distribution of patients (B) and cell clusters (C). D Heatmap illustrates the expression profiles of markers related to tumor stemness and immunosuppression across 15 cell clusters. The proportion of cells in each cell cluster relative to the total cell count are shown as bar plots on the right side. E The stacked bar chart indicates the proportions of 15 cell clusters in each MIBC sample. F Forest plot of univariate COX regression (Number of patients: 38). G Correlation heatmap shows that the proportion of CD274 + ALDH + (C1) correlated with immunosuppressive markers and signatures
Fig. 3
Fig. 3
IGF2BP3 is activated in MIBC and corelated with poor prognosis. A Bubble-rank plot shows differentially expressed genes. B Scatter plot shows that IGF2BP3 expression is significantly positively correlated with CD274 + ALDH + (C1) signal in TCGA-BLCA cohort. C, D. Boxplots shows that the expression of IGF2BP3 in MIBC tissues (CA) was significantly higher than that in adjacent normal tissues (CP) in in-house (C) and TCGA-BLCA cohorts (D). E QRT-PCR detection of IGF2BP3 gene expression levels in 19 MIBC and 19 adjacent normal tissues, CA: MIBC tissues, CP: adjacent normal tissues. F Immunohistochemical staining results of IGF2BP3 in MIBC and adjacent normal tissues in in-house cohort. G Immunohistochemical staining results of IGF2BP3 in urothelial carcinoma and normal tissues in HPA database. H Kaplan–Meier curves of overall survival (OS) are plotted for MIBC patients in in-house cohorts, stratified according to the expression levels of IGF2BP3. IK Kaplan–Meier curves of overall survival (OS) are plotted for MIBC patients in the TCGA-BLCA (I), GSE32894 (J), and GSE48276 (K) cohorts, stratified according to the expression levels of IGF2BP3
Fig. 4
Fig. 4
IGF2BP3 knockout inhibits proliferation and induces apoptosis in the T24 cell line. A Western blot analysis is employed to determine the expression level of IGF2BP3 in T24 cell lines. B Comparison of the clone-forming ability of IGF2BP3-WT and IGF2BP3-KO cells by plate cloning. WT: wild type, KO: knockout; *P < 0.05, **P < 0.01, ***P < 0.001. C Comparison of the proliferative ability of IGF2BP3-WT and IGF2BP3-KO cells by MTT proliferation assay. D Apoptosis rate of IGF2BP3-WT and IGF2BP3-KO cells by flow cytometry. E Comparison of the protein expression levels of CD44, CD326 and PD-L1 between high and low IGF2BP3 expression groups
Fig. 5
Fig. 5
Identification of the potential IGF2BP3 targets in bladder cancer. A, B MeRIP sequencing (A) and bulk RNA sequencing (B) process. C, D IGF2BP3 motif (binding motif) (C), m6A peak distribution in IGF2BP3-WT and IGF2BP3-KO RNA structure (D). WT: wild type, KO: knockout. E Venn diagram is utilized to illustrate the intersecting genes from both differentially expressed genes analysis and differential m6A peak profiling, comparing IGF2BP3-KO with IGF2BP3-WT cells. F Four-quadrant plot depicts differentially expressed genes and m6A differential peak genes between IGF2BP3-KO and IGF2BP3-WT cells. G Correlation analysis of SPHK1 and IGF2BP3 expression in in-house and TCGA-BLCA cohorts. H QRT-PCR shows the relative SPHK1 expression of SPHK1-OE and SPHK1-WT cells. OE: overexpression, WT: wild type. I, J Comparison of the clone-forming ability of SPHK1-OE and SPHK1-WT cells
Fig. 6
Fig. 6
snRNA-seq, scRNA-seq and ST reveal the molecular features of IGF2BP3 + SPHK1 + BLCA. A Uniform Manifold Approximation and Projection (UMAP) plot shows consistent clusters of bladder cancer cells, stromal cells, and immune cells from 25 MIBC patients. B. Bubble chart shows the expression of classical markers between different cell types. C. The stacked bar chart shows the proportion of different cell types in each MIBC patient. D UMAP plot shows the expression of IGF2BP3 and SPHK1 in bladder cancer tumor cell subtypes. E Bubble chart shows the expression of stemness and differentiation-related markers in bladder cancer tumor cell subtypes. F. The heatmap and stacked bar chart display the number of ligand-receptor interactions between different cell types. G. UMAP plot shows consistent clusters of bladder cancer cells, stromal cells, and immune cells from 2 PTs and 2 PDOs. H. The stacked bar chart shows the proportion of different cell types in PTs and PDOs. I, J ST shows tumor region (I) and differentiation signature (J) in Bladder8 (IGF2BP3 + SPHK1 + BLCA-enriched patients) and Bladder1204 (IGF2BP3 + SPHK1 + BLCA-depleted patients). K Violin plot shows 9-gene exhausted CD8 and hallmark inflammatory response in tumor region for IGF2BP3 + SPHK1 + BLCA-enriched (Bladder8) and -depleted (Bladder72, Bladder371 and Bladder1024) patients
Fig. 7
Fig. 7
High IGF2BP3 + SPHK1 + BLCA signature predicts the response to immunotherapy. A Heatmaps shows antibody expression (rows) for each cell type/patients/groups (columns) in 20 MIBC patients (corresponding samples for snRNA-seq). Five percent of cells are randomly selected for each cell type. Yellow: high expression; Blue: low expression. B, C Four representative samples (IGF2BP3 + SPHK1 + BLCA-enriched patients: Bladder419 and Bladder912; IGF2BP3 + SPHK1 + BLCA-depleted patients: Bladder674 and Bladder1204) shows the distribution of different cell types. D Bladder cancer cells in IGF2BP3 + SPHK1 + BLCA-enriched patient is located closer to exhausted CD8 than those in IGF2BP3 + SPHK1 + BLCA-depleted patient. E, F Survival prognosis analysis of the ICB cohort; patients are stratified based on IGF2BP3 + SPHK1 + BLCA sig, with those above the cutoff designated as the high IGF2BP3 + SPHK1 + BLCA sig group (red). G, H Prediction of response to ICBs (anti-PD1 and anti-CTLA4) therapy in high and low IGF2BP3 + SPHK1 + BLCA sig groups. CR/PR: complete response/partial response; SD/PD: stable disease/progressive disease; NR: non-responder, R: responder; NE: not evaluable
Fig. 8
Fig. 8
High IGF2BP3 + SPHK1 + BLCA signature predicts immunotherapy response in pan-cancer. A Survival prognosis analysis of the ccRCC, lung cancer, and melanoma cohort; patients are stratified based on IGF2BP3 + SPHK1 + BLCA sig, with those above the cutoff designated as the high IGF2BP3 + SPHK1 + BLCA sig group (red). B (B1) UMAP plot shows consistent clusters of malignant cells, stromal cells, and immune cells from 8 ccRCC patients. Color dots indicate patients, cell types, ICI response state, and identification of malignant cells, respectively. (B2) Boxplot shows that IGF2BP3 + SPHK1 + BLCA sig in malignant cells was significantly higher than that in non-malignant cells. (B3) Boxplot shows that IGF2BP3 + SPHK1 + BLCA sig in malignant cells of ICI responders and non-responders. R: responder; NR: non-responder. C (C1) Presentation of tumor region identification (upper panel) and IGF2BP3 + SPHK1 + BLCA sig (lower panel) in two representative HCC sections from ICI responders. (C2) Presentation of tumor region identification (upper panel) and IGF2BP3 + SPHK1 + BLCA sig (lower panel) in two representative HCC sections from ICI non-responders. (C3) Boxplot shows that IGF2BP3 + SPHK1 + BLCA sig in tumor region was significantly higher than that in non-tumor region. (C4) Boxplot shows that IGF2BP3 + SPHK1 + BLCA sig in tumor region of ICI responders and non-responders

Similar articles

Cited by

References

    1. Lobo N, Afferi L, Moschini M, Mostafid H, Porten S, Psutka SP, Gupta S, Smith AB, Williams SB, Lotan Y. Epidemiology, screening, and prevention of bladder cancer. Eur Urol Oncol. 2022;5:628–39. - PubMed
    1. van Hoogstraten LMC, Vrieling A, van der Heijden AG, Kogevinas M, Richters A, Kiemeney LA. Global trends in the epidemiology of bladder cancer: challenges for public health and clinical practice. Nat Rev Clin Oncol. 2023;20:287–304. - PubMed
    1. Sung H, Ferlay J, Siegel RL, Laversanne M, Soerjomataram I, Jemal A, Bray F. Global Cancer Statistics 2020: GLOBOCAN estimates of incidence and mortality worldwide for 36 cancers in 185 countries. CA Cancer J Clin. 2021;71:209–49. - PubMed
    1. Babjuk M, Burger M, Capoun O, Cohen D, Compérat EM, Dominguez Escrig JL, Gontero P, Liedberg F, Masson-Lecomte A, Mostafid AH, et al. European Association of Urology guidelines on non-muscle-invasive bladder cancer (Ta, T1, and carcinoma in situ). Eur Urol. 2022;81:75–94. - PubMed
    1. Dyrskjøt L, Hansel DE, Efstathiou JA, Knowles MA, Galsky MD, Teoh J, Theodorescu D. Bladder cancer. Nat Rev Dis Primers. 2023;9:58. - PMC - PubMed

MeSH terms

Substances