. 2024 Oct 4;22(1):476.
doi: 10.1186/s12964-024-01841-1.

STAT3 blockade ameliorates LPS-induced kidney injury through macrophage-driven inflammation

Affiliations

STAT3 blockade ameliorates LPS-induced kidney injury through macrophage-driven inflammation

Song-Hee Lee et al. Cell Commun Signal. .

Abstract

Background: Signal transducer and activator of transcription 3 (STAT3), a multifaceted transcription factor, modulates host immune responses by activating cellular response to signaling ligands. STAT3 has a pivotal role in the pathophysiology of kidney injury by counterbalancing resident macrophage phenotypes under inflammation conditions. However, STAT3's role in acute kidney injury (AKI), particularly in macrophage migration, and in chronic kidney disease (CKD) through fibrosis development, remains unclear.

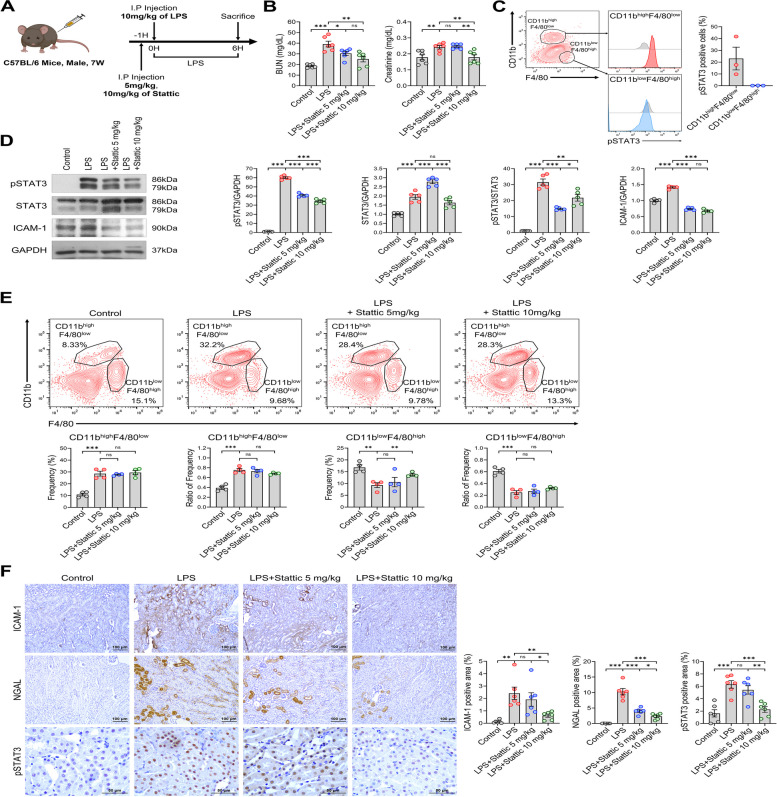
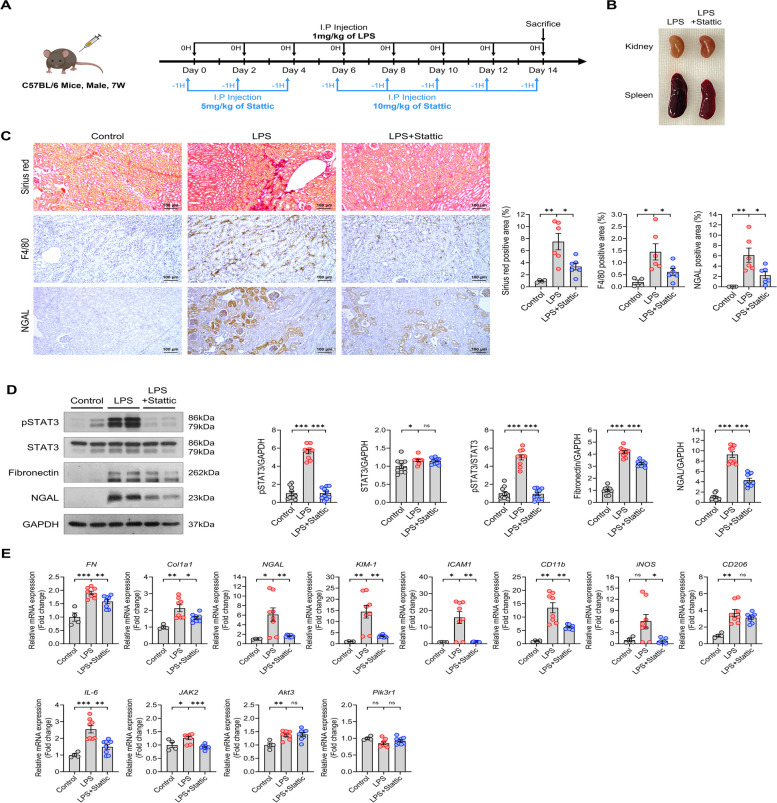
Methods: Stattic (a JAK2/STAT3 inhibitor, 5 mg/kg or 10 mg/kg) was administered to evaluate the therapeutic effect on LPS-induced AKI (L-AKI) and LPS-induced CKD (L-CKD), with animals sacrificed 6-24 h and 14 days post-LPS induction, respectively. The immune mechanisms of STAT3 blockade were determined by comparing the macrophage phenotypes and correlated with renal function parameters. Also, the transcriptomic analysis was used to confirm the anti-inflammatory effect of L-AKI, and the anti-fibrotic role was further evaluated in the L-CKD model.

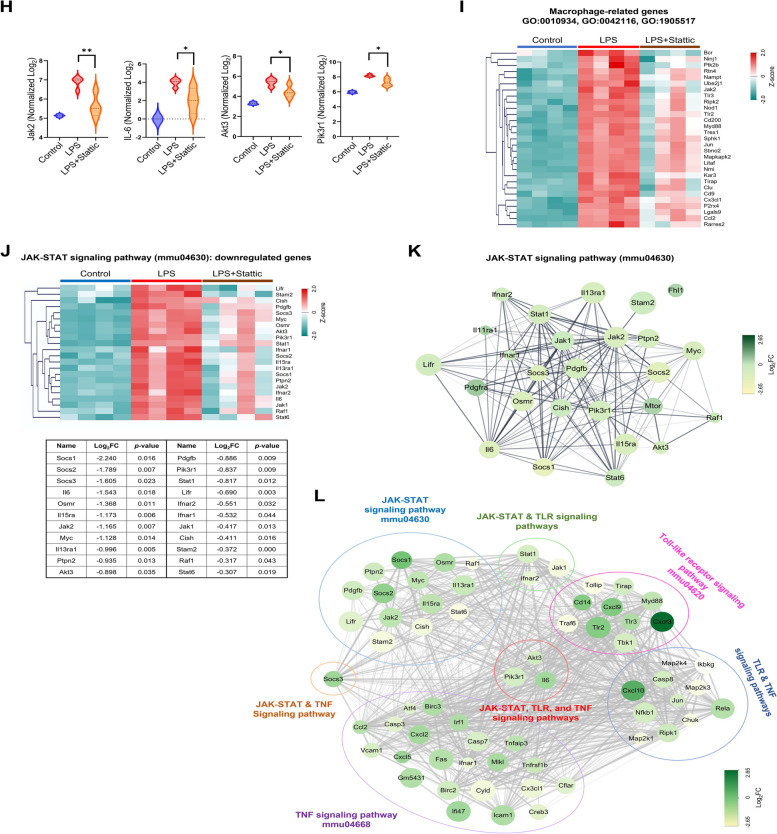
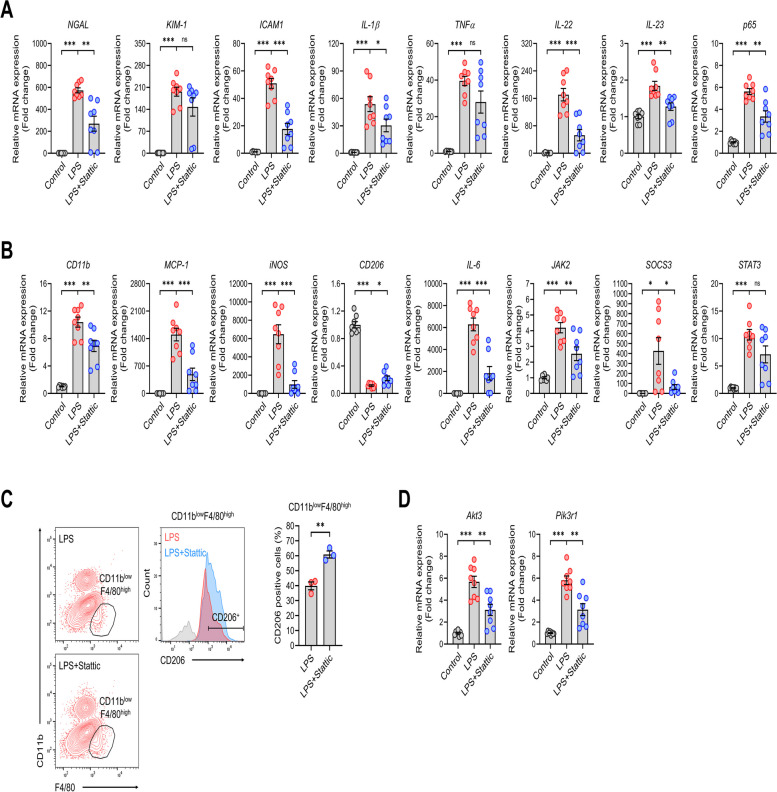
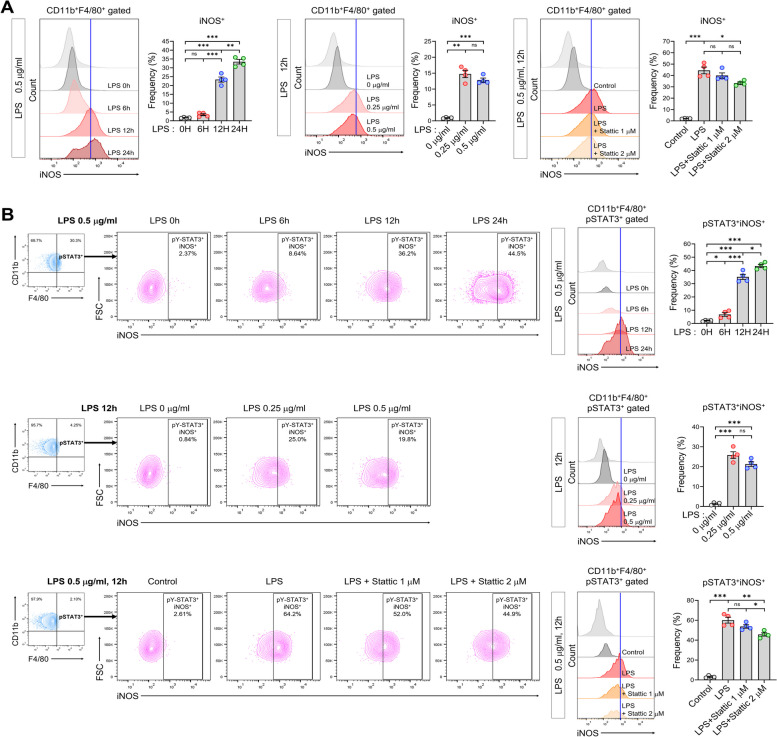
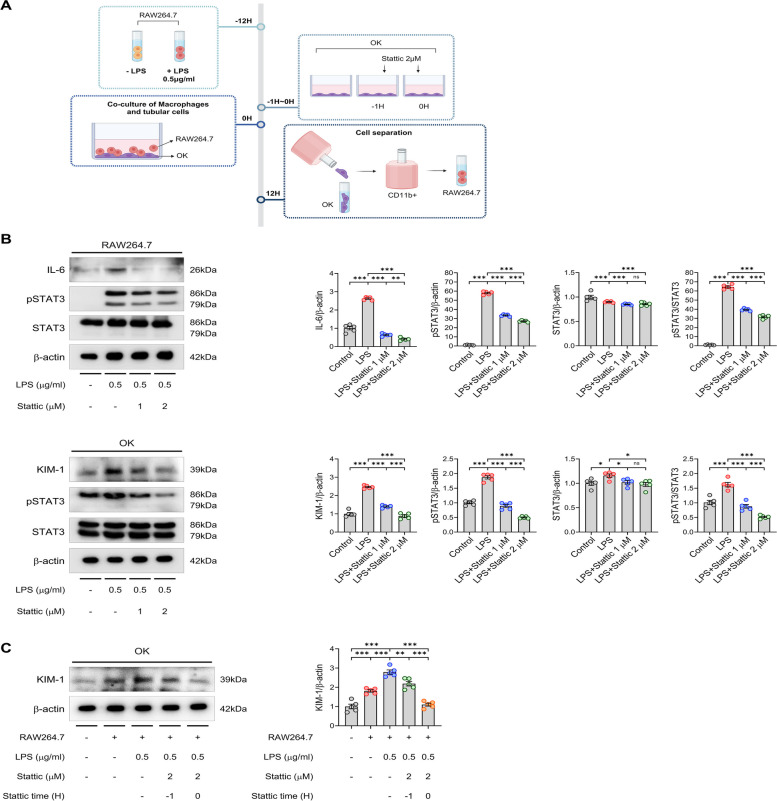
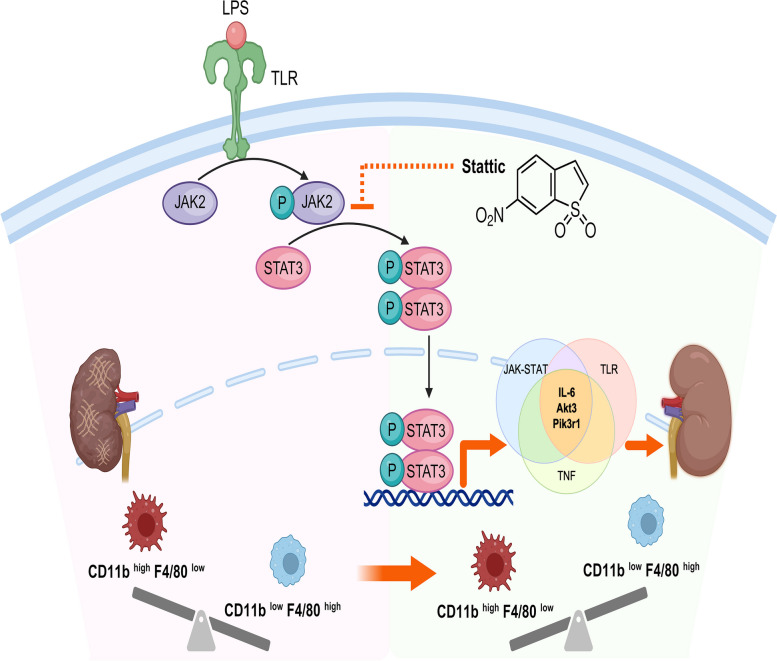
Results: In the L-AKI model, sequential increases in BUN and blood creatinine levels were time-dependent, with a marked elevation of 0-6 h after LPS injection. Notably, two newly identified macrophage subpopulations (CD11bhighF4/80low and CD11blowF4/80high), exhibited population changes, with an increase in the CD11bhighF4/80low population and a decrease in the CD11blowF4/80high macrophages. Corresponding to the FACS results, the tubular injury score, NGAL, F4/80, and p-STAT3 expression in the tubular regions were elevated. STAT3 inhibitor injection in L-AKI and L-CKD mice reduced renal injury and fibrosis. M2-type subpopulation with CD206 in CD11blowF4/80high population increased in the Stattic-treated group compared with that in the LPS-alone group in the L-AKI model. Additionally, STAT3 inhibitor reduced inflammation driven by LPS-stimulated macrophages and epithelial cells injury in the co-culture system. Transcriptomic profiling identified 3 common genes in the JAK-STAT, TLR, and TNF signaling pathways and 11 common genes in the LPS with macrophage response. The PI3K-AKT (IL-6, Akt3, and Pik3r1) and JAK-STAT pathways were determined as potential Stattic targets. Further confirmation through mRNA and protein expressions analyses showed that Stattic treatment reduced inflammation in the L-AKI and fibrosis in the L-CKD mice.

Conclusions: STAT3 blockade effectively mitigated inflammation by retrieving the CD11blowF4/80high population, further emphasizing the role of STAT3-associated macrophage-driven inflammation in kidney injury.

Keywords: AKI; Fibrosis; LPS; Macrophage-driven inflammation; STAT3.

Plain language summary

This study investigated the role of STAT3 in LPS-induced acute kidney injury (AKI) and its prolonged pathophysiological effect. In a mouse model, blocking STAT3 with Stattic reduced inflammation and fibrosis, decreased the levels of inflammatory and extracellular matrix (ECM) substances, reduced the number of certain immune cells (macrophages), and influenced specific genes related to inflammation. The findings suggest that targeting STAT3 is a promising approach to treat AKI and CKD by controlling the inflammation and the immune response as well as ECM accumulation. This study provides novel insights into AKI and CKD progression and will facilitate the development of new treatments for kidney injuries at various stages.


Conflict of interest statement

The authors declare no competing interests.

Figures

Fig. 1
Fig. 1
Time-dependent effect of LPS on macrophage subpopulations co-expressed with F4/80 and CD11b. A Schematic diagram of the progression of L-AKI. B Kidney functions were evaluated at various time points following LPS injection in mice: 0, 6, 12, and 24 h (n = 10 in each group). C Western blot analysis of the expression of pSTAT3, STAT3, and NGAL after LPS injection. D and E Flow cytometry results of immune cell types in the mouse L-AKI model, representing two populations (kidney macrophages, CD11bhighF4/80low and CD11blowF4/80high) (D); the frequency and ratio of individual populations were quantified using GraphPad Prism (n = 4 in each group) (E). F IHC representative images (left) and quantification (right) of NGAL (n = 5 in each group), F4/80 (n = 5 in each group), pSTAT3 (n = 5 in each group), and PAS from LPS-treated mice. Scale bars, 75 μm (200X), 100 μm (100X), and 50 μm (400X). All experiments were independently replicated at least three times, and the data are presented as mean ± SEM. *P < 0.05, **P < 0.01, ***P < 0.001
Fig. 2
Fig. 2
STAT3 inhibitor attenuates L-AKI and restores kidney function. A Schematic diagram of the animal model. B BUN and serum creatinine were measured to assess kidney function. Groups: Control, LPS, LPS + Stattic (5 mg/kg) and LPS + Stattic (10 mg/kg) (n = 6 in each group). C Flow cytometric comparison of pSTAT3 levels was conducted between two populations (kidney macrophages, CD11bhighF4/80low and CD11blowF4/80high) in LPS-induced kidneys. D Western blotting representative image (left) and quantification (right) of pSTAT3, STAT3 and ICAM-1. Each band shows a typical group, as indicated. E Changes in the proportion of two macrophage subpopulations between each group were observed with FACS analysis, and the frequency and ratio of individual populations were quantified using GraphPad Prism. F Upregulated expression of ICAM-1, NGAL, and pSTAT3 by LPS induction in IHC analysis (n = 6 in each group) decreased with Stattic treatment. Scale bars, 100 μm (100X) and 50 μm (400X). All experiments were independently replicated at least three times, and the data are presented as mean ± SEM. *P < 0.05, **P < 0.01, ***P < 0.001
Fig. 3
Fig. 3
Stattic alters immune-related gene expression in L-AKI mice. A Heatmap showing DEGs in the control, LPS, and LPS + Stattic-treated group (n = 4 in each group). B Volcano map showing DEGs involved in KEGG pathways and GO terms. Green and red dots represent downregulated and upregulated genes, respectively. C, D, E The dotted plot presents the KEGG and GO enrichment analyses of the 1,414 downregulated genes. F, G The intersection of genes identified by GO terms (F) and KEGG pathways (G) is shown. 11 genes were associated with the response to LPS (GO:0032496) and macrophage-related genes (GO:0010934, GO:0042116, GO:1905517), and 3 genes were common to the JAK-STAT (mmu04630), TLR (Toll-like receptor, mmu04620), and TNF (Tumor necrosis factor, mmu04668) signaling pathways. H Violin plots depicting the expression levels of the intersecting genes from (F, G), with mean ± SEM. *P < 0.05, **P < 0.01, ***P < 0.001. I The DEGs related to macrophage function were categorized using the following GO terms: macrophage cytokine production (GO:0010934), macrophage activation (GO:0042116), and macrophage migration (GO:1905517). J A representative heatmap of the JAK-STAT signaling pathway (mmu04630) showing downregulated genes is presented. K Network analysis of downregulated and upregulated genes in the JAK-STAT signaling pathway was constructed, visualizing their interconnections. L Network analysis of host immune responses following LPS induction was demonstrated. JAK-STAT, TLR and TNF signaling pathways. The results are presented as mean ± SEM, and statistical analysis was conducted using an unpaired two-tailed Student’s t-test. *P < 0.05, **P < 0.01, ***P < 0.001
Fig. 3
Fig. 3
Stattic alters immune-related gene expression in L-AKI mice. A Heatmap showing DEGs in the control, LPS, and LPS + Stattic-treated group (n = 4 in each group). B Volcano map showing DEGs involved in KEGG pathways and GO terms. Green and red dots represent downregulated and upregulated genes, respectively. C, D, E The dotted plot presents the KEGG and GO enrichment analyses of the 1,414 downregulated genes. F, G The intersection of genes identified by GO terms (F) and KEGG pathways (G) is shown. 11 genes were associated with the response to LPS (GO:0032496) and macrophage-related genes (GO:0010934, GO:0042116, GO:1905517), and 3 genes were common to the JAK-STAT (mmu04630), TLR (Toll-like receptor, mmu04620), and TNF (Tumor necrosis factor, mmu04668) signaling pathways. H Violin plots depicting the expression levels of the intersecting genes from (F, G), with mean ± SEM. *P < 0.05, **P < 0.01, ***P < 0.001. I The DEGs related to macrophage function were categorized using the following GO terms: macrophage cytokine production (GO:0010934), macrophage activation (GO:0042116), and macrophage migration (GO:1905517). J A representative heatmap of the JAK-STAT signaling pathway (mmu04630) showing downregulated genes is presented. K Network analysis of downregulated and upregulated genes in the JAK-STAT signaling pathway was constructed, visualizing their interconnections. L Network analysis of host immune responses following LPS induction was demonstrated. JAK-STAT, TLR and TNF signaling pathways. The results are presented as mean ± SEM, and statistical analysis was conducted using an unpaired two-tailed Student’s t-test. *P < 0.05, **P < 0.01, ***P < 0.001
Fig. 4
Fig. 4
Kidney mRNA expression analysis of L-AKI mice by real-time qPCR. A, B The mRNA expression profile in the kidneys of L-AKI mice was investigated through real-time qPCR analysis (n = 8 in each group). Genes related to (A) kidney injury and proinflammation as well as (B) macrophages and the STAT3 pathway were analyzed 6 h after LPS injection with Stattic treatment. C The percentage of CD206-positive cells within the CD11blowF4/80high population was compared between the LPS and LPS + Stattic groups with FACS analysis. D The mRNA levels of two genes commonly associated with the JAK-STAT, TLR, and TNF pathways were analyzed using real-time qPCR (n = 8 in each group). The results are presented as mean ± SEM, and statistical analysis was conducted using an unpaired two-tailed Student’s t-test. *P < 0.05, **P < 0.01, ***P < 0.001
Fig. 5
Fig. 5
The inflammatory response induced by LPS stimulation in RAW264.7 cells. A Histogram and quantification graph of iNOS-positive cells using FACS analysis after time-dependent, dose-dependent LPS treatment, and Stattic treatment with LPS stimulation in RAW264.7 cells. B Histogram and quantification graph of pSTAT3+iNOS+ cells using FACS analysis after time-dependent, dose-dependent LPS treatment, and Stattic treatment with LPS stimulation in RAW264.7 cells. The results are presented as mean ± SEM, and statistical analysis was conducted using an unpaired two-tailed Student’s t-test. *P < 0.05, **P < 0.01, ***P < 0.001
Fig. 6
Fig. 6
Inhibition of STAT3 attenuates tubular epithelial cell injury in a co-culture system with macrophages. A A schematic illustration of co-culture system with macrophages and tubular epithelial cells. B Western blot results of IL-6, KIM-1, pSTAT3, and STAT3 expression in RAW264.7 and OK cells are shown. C Upregulated expression of KIM-1 in OK cells co-cultured with LPS-stimulated RAW264.7 cells significantly decreased upon pre- and concomitant-treatment of 2 μM Stattic. All experiments were independently replicated at least three times, and the data are presented as mean ± SEM. *P < 0.05, **P < 0.01, ***P < 0.001
Fig. 7
Fig. 7
STAT3 inhibitor exhibits anti-fibrotic effects in L-CKD. A Schematic diagram of LPS and Stattic administration in L-CKD. B The gross morphology of kidney and spleen was compared between the LPS and LPS + Stattic group. C Sirius red staining, IHC representative images of F4/80 and NGAL (left), and quantification (right) of stained area (n = 6 in each group). Scale bars, 100 µm (100X). D Western blotting representative image (left) and quantification (right) of pSTAT3, STAT3, fibronectin, and NGAL. E The relative mRNA expression of fibrosis, immune responses, and STAT3-related genes. All experiments were independently replicated at least three times, and the data are presented as mean ± SEM. *P < 0.05, **P < 0.01, ***P < 0.001
Fig. 8
Fig. 8
A schematic illustration demonstrating the therapeutic effect of Stattic on LPS-induced kidney injury. Stattic mitigates LPS-induced kidney injury by altering the macrophage subpopulation and downregulating the expression of IL-6, Akt3, and Pik3r1

References

    1. Chakraborty D, Šumová B, Mallano T, Chen C-W, Distler A, Bergmann C, et al. Activation of STAT3 integrates common profibrotic pathways to promote fibroblast activation and tissue fibrosis. Nat Commun. 2017;8(1):1130. 10.1038/s41467-017-01236-6. - PMC - PubMed
    1. Hu X, Li J, Fu M, Zhao X, Wang W. The JAK/STAT signaling pathway: from bench to clinic. Signal Transduct Target Ther. 2021;6(1):402. 10.1038/s41392-021-00791-1. - PMC - PubMed
    1. Owen KL, Brockwell NK, Parker BS. JAK-STAT signaling: a double-edged sword of immune regulation and cancer progression. Cancers. 2019;11(12): 2002. 10.3390/cancers11122002. - PMC - PubMed
    1. Hu Y, Dong Z, Liu K. Unraveling the complexity of STAT3 in cancer: molecular understanding and drug discovery. J Exp Clin Cancer Res. 2024;43(1):23. 10.1186/s13046-024-02949-5. - PMC - PubMed
    1. Zheng C, Huang L, Luo W, Yu W, Hu X, Guan X, et al. Inhibition of STAT3 in tubular epithelial cells prevents kidney fibrosis and nephropathy in STZ-induced diabetic mice. Cell Death Dis. 2019;10(11):848. 10.1038/s41419-019-2085-0. - PMC - PubMed

LinkOut - more resources