. 2024 Oct;14(10):e1816.
doi: 10.1002/ctm2.1816.

Discovery of a selective cytochrome P450 4A inhibitor for the treatment of metabolic dysfunction-associated fatty liver disease

Affiliations

Discovery of a selective cytochrome P450 4A inhibitor for the treatment of metabolic dysfunction-associated fatty liver disease

Minji Lee et al. Clin Transl Med. 2024 Oct.
No abstract available


Conflict of interest statement

The authors declare no conflict of interest.

Figures
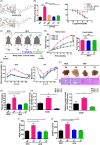
FIGURE 1
FIGURE 1
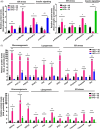
Characterization of the novel potent C418 derivatives (C4181 and C4182). (A) Homology model structure of cytochrome P450 4A (CYP4A) with C4181(C1) or C4182 (C2) using glide‐based docking strategy. (B) Normalized CYP4A enzyme activity in the presence of vehicle (VE), HET0016 (HET), or CYP4A inhibitors (C1 or C2) and Mean IC50 values. (C–L) C57BL/6N mice were fed a normal chow diet (NCD) or high‐fat diet (HFD) and administered with either vehicle (VE) or CYP4A inhibitors (C1 or C2, 5 mg/kg/day) intraperitoneally for 12 weeks. (C) Scheme of the C1 or C2 administration to HFD‐induced diabetic mice. (D) Body masses and food intake of each mice group. (E) Glucose tolerance testing (GTT) and insulin tolerance testing (ITT) data. (F) Isolated liver tissues (scale bar = 10 mm) and representative H&E‐stained liver sections (scale bar = 100 µm). (G) Hepatic triglyceride (TG) concentration. (H) Quantification of CD36 (Fatty acid translocase) protein levels normalized to β‐actin. (I) Lipid peroxidation, assessed by the measurement of malondialdehyde (MDA) concentration. (J) Hepatic 20‐HETE concentration. (K, L) Quantification of western blot. Relative protein levels normalized to β‐actin and phosphorylated protein levels normalized to total protein Western blots of C1 and C2 on the gluconeogenesis, lipogenesis, ER stress, insulin resistance, and apoptosis of HFD‐fed mice. All experiments were performed as multiple independent samples, and the values are shown as mean ± SEM, analyzed by the Student's t‐test or two‐way ANOVA. = 3‐5; *p < .05, **p < .01, *** < .001 for NCD + VE versus HFD + VE versus HFD + C1 or C2. ns, not significant.
FIGURE 1
FIGURE 1
Characterization of the novel potent C418 derivatives (C4181 and C4182). (A) Homology model structure of cytochrome P450 4A (CYP4A) with C4181(C1) or C4182 (C2) using glide‐based docking strategy. (B) Normalized CYP4A enzyme activity in the presence of vehicle (VE), HET0016 (HET), or CYP4A inhibitors (C1 or C2) and Mean IC50 values. (C–L) C57BL/6N mice were fed a normal chow diet (NCD) or high‐fat diet (HFD) and administered with either vehicle (VE) or CYP4A inhibitors (C1 or C2, 5 mg/kg/day) intraperitoneally for 12 weeks. (C) Scheme of the C1 or C2 administration to HFD‐induced diabetic mice. (D) Body masses and food intake of each mice group. (E) Glucose tolerance testing (GTT) and insulin tolerance testing (ITT) data. (F) Isolated liver tissues (scale bar = 10 mm) and representative H&E‐stained liver sections (scale bar = 100 µm). (G) Hepatic triglyceride (TG) concentration. (H) Quantification of CD36 (Fatty acid translocase) protein levels normalized to β‐actin. (I) Lipid peroxidation, assessed by the measurement of malondialdehyde (MDA) concentration. (J) Hepatic 20‐HETE concentration. (K, L) Quantification of western blot. Relative protein levels normalized to β‐actin and phosphorylated protein levels normalized to total protein Western blots of C1 and C2 on the gluconeogenesis, lipogenesis, ER stress, insulin resistance, and apoptosis of HFD‐fed mice. All experiments were performed as multiple independent samples, and the values are shown as mean ± SEM, analyzed by the Student's t‐test or two‐way ANOVA. = 3‐5; *p < .05, **p < .01, *** < .001 for NCD + VE versus HFD + VE versus HFD + C1 or C2. ns, not significant.
FIGURE 2
FIGURE 2
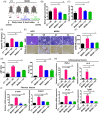
Effects of C1 and C2 in metabolic dysfunction‐associated steatohepatitis (MASH) model. C57BL/6N and MASH model, respectively, and administered either vehicle (VE) or one of the candidate drugs (C1 or C2, 5 mg/kg/day) intraperitoneally for 4 weeks. (A) Scheme for the experiment. (B) Serum glucose concentration. (C) Serum triglyceride (TG) concentration. (D) Hepatic triglyceride concentration. (E) Representative liver sections stained with H&E (intracytoplasmic lipid accumulation, top) or Sirius red (collagen deposition, bottom) (scale bar = 100 µm). (F) Hepatic 20‐HETE concentration. (G) Serum AST and ALT activities. (H, I) mRNA expression of genes mediating inflammation and fibrosis. All experiments were performed as multiple independent samples, and the values are shown as mean ± SEM, analyzed by the two‐way ANOVA. = 3; *p < .05, **p < .01 and ***p < .001 for CT (CT; control mice) + VE versus MASH + VE versus MASH + C1 or C2.
FIGURE 3
FIGURE 3
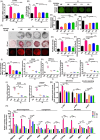
Effects of C1 and C2 in a 3D organoid‐based model of liver steatosis. (A) Normalized mRNA expression of cytochrome P450 4A (CYP4A) after treatment with vehicle (VE), HET0016 (HET) or CYP4A inhibitors (C1 or C2) for 3 days in an organoid model of 0.5 mM oleate and 0.25 mM palmitate‐induced liver steatosis (Fatty Induction, FI). (B) CYP4A activity under each condition. (C) Glucose uptake over 4 h, was assessed using a fluorescent glucose analogue (scale bar = 50 µm). (D) Normalized glucose uptake. (E) Normalized glucose consumption over 48 hours. (F) Representative cell morphology (upper) and fluorescence images of organoids stained with Oil red O (middle) and Nile Red (lower) (scale bar = 50 µm). (G) Normalized intensity of Nile Red staining. (H) Normalized intensity of Oil red O staining. (I) Organoid triglyceride (TG) concentration. (J) mRNA expression of CD36. (K) mRNA expression of genes involved in gluconeogenesis. (L) mRNA expression of genes involved in lipogenesis. (M, N) Quantification of western blot. (M) Relative protein levels normalized to β‐actin. (N) Phosphorylated protein Levels normalized to total protein. Western blots for expression markers involved in gluconeogenesis, lipogenesis, ER stress, and insulin signalling. All experiments were performed as multiple independent samples, and the values are shown as mean ± SEM, analyzed by the Student's t‐test. = 3; **p < .01 and ***p < .001 for VE versus FI + VE and FI + VE versus FI + HET or C1 or C2.
FIGURE 4
FIGURE 4
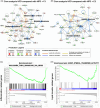
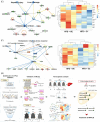
Comparison of transcriptomic profiles of high‐fat diet (HFD)‐fed mice and HFD‐fed mice treated with C1 or C2. (A–D) Core analysis using Ingenuity Pathway Analysis (IPA) and Gene Set Enrichment Analysis (GSEA) in HFD compared with HFD + C1 or HFD compared with HFD + C2 were carried out. The molecular network and pathway analysis showed that C1 and C2 considerably reduced the expression of genes related to hepatic steatosis, inflammation, type II diabetes mellitus (T2DM) and metabolic dysfunction‐associated fatty liver disease (MAFLD). (A) Core analysis of HFD compared with HFD treated with C1. (B) Core analysis of HFD compared with HFD treated with C2. (C) Gene Set Enrichment Analysis of C1. (D) Gene Set Enrichment Analysis of C2. (E, F) Functional enrichment analysis was performed using comparison analysis of IPA. (E) Key regulatory networks of C1 related to inflammation of the liver, liver damage and hepatic injury. (F) Key regulatory networks of C2 related to hepatic lipid metabolism and ER stress. Red indicates upregulated genes, and green indicates downregulated genes. Orange represents the predicted activation of nodes, and blue represents the predicted inactivation of nodes. (G) Schematic illustrating the effects of cytochrome P450 4A (CYP4A) inhibitors in the livers of individuals with MAFLD through three different mechanisms; ER stress/oxidative stress, Fatty acid translocase (FAT/CD36)/Lipotoxicity, and inflammation/fibrosis.
FIGURE 4
FIGURE 4
Comparison of transcriptomic profiles of high‐fat diet (HFD)‐fed mice and HFD‐fed mice treated with C1 or C2. (A–D) Core analysis using Ingenuity Pathway Analysis (IPA) and Gene Set Enrichment Analysis (GSEA) in HFD compared with HFD + C1 or HFD compared with HFD + C2 were carried out. The molecular network and pathway analysis showed that C1 and C2 considerably reduced the expression of genes related to hepatic steatosis, inflammation, type II diabetes mellitus (T2DM) and metabolic dysfunction‐associated fatty liver disease (MAFLD). (A) Core analysis of HFD compared with HFD treated with C1. (B) Core analysis of HFD compared with HFD treated with C2. (C) Gene Set Enrichment Analysis of C1. (D) Gene Set Enrichment Analysis of C2. (E, F) Functional enrichment analysis was performed using comparison analysis of IPA. (E) Key regulatory networks of C1 related to inflammation of the liver, liver damage and hepatic injury. (F) Key regulatory networks of C2 related to hepatic lipid metabolism and ER stress. Red indicates upregulated genes, and green indicates downregulated genes. Orange represents the predicted activation of nodes, and blue represents the predicted inactivation of nodes. (G) Schematic illustrating the effects of cytochrome P450 4A (CYP4A) inhibitors in the livers of individuals with MAFLD through three different mechanisms; ER stress/oxidative stress, Fatty acid translocase (FAT/CD36)/Lipotoxicity, and inflammation/fibrosis.

References

    1. Eslam M, Newsome PN, Sarin SK, et al. A new definition for metabolic dysfunction‐associated fatty liver disease: an international expert consensus statement. Journal of Hepatology. 2020;73(1):202‐209. - PubMed
    1. Eslam M, Sanyal AJ, George J, et al. MAFLD: a consensus‐driven proposed nomenclature for metabolic associated fatty liver disease. Gastroenterology. 2020;158(7):1999‐2014. e1. - PubMed
    1. Park EC, Kim SI, Hong Y, et al. Inhibition of CYP4A reduces hepatic endoplasmic reticulum stress and features of diabetes in mice. Gastroenterology. 2014;147(4):860‐869. doi:10.1053/j.gastro.2014.06.039 - DOI - PubMed
    1. Lin JH, Li H, Yasumura D, et al. IRE1 signaling affects cell fate during the unfolded protein response. Science. 2007;318(5852):944‐949. - PMC - PubMed
    1. Zhang X, Li S, Zhou Y, et al. Ablation of cytochrome P450 omega‐hydroxylase 4A14 gene attenuates hepatic steatosis and fibrosis. Proc Natl Acad Sci U S A. 2017;114(12):3181‐3185. doi:10.1073/pnas.1700172114 - DOI - PMC - PubMed

MeSH terms

Substances