. 2024 Dec;65(12):3631-3643.
doi: 10.1111/epi.18136. Epub 2024 Oct 5.

Matrix-assisted laser desorption/ionization mass spectrometry imaging as a new tool for molecular histopathology in epilepsy surgery

Affiliations

Matrix-assisted laser desorption/ionization mass spectrometry imaging as a new tool for molecular histopathology in epilepsy surgery

Cinzia Cagnoli et al. Epilepsia. 2024 Dec.

Abstract

Objective: Epilepsy surgery is a treatment option for patients with seizures that do not respond to pharmacotherapy. The histopathological characterization of the resected tissue has an important prognostic value to define postoperative seizure outcome in these patients. However, the diagnostic classification process based on microscopic assessment remains challenging, particularly in the case of focal cortical dysplasia (FCD). Imaging mass spectrometry is a spatial omics technique that could improve tissue phenotyping and patient stratification by investigating hundreds of biomolecules within a single tissue sample, without the need for target-specific reagents.

Methods: An in situ proteomic technique called matrix-assisted laser desorption/ionization mass spectrometry imaging (MALDI-MSI) is here investigated as a potential new tool to expand conventional diagnosis on standard paraffin brain tissue sections. Unsupervised and region of interest-based MALDI-MSI analyses of sections from 10 FCD type IIb (FCDIIb) cases were performed, and the results were validated by immunohistochemistry.

Results: MALDI-MSI identified distinct histopathological features and the boundaries of the dysplastic lesion. The capability to visualize the spatial distribution of well-known diagnostic markers enabling multiplex measurements on single tissue sections was demonstrated. Finally, a fingerprint list of potential discriminant peptides that distinguish FCD core from peri-FCD tissue was generated.

Significance: This is the first study that explores the potential application of MALDI-MSI in epilepsy postsurgery fixed tissue, by utilizing the well-characterized FCDIIb features as a model. Extending these preliminary analyses to a larger cohort of patients will generate spectral libraries of molecular signatures that discriminate tissue features and will contribute to patient phenotyping.

Keywords: FFPE; epilepsy surgery; focal cortical dysplasia; human tissues; mass spectrometry imaging; peptides.


Conflict of interest statement

The authors declare no conflict of interest. We confirm that we have read the Journal's position on issues involved in ethical publication and affirm that this report is consistent with those guidelines.

Figures
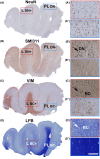
FIGURE 1
FIGURE 1
Histopathological findings in type IIb focal cortical dysplasia (FCD) and region of interest (ROI) definition. (A–D) Example of a postsurgical sample of type IIb FCD (Patient 6) that includes the lesional core (L) and the control perilesional (PL) region within the same tissue section. Enlargements of the regions outlined by the rectangles in (A–D) are illustrated on the right (A'–D', A“–D”). In the core L, typical microscopic hallmarks are observed: severe cortical dyslamination and reduced neuronal density (NeuN immunoreacted section in A, A'), the presence of enlarged dysmorphic neurons (DNs) with cytoplasmic accumulation of neurofilaments in gray matter and at gray/white matter boundary (B, B′: SMI311 immunohistochemistry), balloon cells (BCs) accumulating intermediate vimentin (VIM) filaments frequently concentrated in white matter (C, C′: VIM immunostaining), and in the underlying white matter, a reduction of myelin staining (D, D′: Luxol fast blue [LFB] staining). Adjacent PL cortex shows a regular architecture with a normal density of pyramidal neurons (A“), absence of DNs (B”) and BCs (C“), and normal myelin distribution (D”). Based on these histopathological characteristics, the following ROIs were defined for further analysis: L DN+, L BC+, PL DN, and PL BC. Scale bar = 3.3 mm (A–D), 200 μm (A'–D'; A“–D”).
FIGURE 2
FIGURE 2
Schematic workflow for matrix‐assisted laser desorption/ionization (MALDI)–mass spectrometry imaging (MSI) experiment. Starting from formalin‐fixed paraffin‐embedded (FFPE) tissue block, sample pretreatment for MALDI‐MSI analysis (left part of the figure) includes cutting, mounting on conductive glasses, paraffin removal, antigen retrieval, trypsin enzymatic digestion, and matrix deposition. The size of our samples was approximately between 150 and 450 mm2; the MALDI‐MSI acquisition time required a range of 8–18 h per each sample. After acquisition of the spectra, data were analyzed with several statistical approaches; an example of automatic spatial segmentation is illustrated (Patient 6). The same tissue section, after MALDI experiment, is stained and converted to digital format for MALDI‐MSI data spatial interpretation (cresyl violet staining is shown). Adjacent FFPE sections are processed for immunohistochemistry to further validate MALDI‐MSI data (right arm of the figure, created with BioRender).
FIGURE 3
FIGURE 3
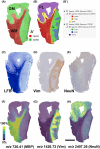
Spatial segmentation and molecular images of matrix‐assisted laser desorption/ionization (MALDI)–mass spectrometry imaging (MSI) data on a single focal cortical dysplasia tissue section. (A, B) Examples of automatic spatial segmentation from Patient 7. By bisecting K‐mean method, similar spectra are grouped into clusters to produce a dendrogram. Two different levels of the dendrogram are shown in A' and B', and the number of spectra composing each cluster is indicated. Each branch of the dendrogram is color‐coded and visualized on the tissue section as a segmentation map (A, B). Note how the spatial segmentation shows gray matter (GM)/white matter (WM) differentiation at the first level (A) and lesional (L)/perilesional (PL) differentiation at the subsequent level (B). Dotted lines indicate the GM/WM boundary identified on adjacent immunostained sections; the narrow strip of the deep cortical layer is frequently segmented as WM at first branch and as a transition zone at subsequent dendrogram levels. (C–E) Tissue sections adjacent to that utilized for MALDI‐MSI experimentation (A, B) processed for histochemical staining/immunohistochemistry to validate the segmentation maps. (C) Luxol fast blue (LFB) myelin staining for GM/WM differentiation. (D) Vimentin (Vim) immunostaining showing balloon cell‐positive L area. (E) NeuN immunohistochemistry shows reduced neuronal density in L compared to PL area. (F–H) Ion tissue distribution of selected m/z species related to myelin basic protein (MBP; F), Vim (G), and NeuN (H) visualized as color‐coded ion intensity maps. Note the very close correspondence between the ion maps (F–H) and related immunohistochemistry of these typical markers (C–E). m/z are reported as experimental values ±150 ppm. Scale bar = 5.4 mm (A–H).
FIGURE 4
FIGURE 4
Principal component analysis (PCA) in two representative cases. Examples of PCA of Patient 7 (A–D) and 5 (E, F). Score maps (A, E) of the most informative principal components (PC1, 2 and 4 for Patient 7; PC1, PC3, and PC5 for Patient 5) provide a summarized view of the major underlying spatial and spectral patterns present in the data, showing gray matter (GM)/white matter (WM) and lesional (L)/perilesional (PL) differentiation. (B) PCA score plot of Patient 7 allows a graphical representation of the dataset along the PC1, PC2, and PC4 axes, where each point represents a spectrum of the dataset. When spectra acquired from specific regions were color‐coded, according to the previously known histological regions as shown in C, they are segregated into distinct clusters (D). (E, F) Similar results are shown for Patient 5. Scale bar = 5.4 mm (A, C, E). BC, balloon cell; DN, dysmorphic neuron.
FIGURE 5
FIGURE 5
Heat map of discriminant peptides. (A) Hierarchical cluster analysis summarizing the signal intensity of 13 discriminant peptides (in rows) in four annotated regions of interest (ROI; lesional [L] dysmorphic neuron [DN]+, L balloon cell [BC]+, perilesional [PL] DN, PL BC; in columns) in eight different focal cortical dysplasia samples (Patients 3–10, Table 1). Regions of interest (ROIs) are color‐coded as shown in A'. Discriminant peptides were obtained by receiver operating characteristic analysis between ROIs with an area under the curve of ≥.80 and p ≤ .05 being required for a peak to be considered statistically significant. Note enrichment in specific m/z species especially in L BC+ (top left corner) and PL BC (bottom right corner). Putative identification of some of them, based on in silico values and related immunohistochemistry, confirmed vimentin (Vim; m/z 1428.72) and myelin basic protein (m/z 726.41) as markers for L BC+ and PL BC, respectively. Of note, several other unidentified markers are found enriched. Comparison between L DN+ and PL DN (central part of the map) showed an enrichment in several unknown m/z species in PL compared to L area. m/z are reported as experimental values ±150 ppm. (B) Example of ROI annotation (Patient 3). Scale bar = 6.3 mm (B).

Similar articles

Cited by

References

    1. Olivier M, Asmis R, Hawkins GA, Howard TD, Cox LA. The need for multi‐omics biomarker signatures in precision medicine. IJMS. 2019;20(19):4781. 10.3390/ijms20194781 - DOI - PMC - PubMed
    1. Engel J. The current place of epilepsy surgery. Curr Opin Neurol. 2019;31(2):192–197. 10.1097/wco.0000000000000528 - DOI - PMC - PubMed
    1. Blumcke I, Spreafico R, Haaker G, Coras R, Kobow K, Bien CG, et al. Histopathological findings in brain tissue obtained during epilepsy surgery. N Engl J Med. 2017;377(17):1648–1656. 10.1056/nejmoa1703784 - DOI - PubMed
    1. Lamberink HJ, Otte WM, Blümcke I, Braun KPJ. Seizure outcome and use of antiepileptic drugs after epilepsy surgery according to histopathological diagnosis: a retrospective multicentre cohort study. Lancet Neurol. 2020;19(9):748–757. 10.1016/S1474-4422(20)30220-9 - DOI - PubMed
    1. Najm IM, Sarnat HB, Blümcke I. Review: the international consensus classification of focal cortical dysplasia—a critical update 2018. Neuropathol Appl Neurobio. 2018;44(1):18–31. 10.1111/nan.12462 - DOI - PubMed

Grants and funding