. 2024 Oct 5;81(1):416.
doi: 10.1007/s00018-024-05441-7.

Apache is a neuronal player in autophagy required for retrograde axonal transport of autophagosomes

Affiliations

Apache is a neuronal player in autophagy required for retrograde axonal transport of autophagosomes

Barbara Parisi et al. Cell Mol Life Sci. .

Erratum in

Abstract

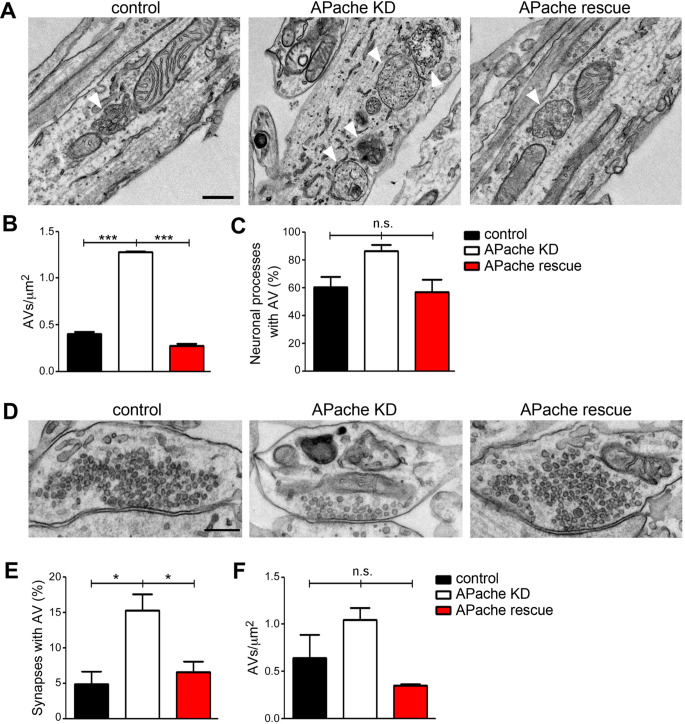
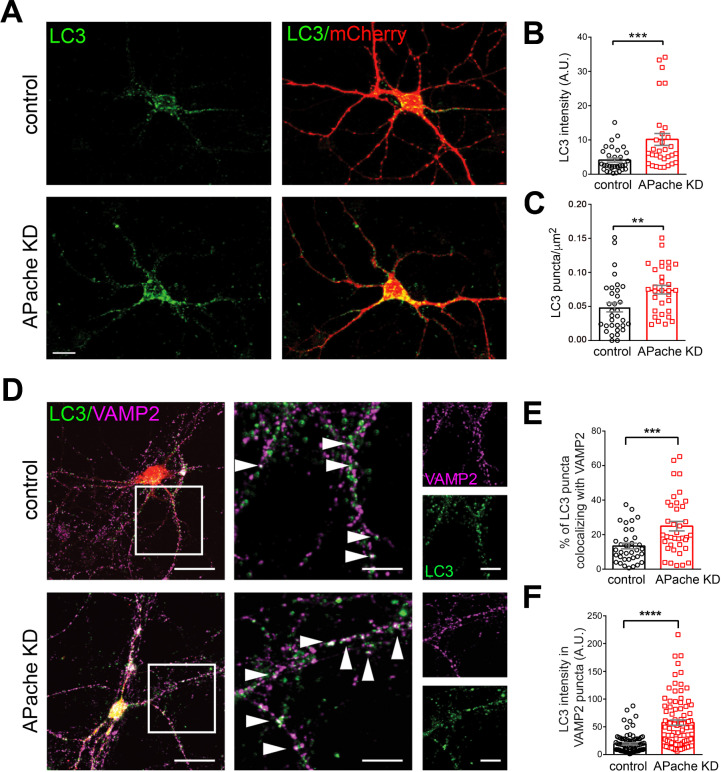
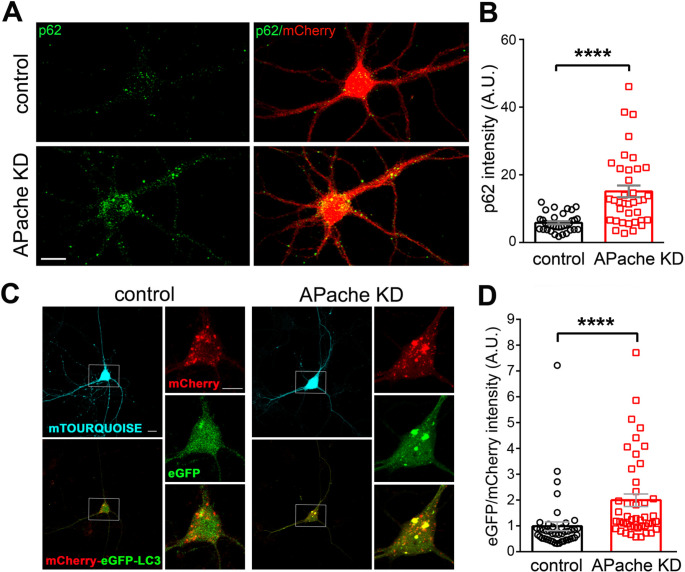
Neurons are dependent on efficient quality control mechanisms to maintain cellular homeostasis and function due to their polarization and long-life span. Autophagy is a lysosomal degradative pathway that provides nutrients during starvation and recycles damaged and/or aged proteins and organelles. In neurons, autophagosomes constitutively form in distal axons and at synapses and are trafficked retrogradely to the cell soma to fuse with lysosomes for cargo degradation. How the neuronal autophagy pathway is organized and controlled remains poorly understood. Several presynaptic endocytic proteins have been shown to regulate both synaptic vesicle recycling and autophagy. Here, by combining electron, fluorescence, and live imaging microscopy with biochemical analysis, we show that the neuron-specific protein APache, a presynaptic AP-2 interactor, functions in neurons as an important player in the autophagy process, regulating the retrograde transport of autophagosomes. We found that APache colocalizes and co-traffics with autophagosomes in primary cortical neurons and that induction of autophagy by mTOR inhibition increases LC3 and APache protein levels at synaptic boutons. APache silencing causes a blockade of autophagic flux preventing the clearance of p62/SQSTM1, leading to a severe accumulation of autophagosomes and amphisomes at synaptic terminals and along neurites due to defective retrograde transport of TrkB-containing signaling amphisomes along the axons. Together, our data identify APache as a regulator of the autophagic cycle, potentially in cooperation with AP-2, and hypothesize that its dysfunctions contribute to the early synaptic impairments in neurodegenerative conditions associated with impaired autophagy.

Keywords: AP-2; Amphisome; LC3; Retrograde trafficking; Synapse; Torin1; TrkB; mTOR.


Conflict of interest statement

The authors have no relevant financial or non-financial interests to disclose.

Figures

Fig. 1
Fig. 1
Increased APache protein levels colocalize with LC3 after autophagy induction by mTOR inhibition. (A) Representative confocal images of cortical neurons treated with either DMSO (vehicle) or the mTOR inhibitor Torin1 (250 nM, 4 h) at 17 DIV and stained for LC3 (red) and APache (green). White boxes indicate panels magnified to the right. Arrowheads in the magnified inserts denote points of co-localization between LC3-positive structures and APache. Scale bars: 20 μm, 5 μm (inserts). (B-D) Quantification of fluorescence intensity values of LC3 (B, vehicle: 19.68 ± 1.60; Torin1: 52.13 ± 3.15), APache (C, vehicle: 31.96 ± 3.40; Torin1: 78.31 ± 5.53) and of the percent of APache/LC3 co-localization based on Manders’ coefficient (D, vehicle: 17.10 ± 2.13%; Torin1: 29.85 ± 2.50%, n = 22–44 neurons, from 3 independent preparations) in vehicle- and Torin1-treated neurons. (E, F) Representative confocal images of cortical neurons treated with either vehicle or Torin1 and triple stained for VAMP2 to identify synaptic boutons (red), SMI312 to label axons (magenta) and either LC3 (green, E) or APache (green, F) at 17 DIV. Arrowheads in the merge panels indicate synaptic boutons positive for LC3 or APache. Scale bar, 5 μm. (G, H) Quantification of LC3 (G) or APache (H) fluorescence intensity values at VAMP2-positive puncta in vehicle- and Torin1-treated synapses (G, LC3 vehicle: 19.50 ± 1.95; LC3 Torin1: 65.78 ± 4.99; H, APache vehicle: 18.99 ± 1.81; APache Torin1: 69.56 ± 5.94, n = 82–89 synapses, from 3 independent preparations). A.U. = arbitrary units of fluorescence intensity. (I, J) Representative blots (I) and quantitative analysis (J) of lysates of cortical neurons treated at 17 DIV with either DMSO (vehicle) or Torin1 (250 nM, 4 h). Treated neurons show increased expression levels of the active autophagic marker LC3II, APache and AP-2α. Actin was used as loading control. Protein levels in treated neurons are expressed in percent of control neurons. (APache Torin1: 160 ± 12.3%; AP-2α Torin1: 139.6 ± 7.58%; LC3II Torin1: 138.9 ± 10.09%, from n = 6 independent preparations). (K, L) Representative blots (K) and quantitative analysis (L) of the expression level of APache in lysates from cultured cortical neurons treated at 17 DIV with either DMSO/water (vehicle), Torin1 (250 nM, 4 h) and/or cycloheximide (CHX, 5 µg/ml, 4 h). Actin was used as loading control. APache protein levels are expressed in percent of control neurons (Torin1: 162.4 ± 33.27%; CHX: 91.91 ± 15.4%; Torin1/CHX: 92.01 ± 16.12%, from n = 6 independent preparations). All graphs show means ± SEM. *p < 0.05; **p < 0.01; ***p < 0.001; ****p < 0.0001, unpaired Student’s t-test with Welch’s correction (B, DJ), Mann Whitney’s U-test (C, GH); **p < 0.01, one-way ANOVA/Bonferroni’s tests (L). See also Figure S1
Fig. 2
Fig. 2
APache forms a complex with AP-2 and dynactin and co-traffics with LC3 in cultured cortical neurons. (A) Representative blots of total lysates and plasma membrane/organelle-enriched and cytosolic fractions obtained with 0.02% digitonin treatment of cultured cortical neurons at 17 DIV, run in duplicate. Autophagic LC3II and late endosomal/lysosomal LAMP1 proteins were used to confirm the enrichment in AVs (autophagosomes/amphisomes/autolysosomes) in the organelle-enriched fraction. Cytoplasmic vinculin was adopted to evaluate potential cytosolic contaminations in the organellar fraction and for cytosolic loading control, Na+/K+ ATPase α-3 (NaK3) was used for membrane loading control, and actin for total loading control. Each lane contains equal protein loading. (B) Quantitative analysis of APache shows an increased protein level in the vacuolar-enriched fraction. Protein levels are expressed in percent of total lysates (membrane/organelle-enriched: 251.5 ± 25.85%; cytosol: 12.78 ± 3.73%, from n = 6 independent preparations). (C) Mouse brain extracts were subjected to immunoprecipitation (IP) assays with anti-APache polyclonal antibodies or control IgGs. Equal aliquots (2% of total) of the starting material (INPUT) together with the IP samples (20% of total for APache and IgG and 80% of total for AP-2α and dynactin) were subjected to immunoblotting with the indicated antibodies. APache co-immunoprecipitated dynactin and AP-2. The IPs were performed twice with similar results. (D, E) Mouse cortical neurons were co-transfected at 11 DIV with EGFP-APache and RFP-LC3 and analyzed at 14 DIV. Representative epifluorescence images and corresponding kymographs showing the colocalization (D) and co-transport (E) of EGFP-APache with RFP-LC3-labelled autophagosomes (arrowheads). Scale bar, 5 μm. (F) Relative axonal mobility of LC3/APache co-trajectories expressed in percent of the total number of co-trajectories (static: 65.23 ± 4.48%; retrograde: 26.62 ± 3.22%; anterograde: 8.15 ± 1.95%, n = 226 co-trajectories from n = 20 neurons, from n = 3 independent preparations). All graphs show means ± SEM. *p < 0.005; ***p < 0.001, Kruskal-Wallis’s ANOVA/Dunn’s tests (B); ***p < 0.001; ****p < 0.0001, one-way ANOVA (F)
Fig. 3
Fig. 3
APache silencing results in an aberrant accumulation of autophagic vacuoles in cortical neurons. (A) Representative electron micrographs of neurites from cultured cortical neurons transduced at 12 DIV with lentiviral vectors coding for either control mCherry-shRNA (control), APache mCherry-shRNA (APache KD) or rescued by co-transduction with shRNA-resistant EGFP-APache (APache rescue) and processed at 17 DIV. White arrowheads indicate autophagic vacuoles (AVs). Scale bar, 200 nm. (B, C) Quantification of the AV density (B) and the percent of neuronal processes containing AVs (C) in control (black bars), APache KD (white bars) and APache rescue (red bars) neurons (n = 54 images per genotype, from 3 independent preparations). (B, control: 0.4 ± 0.022; APache KD: 1.28 ± 0.008; APache rescue: 0.272 ± 0.025; C, control: 60.248 ± 7.687%; APache KD: 86.364 ± 4.545%; APache rescue: 56.818 ± 9.185%). (D) Representative electron micrographs of presynaptic terminals from control, APache KD or APache rescue cortical neurons. Scale bar, 200 nm. (E, F) Quantification of the percent of synapses containing AVs (E) and the AV density (F) in control, APache KD and APache rescue neurons (n = 114 control synapses, n = 100 APache KD synapses and n = 50 APache rescue synapses, from 4 independent preparations). (E, control: 4.897 ± 1.799%; APache KD: 15.278 ± 2.240%; APache rescue: 6.6 ± 1.5%; F, control: 0.641 ± 0.25; APache KD: 1.05 ± 0.128; APache rescue: 0.349 ± 0.015). All graphs show means ± SEM. *p < 0.05; ***p < 0.001; n.s.= non-significant, one-way ANOVA/Bonferroni’s tests
Fig. 4
Fig. 4
APache silencing increases LC3-positive structures in cortical neurons. (A) Representative confocal images of cortical neurons transduced at 12 DIV with lentiviral vectors coding for either control mCherry-shRNA (control) or APache mCherry-shRNA (APache KD) and stained for LC3 (green) at 17 DIV. Scale bar, 10 μm. (B) Quantification of LC3 fluorescence intensity in control and APache KD neurons (control: 4.14 ± 0.61; APache KD: 10.18 ± 1.73, n = 31–33 neurons, from 3 independent preparations). (C) Quantification of LC3-puncta density in control and APache KD neurons (control: 0.048 ± 0.007; APache KD: 0.074 ± 0.006, n = 31–33 neurons, from 3 independent preparations). (D) Representative confocal images of either control or APache KD cortical neurons double stained for LC3 (green) and VAMP2 (magenta) to identify synaptic boutons. White boxes indicate neurites shown on the right at higher magnification. Arrowheads in the magnified inserts denote synaptic boutons positive for LC3-positive structures. Scale bars: 20 μm, 10 μm (inserts). (E) Quantification of the percent of LC3 puncta colocalizing with VAMP2 in control and APache KD neurons based on Manders’ coefficient (control: 13.42 ± 1.63%; APache KD: 24.91 ± 2.72%, n = 36–38 neurons, from 3 independent preparations). (F) Quantification of LC3 fluorescence intensity values at VAMP2-positive puncta in control and APache KD neurons (control: 19.2 ± 1.84; APache KD: 57.61 ± 4.83, n = 87–88 synapses, from 3 independent preparations). A.U. = arbitrary units of fluorescence intensity. All graphs show means ± SEM. **p < 0.01; ***p < 0.001, Mann-Whitney’s U-test (B, C), ***p < 0.001; ****p < 0.0001, unpaired Student’s t-test with Welch’s correction (E, F). See also Figure S2
Fig. 5
Fig. 5
Accumulation of amphisomes in cortical neurons after APache silencing. (A) Representative confocal images of cortical neurons transduced at 12 DIV with lentiviral vectors coding for either control mCherry-shRNA (control) or APache mCherry-shRNA (APache KD) and double stained for LC3 (green) and Rab7 (red) at 17 DIV. Channels were pseudocolor-coded to better illustrate the co-localization (mCherry-shRNA displayed in cyan). White boxes indicate proximal neurites shown on the right at higher magnification. Arrows in the magnified inserts indicate points of co-localization between LC3 and Rab7. Scale bars: 10 μm, 5 μm (inserts). (B) Quantification of Rab7 fluorescence intensity in control and APache KD neurons (control: 10.55 ± 2.40, APache KD: 33.24 ± 5.09, n = 31 neurons from 3 independent preparations). A.U. = arbitrary units of fluorescence intensity. (C) Quantification of the percent of LC3 puncta colocalizing with Rab7 in control and APache KD neurons based on Manders’ coefficient (control: 7.84 ± 1.42%, APache KD: 12.68 ± 1.46%, n = 31–33 neurons from 3 independent preparations). (D, E) Quantification of the number of LC3- (D) and Rab7- (E) positive puncta counted on 30-µm axonal branches starting from the cell body in control and APache KD neurons (LC3 control: 0.038 ± 0.008, LC3 APache KD: 0.135 ± 0.022, Rab7 control: 0.088 ± 0.010, Rab7 APache KD: 0.175 ± 0.025, n = 29–32 neurons, from 3 independent preparations). (F, G) Representative blots (F) and quantitative analysis (G) of lysates from control and APache KD neurons at 17 DIV. Compared to control neurons, APache KD neurons show increased expression levels of LC3II and Rab7 (late endosomal marker) and decreased expression levels of AP-2α, β and µ subunits. No significant difference in Rab5 (early endosomal marker) expression has been observed. Actin, shown with APache on the same blot, was used as loading control. Protein levels in APache KD neurons are expressed in percent of control neurons (APache: 3.26 ± 0.89%; AP-2α: 52.74 ± 7.7%; AP-2β: 46.12 ± 9.13%; AP-2µ: 58.19 ± 6.03%; LC3II: 176.8 ± 11.6%; Rab7: 164.5 ± 10.45%; Rab5: 101.4 ± 10.16%, from n = 5–6 independent preparations). All graphs show means ± SEM. **p < 0.01; ****p < 0.0001, Mann-Whitney’s U-test (B-D); *p < 0.05; **p < 0.01; ***p < 0.001, unpaired Student’s t-test (E, G)
Fig. 6
Fig. 6
APache silencing blocks the autophagic flux in cortical neurons. (A) Representative confocal images of control or APache KD cortical neurons (mCherry-shRNA) stained for p62 (green) at 17 DIV. Scale bar, 10 μm. (B) Quantification of p62 fluorescence intensity values in control and APache KD neurons (control: 5.85 ± 0.45; APache KD: 15.17 ± 1.74, n = 34–37 neurons, from 3 independent preparations). A.U. = arbitrary units of fluorescence intensity. (C) Representative confocal images of mouse cortical neurons at 17 DIV co-transfected with vectors coding for either control mTourquoise-shRNA (control) or APache mTourquoise-shRNA (APache KD) and tandem mCherry-eGFP-tagged LC3, as a reporter of autolysosome formation, at 14 DIV. White boxes indicate the cell soma area shown on the right at higher magnification. Scale bars: 20 μm, 10 μm (inserts). (D) Mean eGFP/mCherry intensity ratio in control and APache KD neurons (control: 0.9861 ± 0.1692; APache KD: 1.997 ± 0.2414, n = 44–45 neurons, from 5 independent preparations). A.U. = arbitrary units of fluorescence intensity. All graphs show means ± SEM. ****p < 0.0001, Mann-Whitney’s U-test (B, D). See also Figure S3 and Figure S4
Fig. 7
Fig. 7
APache silencing alters the retrograde transport of LC3/TrkB-containing amphisomes in cortical neurons. (A) Time-lapse images of mRFP-LC3b positive puncta (arrowheads) along the axons of mouse cortical neurons at 14 DIV co-transfected with either control GFP-shRNA (control) or APache GFP-shRNA (APache KD) at 11 DIV. The corresponding representative kymographs of mRFP-LC3b puncta representing motion as displacement along the axon over time are shown on the right panels. Scale bar, 5 μm. (B) Relative axonal mobility of mRFP-LC3b puncta in control and APache KD neurons expressed in percent of total LC3 puncta. Deletion of APache significantly decreases the percentage of retrograde moving autophagosomes and concurrently increases that of stationary ones, while leaving unaltered the number of anterogradely moving autophagomes (control static: 71.10 ± 2.47%; APache KD static: 83.33 ± 1.76%; control retrograde: 22.19 ± 2.29%; APache KD retrograde: 9.94 ± 1.30%; control anterograde: 6.77 ± 1.13%; APache KD anterograde: 6.82 ± 1.01%, n = 31–33 neurons, from n = 3 independent preparations). (C) Decreased average retrograde axonal velocity of mRFP-LC3b puncta in APache KD neurons compared to control neurons (control: 0.23 ± 0.02 μm/s; APache KD: 0.17 ± 0.02 μm/s, n = 25–28 puncta, from n = 3 independent preparations). (D) Time-lapse images of mRFP-TrkB positive puncta (arrowheads) along the axons of control or APache KD cortical neurons and representative kymographs on the right panels. Scale bar, 5 μm. (E) Relative axonal mobility of mRFP-TrkB puncta in control and APache KD neurons expressed in percent of total TrkB puncta (control static: 55.00 ± 4.95%; APache KD static: 83.95 ± 3.00%; control retrograde: 33.60 ± 4.67%; APache KD retrograde: 10.75 ± 2.07%; control anterograde: 8.75 ± 1.93%; APache KD anterograde: 5.25 ± 1.52%, n = 20 neurons, from n = 3 independent preparations). (F) Decreased average retrograde axonal velocity of mRFP-TrkB puncta in APache KD neurons compared to control neurons (control: 0.32 ± 0.02 μm/s; APache KD: 0.22 ± 0.02 μm/s, n = 50–58 puncta, from n = 3 independent preparations). All graphs show means ± SEM. ****p < 0.0001, two-way ANOVA/Bonferroni’s tests (B, E); *p < 0.05; ****p < 0.0001, Mann-Whitney’s U-test (C, F)
Fig. 8
Fig. 8
Lysosome density and function are not affected by APache silencing. (A) Representative confocal images of either control or APache KD neurons (mCherry-shRNA) stained for the lysosomal marker LAMP1 (green) at 17 DIV. Scale bar, 20 μm. (B) LAMP1 fluorescence intensity in APache KD neurons are unaltered compared to control neurons (control: 71.46 ± 8.44, APache KD: 69.70 ± 5.87, n = 24 neurons, from 3 independent preparations). A.U. = arbitrary units of fluorescence intensity. (C, D) Representative blots (C) and quantitative analysis (D) of LAMP1, ATP6V1A and cathepsin D (CTSD, pro-form + active form) protein levels in control and APache KD neurons at 17 DIV. Actin was used as loading control. No significant changes in protein expression levels were observed. Protein levels in APache KD neurons are expressed in percent of control neurons. (LAMP1: 97.71 ± 4.82%; ATP6V1A: 106.8 ± 9.14%; cathepsin D: 111.4 ± 14.82%, from n = 6 independent preparations). (E) Cathepsin D activity in control and APache KD neurons. Data are normalized to µg protein/sample and expressed in percent of control values (APache KD: 116.3 ± 6.97%, n = 8 samples from 3 independent preparations). (F) Representative blots of the EGFR degradation assay. Control and APache KD cortical neurons at 17 DIV were treated with EGF (200 ng/ml, 15 min) and incubated for the indicated times in the presence of CHX (5 µg/ml). Cell lysates were analyzed with anti-EGFR antibodies to monitor degradation of EGFR. Actin was used as loading control. (G) Quantitative analysis of EGFR protein levels, expressed in percent of the initial amount, revealed no significant changes in its degradation rate between control and APache KD neurons. (control 1 h: 92.49 ± 21.32%; APache KD 1 h: 92.12 ± 23.46%; control 4 h: 53.46 ± 17.52%; APache KD 4 h: 18.12 ± 9.72%, from n = 5 independent preparations). All graphs show means ± SEM. n.s.= non-significant; unpaired Student’s t-test with Welch’s correction (B, DE); two-way ANOVA/Bonferroni’s tests (G)

References

    1. Harris JJ, Jolivet R, Attwell D (2012) Synaptic energy use and supply. Neuron 75:762–777. 10.1016/j.neuron.2012.08.019 - PubMed
    1. Ziv NE (2018) Maintaining the active zone: demand, supply and disposal of core active zone proteins. Neurosci Res 127:70–77. 10.1016/j.neures.2017.09.014 - PubMed
    1. Cohen LD, Ziv NE (2017) Recent insights on principles of synaptic protein degradation. [version 1; peer review: 3 approved]. F1000Res 6:675. 10.12688/f1000research.10599.1 - PMC - PubMed
    1. Giovedì S, Ravanelli MM, Parisi B, Bettegazzi B, Guarnieri FC (2020) Dysfunctional autophagy and endolysosomal system in neurodegenerative diseases: relevance and therapeutic options. Front Cell Neurosci 14:602116. 10.3389/fncel.2020.602116 - PMC - PubMed
    1. Kabeya Y, Mizushima N, Ueno T, Yamamoto A, Kirisako T, Noda T, Kominami E, Ohsumi Y, Yoshimori T (2000) LC3, a mammalian homologue of yeast Apg8p, is localized in autophagosome membranes after processing. EMBO J 19:5720–5728. 10.1093/emboj/19.21.5720 - PMC - PubMed

MeSH terms

LinkOut - more resources