. 2024 Oct 6;10(1):88.
doi: 10.1038/s41523-024-00697-5.

Clinical and immune responses to neoadjuvant fulvestrant with or without enzalutamide in ER+/Her2- breast cancer

Affiliations

Clinical and immune responses to neoadjuvant fulvestrant with or without enzalutamide in ER+/Her2- breast cancer

Anthony D Elias et al. NPJ Breast Cancer. .

Abstract

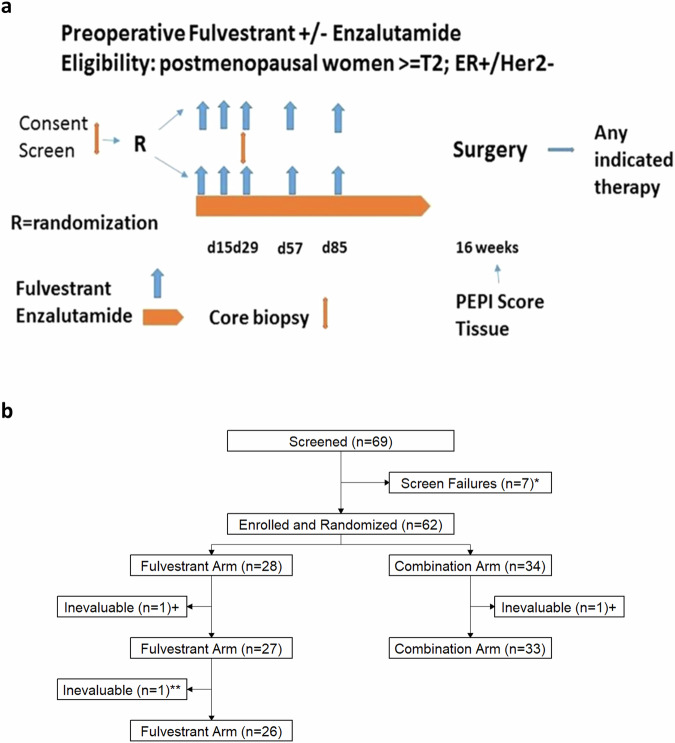
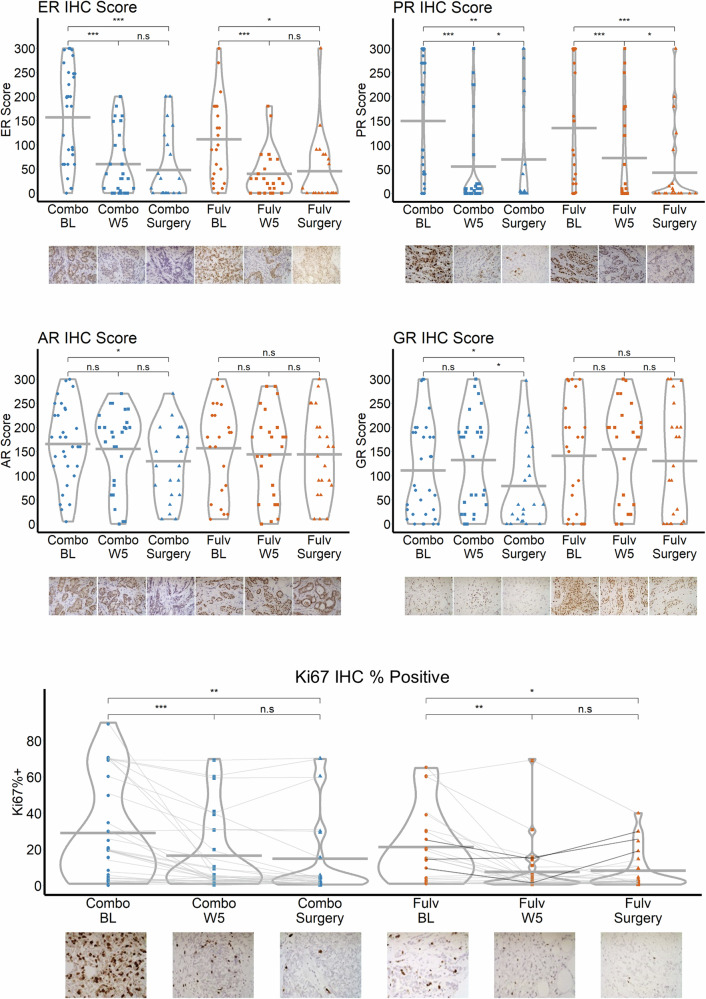
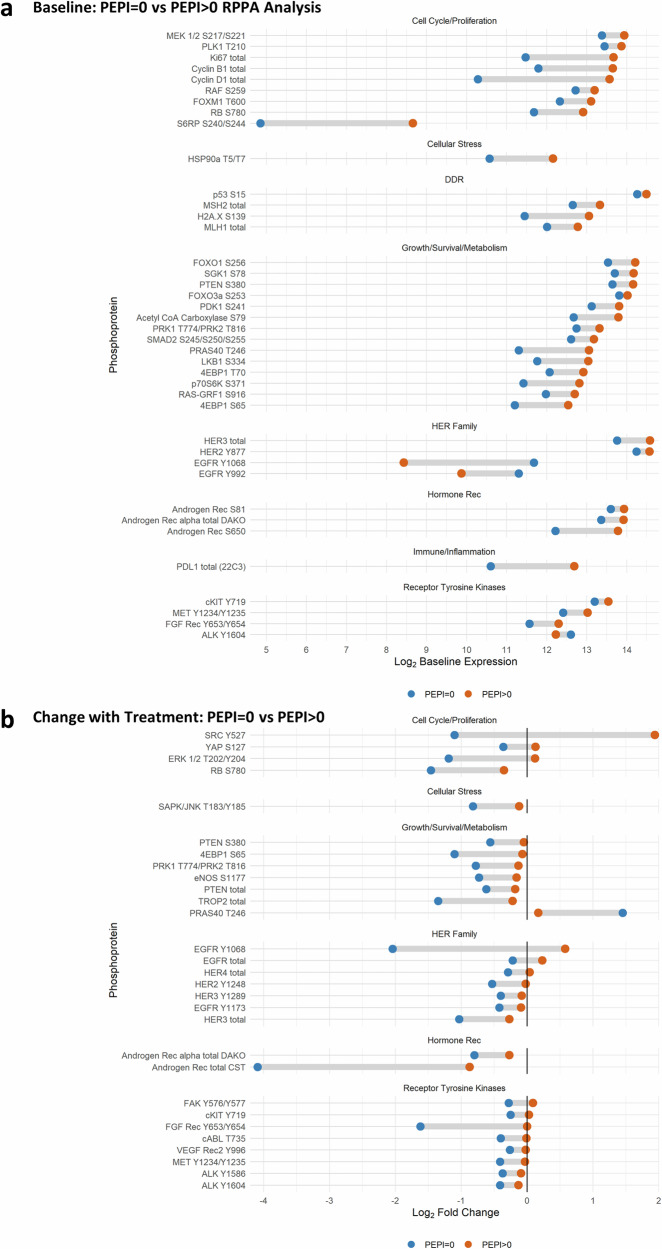
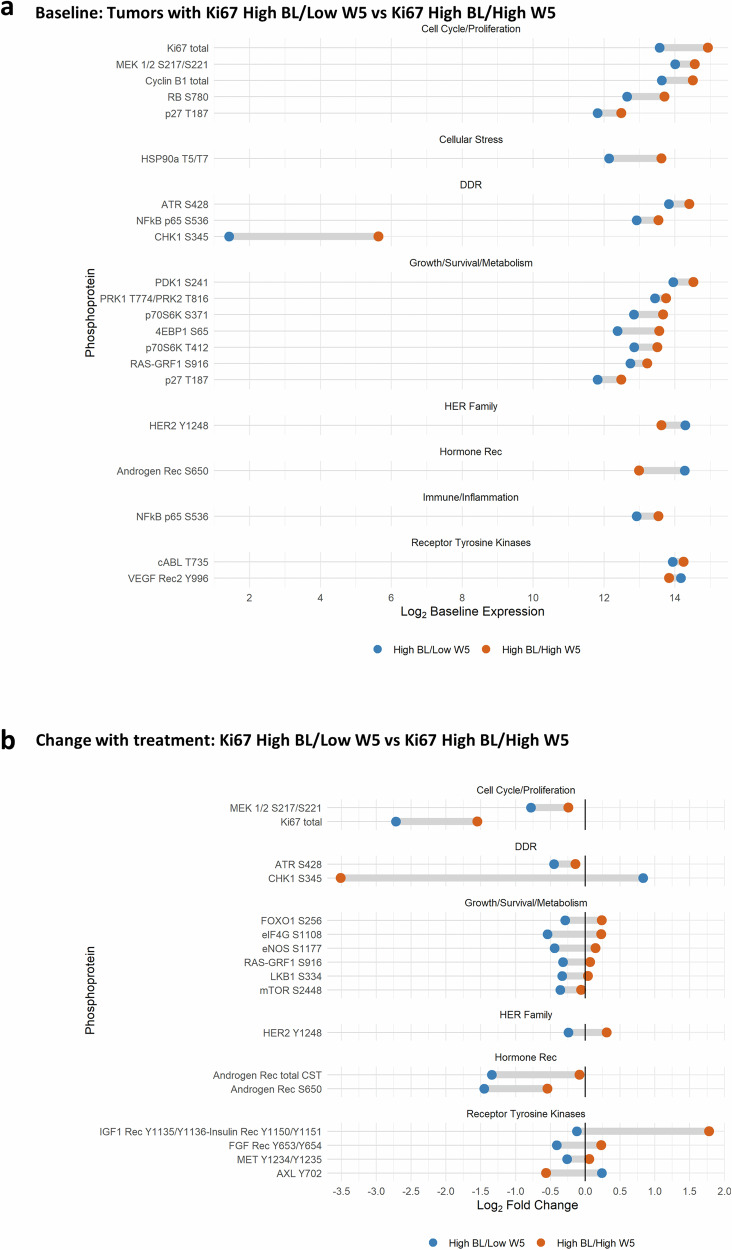
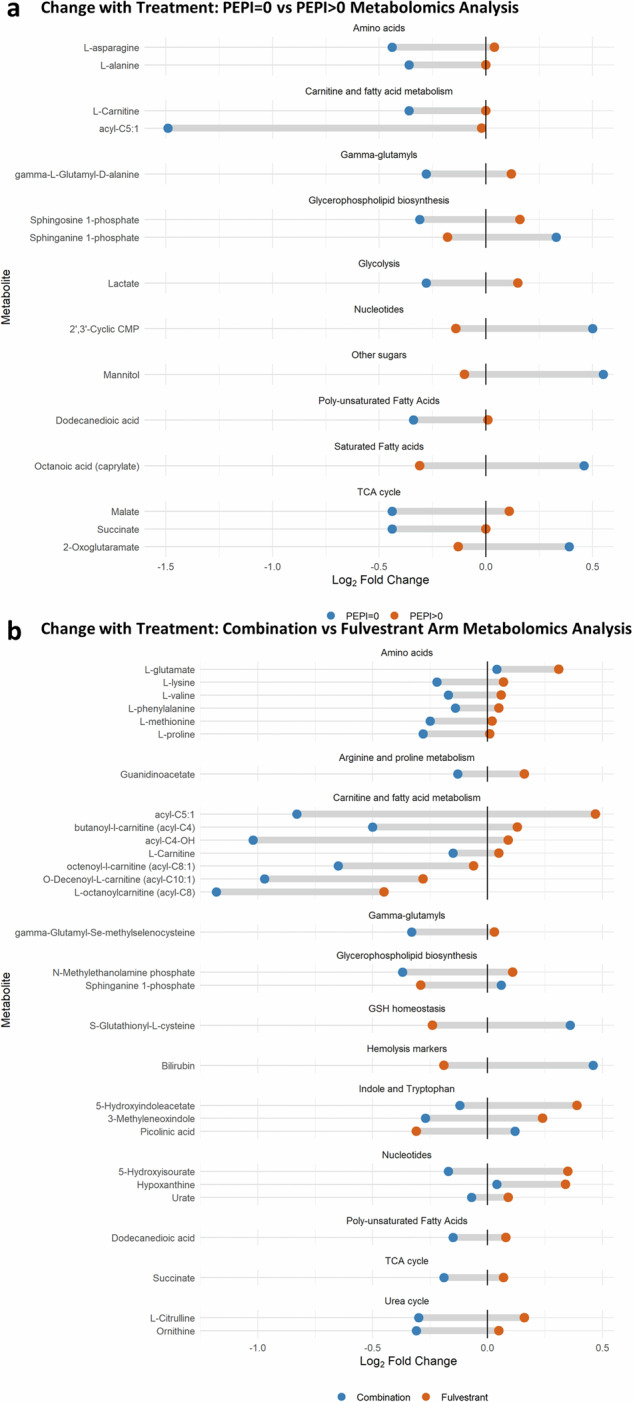
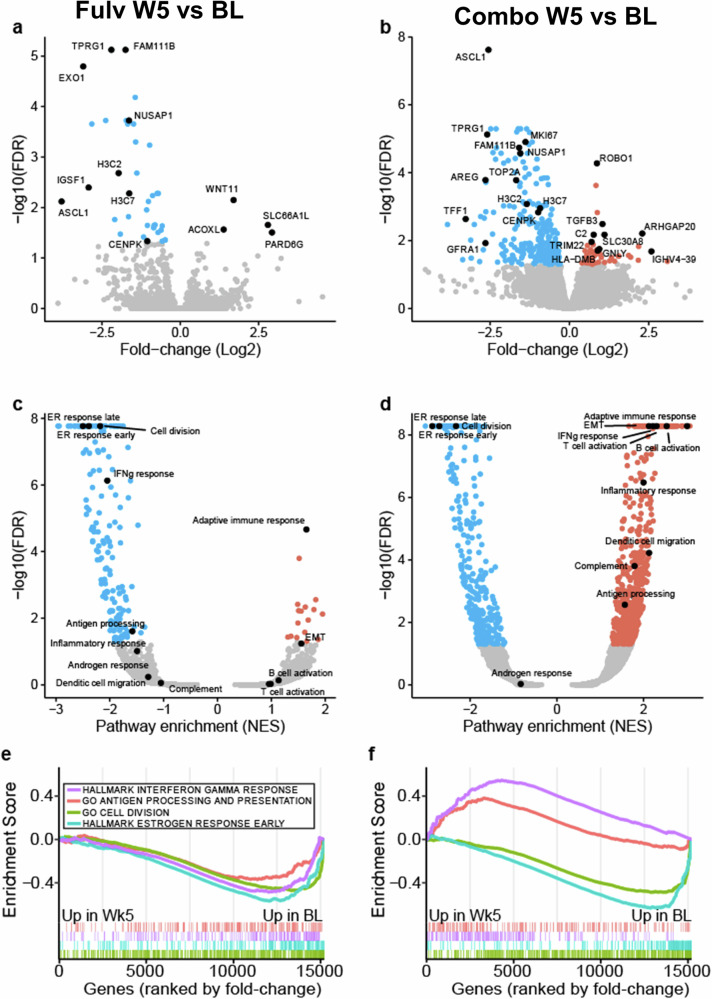
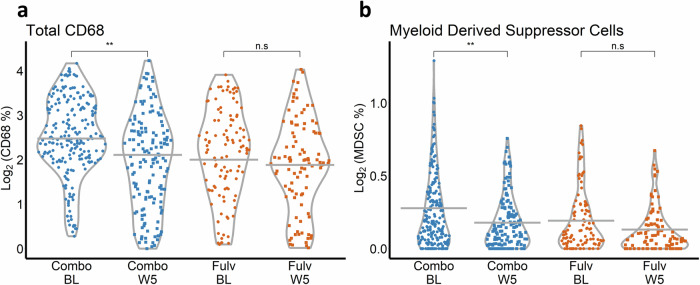
Most ER+ breast cancers (BC) express androgen receptors (AR). This randomized phase II trial of 4 months of neoadjuvant fulvestrant (Fulv) alone or with enzalutamide (Combo) assessed whether adding AR blockade to Fulv would limit residual tumor at the time of surgery, as measured by modified preoperative endocrine predictive index (PEPI) score. Eligible patients were women with ER+/HER2- primary BC cT2 or greater. Stratification factors were clinical node and T-stage. Fresh tumor biopsies were required at study entry, after 4 weeks on therapy (W5), and at surgery. Laboratory analyses on tumors included immunochemistry (IHC) for ER/PR/AR/GR and Ki67 protein, evaluation of gene expression, multiplex for myeloid lineage immune cells, reverse-phase protein array, and plasma metabolomic analyses. Of 69 consented patients, 59 were evaluable. Toxicity was as expected with endocrine therapy. Combo achieved PEPI = 0 more frequently (24%: 8/33) than Fulv (8%: 2/26). Ki67 was ≤10% across arms by W5 in 76% of tumors. Activation of mTOR pathway proteins was elevated in tumors with poor Ki67 response. Tumors in both arms showed decreased estrogen-regulated and cell division gene sets, while Combo arm tumors uniquely exhibited enrichment of immune activation gene sets, including interferon gamma, complement, inflammation, antigen processing, and B and T cell activation. Multiplex IHC showed significantly reduced tumor-associated macrophages and CD14+/HLADR-/CD68- MDSCs in Combo tumors at W5. In summary, Combo tumors showed a higher PEPI = 0 response, Ki67 response, and more activated tumor immune microenvironment than Fulv. The odds of response were 4.6-fold higher for patients with ILC versus IDC. (Trial registration: This trial is registered at Clinicaltrials.gov ( https://www.clinicaltrials.gov/study/NCT02955394?id=16-1042&rank=1 ). The trial registration number is NCT02955394. The full trial protocol is available under Study Details at the Clinicaltrials.gov link provided).


Conflict of interest statement

The authors declare no competing interests.

Figures

Fig. 1
Fig. 1. Flow of study.
a Study schema. b CONSORT diagram flow chart. *Three were ineligible, four withdrew for surgery first. +Not treated (surgery first). **Treated for 4 weeks until W5 biopsy demonstrated Her2 amplification and withdrawn by MD; inevaluable.
Fig. 2
Fig. 2. Immunohistochemistry (IHC) in serial biopsies by treatment arm and time.
Points represent individual observations and horizontal lines indicate the mean in each group. T-tests were used to compare the Combo and Fulv arms for each outcome and time point. Paired t-tests were used to evaluate within-group changes over time. “n.s.,” “*,” “**,” and “***” indicate non-significance (p > 0.05), p < 0.05, p < 0.01, and p < 0.001, respectively. Images of one patient’s paired samples over time are shown for each protein under the x-axis as an example. Data points in the Ki67 plot are vertically jittered up to one unit. Magnification = 400×.
Fig. 3
Fig. 3. RPPA by PEPI score.
Reverse-phase phosphoprotein analysis (RPPA) was performed on laser-captured, fresh frozen tumor that was split into two groups for comparison: PEPI = 0 (blue, N = 9) tumors that responded to treatment, and PEPI > 0 (orange, N = 45) tumors that did not. Tumors came from patients in both arms. Presented phosphoproteins were significantly (p < 0.1) differentially expressed by the Empirical Bayes moderated t-test. a Dumbbell plot of the mean log2 baseline expression for patients with PEPI = 0 and PEPI > 0 for each significant phosphoprotein. b Dumbbell plot of the mean log2 change in expression among patients with PEPI = 0 and PEPI > 0 for each significant phosphoprotein.
Fig. 4
Fig. 4. RPPA by Ki67 response.
RPPA was performed on laser-captured, fresh frozen tumor from the baseline (BL) and week 5 (W5) biopsies. To identify phosphoproteins differentially expressed at BL between tumors that responded to treatment, the samples were split into two groups for comparison: High BL/Low W5, defined as Ki67 > 10% at BL, but ≤10% at W5; versus High BL/High W5, defined as Ki67 > 10% at baseline and >10% remaining at W5. Blue represents High BL/Low W5 (N = 13), and orange represents High BL/High W5 (N = 9). Presented phosphoproteins were significantly (p < 0.1) differentially expressed at the respective time points by the Empirical Bayes moderated t-test. a Dumbbell plot of the mean log2 baseline expression for patients with High BL/Low W5 and High BL/High W5 for each significant phosphoprotein. b Dumbbell plot of the mean log2 fold change in expression with treatment (W5–BL) by Ki67 for each phosphoprotein.
Fig. 5
Fig. 5. Metabolomics change with treatment by PEPI score and Arm.
a Dumbbell plot of the mean log2 fold change in expression with treatment (W5–BL) by PEPI score (blue: PEPI = 0 (N = 9), orange: PEPI > 0 (N = 41)) and metabolite. Presented metabolites were significantly (p < 0.1) differently expressed with treatment by the eBayes moderated t-test. b Dumbbell plot by arm (blue: Combination (N = 29), orange: Fulvestrant (N = 21)).
Fig. 6
Fig. 6. Genes and pathways induced by treatment.
Paired treated samples were compared to baseline in the Fulvestrant-only arm (left panel; a, c, e) or the combination arm (right; b, d, f). Volcano plots display the differential gene expression results from each comparison (a, b). Select significant genes (FDR < 0.5, red is higher in treatment and blue is higher in baseline) are labeled in black. Volcano plot displaying GSEA significance and normalized enrichment scores (NES) for each comparison with select pathways labeled (c, d). GSEA enrichment plots displaying select pathways in each comparison (e, f). Below the enrichment score are ticks indicating the ranked positions of genes from each gene set (positive to negative fold change).
Fig. 7
Fig. 7. Myeloid multiplex.
Violin plots are presented for each vectra imaging outcome by treatment arm (Combo, Fulv) and time (BL, W5). Time is on the x-axis, and the log-transformed outcome is on the y-axis. Gray horizontal lines indicate time-specific LMM-predicted averages, and points represent the observed outcome for each of the 576 spectral images collected from 59 patients (N = 33 Combo BL, 26 Combo W5, 23 Fulv BL, 25 Fulv W5). P-values were calculated from model contrast statement Z-tests. “n.s.” and “**” indicate non-significance (p > 0.05) and p < 0.01, respectively. a Violin plot of log2 CD68. b Violin plot of log2 myeloid-derived suppressor cells (MDSCs). MDSC expression is defined by the percent of CD14+HLADR−CD68− cells/total cells for this multiplex panel.

References

    1. Collins, L. C. et al. Androgen receptor expression in breast cancer in relation to molecular phenotype: results from the Nurses’ Health Study. Mod. Pathol.24, 924–931 (2011). - PMC - PubMed
    1. Ricciardelli, C. et al. The magnitude of androgen receptor positivity in breast cancer is critical for reliable prediction of disease outcome. Clin. Cancer Res.24, 2328–2341 (2018). - PubMed
    1. Cao, L. et al. A high AR:ERα or PDEF:ERα ratio predicts a sub-optimal response to tamoxifen therapy in ERα-positive breast cancer. Cancer Chemother. Pharmacol.84, 609–620 (2019). - PubMed
    1. Cochrane, D. R. et al. Role of the androgen receptor in breast cancer and preclinical analysis of enzalutamide. Breast Cancer Res.16, R7 (2014). - PMC - PubMed
    1. D’Amato, N. C. et al. Cooperative dynamics of AR and ER activity in breast cancer. Mol. Cancer Res.14, 1054–1067 (2016). - PMC - PubMed

Associated data