

The risk factors determined by four machine learning methods for the change of difference of bone mineral density in post-menopausal women after three years follow-up
- PMID: 39369003
- PMCID: PMC11455928
- DOI: 10.1038/s41598-024-73799-6
The risk factors determined by four machine learning methods for the change of difference of bone mineral density in post-menopausal women after three years follow-up
Abstract
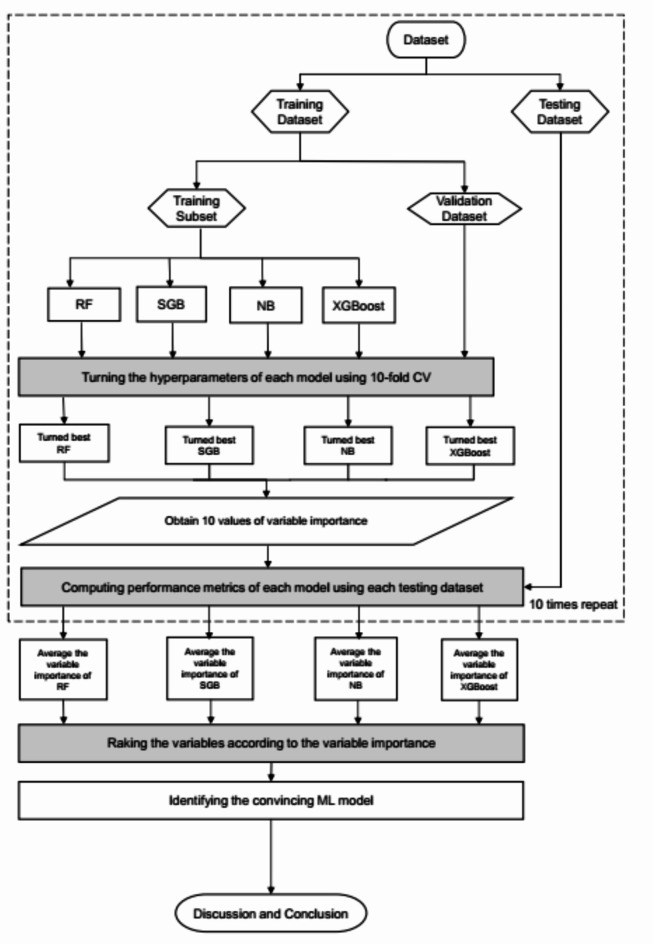
The prevalence of osteoporosis has drastically increased recently. It is not only the most frequent but is also a major global public health problem due to its high morbidity. There are many risk factors associated with osteoporosis were identified. However, most studies have used the traditional multiple linear regression (MLR) to explore their relationships. Recently, machine learning (Mach-L) has become a new modality for data analysis because it enables machine to learn from past data or experiences without being explicitly programmed and could capture nonlinear relationships better. These methods have the potential to outperform conventional MLR in disease prediction. In the present study, we enrolled a Chinese post-menopause cohort followed up for 4 years. The difference of T-score (δ-T score) was the dependent variable. Information such as demographic, biochemistry and life styles were the independent variables. Our goals were: (1) Compare the prediction accuracy between Mach-L and traditional MLR for δ-T score. (2) Rank the importance of risk factors (independent variables) for prediction of δ T-score. Totally, there were 1698 postmenopausal women were enrolled from MJ Health Database. Four different Mach-L methods namely, Random forest (RF), eXtreme Gradient Boosting (XGBoost), Naïve Bayes (NB), and stochastic gradient boosting (SGB), to construct predictive models for predicting δ-BMD after four years follow-up. The dataset was then randomly divided into an 80% training dataset for model building and a 20% testing dataset for model testing. A 10-fold cross-validation technique for hyperparameter tuning was used. The model with the lowest root mean square error for the validation dataset was viewed as the best model for each ML method. The averaged metrics of the RF, SGB, NB, and XGBoost models were used to compare the model performance of the benchmark MLR model that used the same training and testing dataset as the Mach-L methods. We defined that the priority demonstrated in each model ranked 1 as the most critical risk factor and 22 as the last selected risk factor. For Pearson correlation, age, education, BMI, HDL-C, and TSH were positively and plasma calcium level, and baseline T-score were negatively correlated with δ-T score. All four Mach-L methods yielded lower prediction errors than the MLR method and were all convincing Mach-L models. From our results, it could be noted that education level is the most important factor for δ-T Score, followed by DBP, smoking, SBP, UA, age, and LDL-C. All four Mach-L outperformed traditional MLR. By using Mach-L, the most important six risk factors were selected which are, from the most important to the least: DBP, SBP, UA, education level, TG and sleeping hour. δ T score was positively related to SBP, education level, UA and TG and negatively related to DBP and sleeping hour in postmenopausal Chinese women.
Keywords: Longitudinal study; Machine learning; Osteoporosis.
© 2024. The Author(s).
Conflict of interest statement
The authors declare no competing interests.
Figures


References
-
- Yamaguchi, T. [Bone metabolism in dyslipidemia and metabolic syndrome]. Clin. Calcium. 21(5), 677–682 (2011). - PubMed
MeSH terms
LinkOut - more resources
Full Text Sources
Medical
Miscellaneous
