. 2024 Oct 5;15(1):8653.
doi: 10.1038/s41467-024-52960-9.

A fair individualized polysocial risk score for identifying increased social risk in type 2 diabetes

Affiliations

A fair individualized polysocial risk score for identifying increased social risk in type 2 diabetes

Yu Huang et al. Nat Commun. .

Abstract

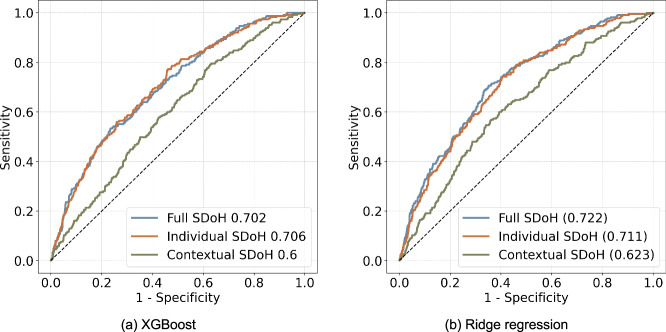
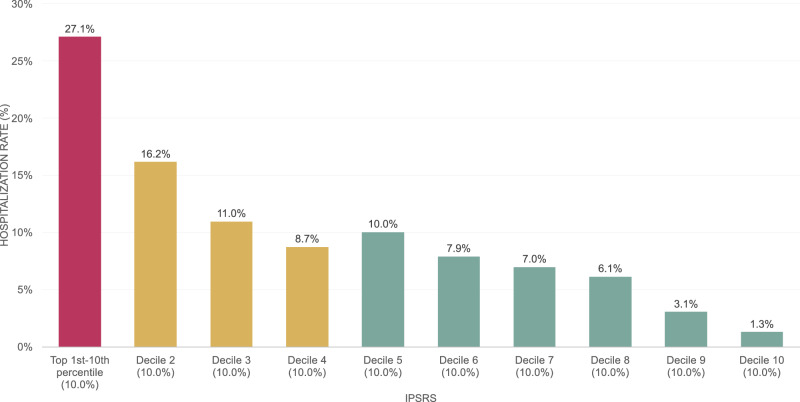
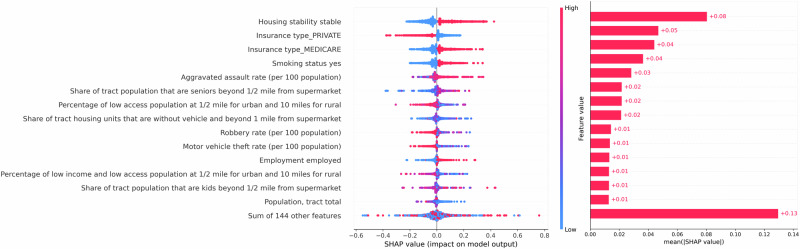
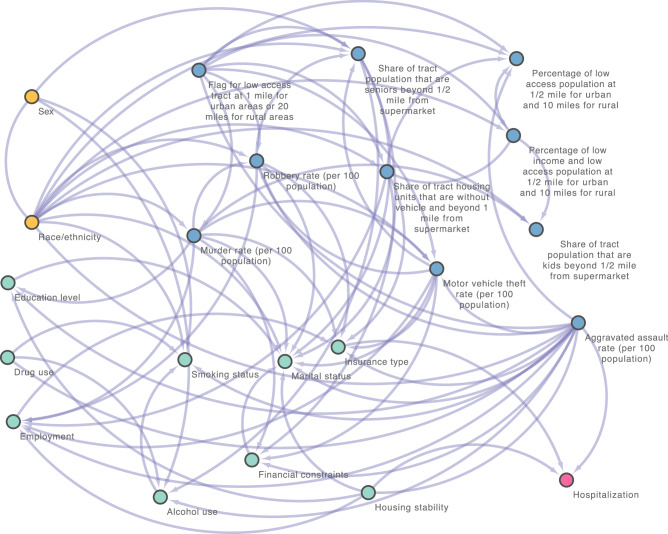
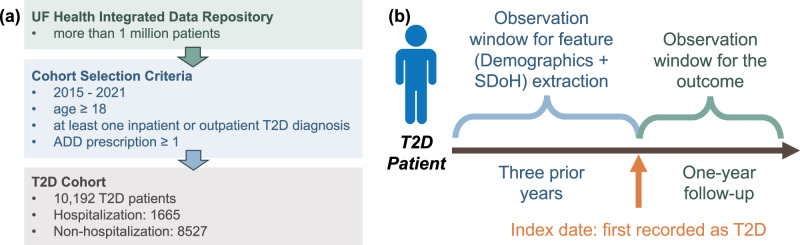
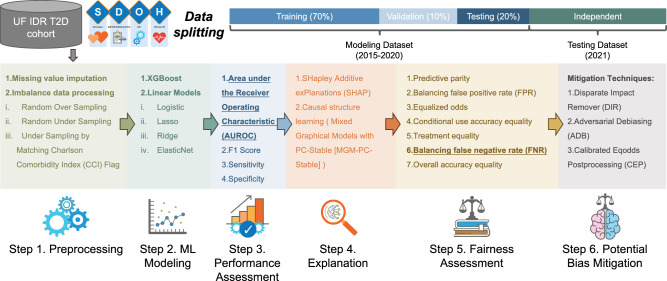
Racial and ethnic minorities bear a disproportionate burden of type 2 diabetes (T2D) and its complications, with social determinants of health (SDoH) recognized as key drivers of these disparities. Implementing efficient and effective social needs management strategies is crucial. We propose a machine learning analytic pipeline to calculate the individualized polysocial risk score (iPsRS), which can identify T2D patients at high social risk for hospitalization, incorporating explainable AI techniques and algorithmic fairness optimization. We use electronic health records (EHR) data from T2D patients in the University of Florida Health Integrated Data Repository, incorporating both contextual SDoH (e.g., neighborhood deprivation) and person-level SDoH (e.g., housing instability). After fairness optimization across racial and ethnic groups, the iPsRS achieved a C statistic of 0.71 in predicting 1-year hospitalization. Our iPsRS can fairly and accurately screen patients with T2D who are at increased social risk for hospitalization.


Conflict of interest statement

The authors declare no competing interests.

Figures

Fig. 1
Fig. 1. Model performance assessment of XGBoost and ridge regression.
The receiver operating characteristic curve curves of best-performing models with three different sets of features (individual-level Social Determinants of Health [SDoH] only, contextual-level SDoH only, and both combined). a XGBoost. b Ridge Regression.
Fig. 2
Fig. 2. The one-year hospitalization risk predicted by iPsRS is divided into deciles.
The x-axis represents each of ten equal groups (a decile), while the y-axis shows the corresponding one-year hospitalization rate for each decile.
Fig. 3
Fig. 3. Feature importance analysis with SHAP values.
SHAP values from the original XGBoost. We removed the features with an “unknown” category.
Fig. 4
Fig. 4. Causal graph generated by MGM-PC-Stable in the independent testing set.
The yellow nodes present demographics, blue nodes stand for contextual-level SDoH and green nodes mean the individual-level SDoH, and the pink node indicates the outcome.
Fig. 5
Fig. 5. False negative rate (FNR) curve between different populations.
a XGBoost. b Ridge Regression.
Fig. 6
Fig. 6. NHB (protected group) vs. NHW (privileged group) and Hispanic vs. NHW, respectively.
The ideally fair line is represented by the blue line, while the range of statistically fair is shown by the red dots. the ridge regression model initially fell outside the range of statistically fair but became fairer when we employed the fairness issue mitigation methods CEP, DIR, and ADB, resulting in equal opportunity regarding FNR ratio. a Mitigation results on the NHB vs NHW. CEP had the best fairness issue mitigation ability but led to a drastic decrease in model performance from 0.722 to 0.550, measured by AUROC, which is unacceptable. DIR and ADB resulted in an acceptable decrease in prediction performance, particularly with DIR’s AUROC decreasing from 0.722 to 0.710. b Mitigation results on the Hispanic vs NHW. DIR and ADB struggled to handle the fairness issue mitigation. These methods turned to favoritism towards the protected group (Hispanic), resulting in biased predictions for the NHW group.
Fig. 7
Fig. 7. Processing workflow of the University of Florida integrated data repository type 2 diabetes (T2D) cohort and the patient timeline.
a T2D cohort construction process. b Patient timeline. Attribution: the man icon was designed by Freepik (www.freepik.com).
Fig. 8
Fig. 8. Data analytics pipeline for iPsRS.
This pipeline contains six steps: preprocessing, machine learning modeling, performance assessment, explanation, fairness assessment, and potential bias mitigation. Attribution: the icons for gear, graph, and brain were originally designed by Freepik (www.freepik.com). The other icons were designed by Vecteezy, including: <a href=https://www.vecteezy.com/free-vector/magnifying-glass>Magnifying Glass Vectors by Vecteezy </a>, <a href = “https://www.vecteezy.com/vector-art/45358325-a-set-of-icons-that-include-books-law-and-other-items”>a set of icons that include books, law, and other items Vectors by Vecteezy </a>, <a href = “https://www.vecteezy.com/vector-art/680841-set-of-health-checkup-thin-line-and-pixel-perfect-icons-for-any-web-and-app-project”>Set of Health Checkup thin line and pixel perfect icons for any web and app project. Vectors by Vecteezy </a>, <a href=https://www.vecteezy.com/free-vector/heart-rate>Heart Rate Vectors by Vecteezy </a>.

Update of

References

    1. Ong, K. L. et al. Global, regional, and national burden of diabetes from 1990 to 2021, with projections of prevalence to 2050: a systematic analysis for the Global Burden of Disease Study 2021. Lancet402, 203–234 (2023). - PMC - PubMed
    1. C. D. C. Type 2 Diabetes. Centers for Disease Control and Preventionhttps://www.cdc.gov/diabetes/basics/type2.html (2022).
    1. Social Determinants of Health. https://health.gov/healthypeople/priority-areas/social-determinants-health.
    1. Marmot, M. et al. Closing the gap in a generation: health equity through action on the social determinants of health. Lancet372, 1661–1669 (2008). - PubMed
    1. Bryant, T., Daiski, I., Lines, E. & Others. Type 2 diabetes: poverty, priorities and policy: the social determinants of the incidence and management of Type 2 diabetes (Toronto, Ontario, Canada: York University School of Health Policy and Management, 2010).

Publication types

LinkOut - more resources