

Turicibacter and Catenibacterium as potential biomarkers in autism spectrum disorders
- PMID: 39369020
- PMCID: PMC11455930
- DOI: 10.1038/s41598-024-73700-5
Turicibacter and Catenibacterium as potential biomarkers in autism spectrum disorders
Abstract
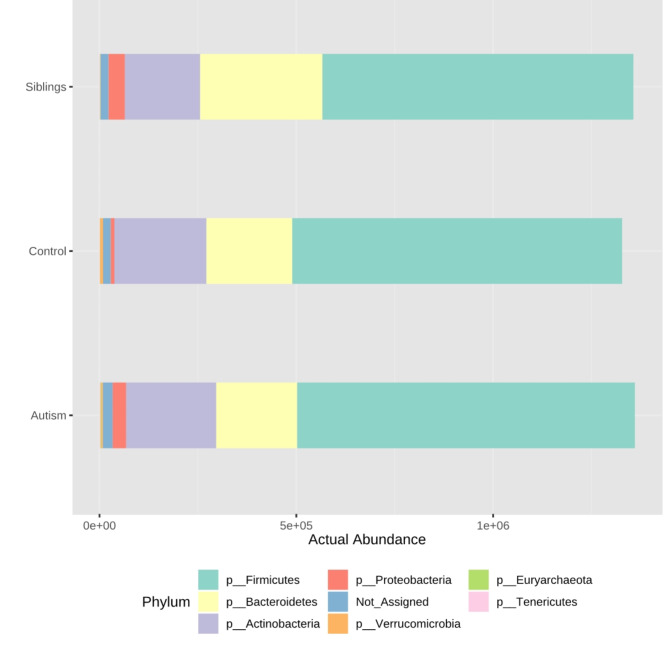
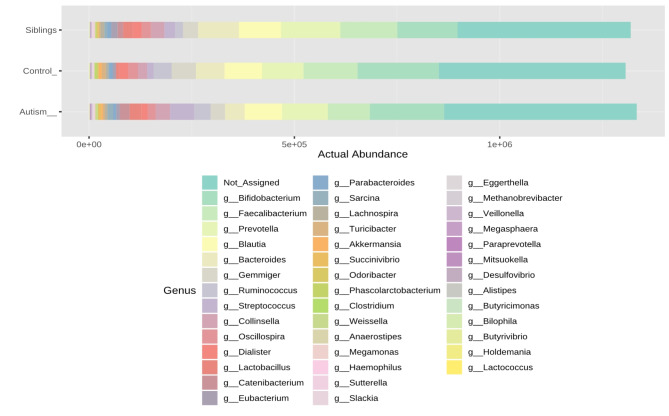
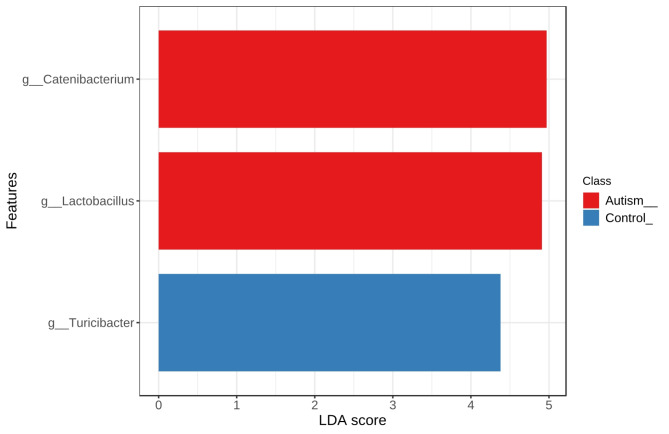
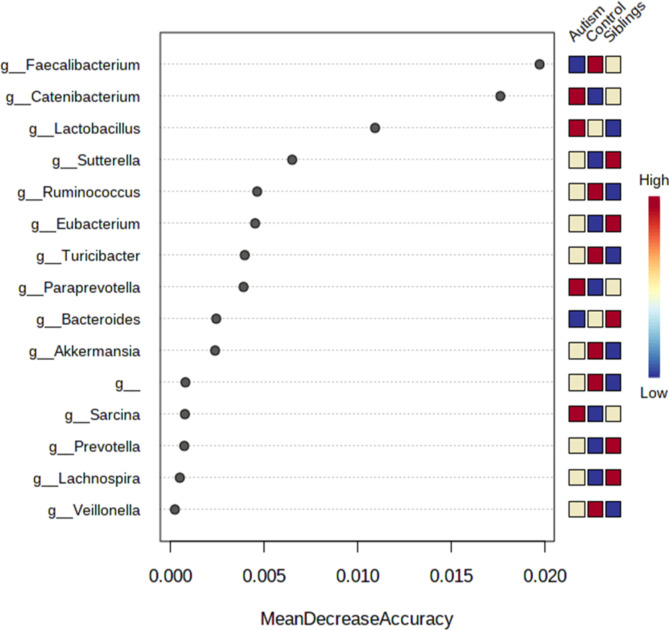
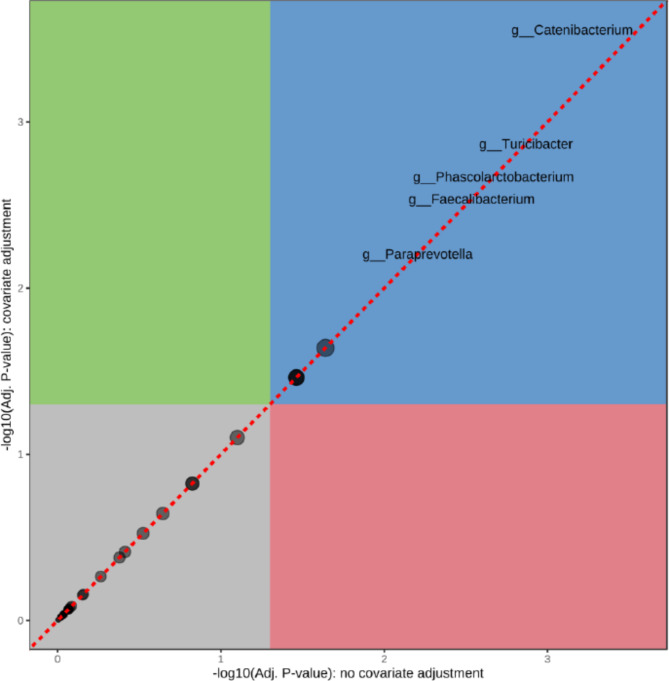
Autism spectrum disorders (ASD) are neurodevelopmental disorders characterized by social, behavioral, and cognitive impairments. Several comorbidities, including gastrointestinal (GI) dysregulations, are frequently reported in ASD children. Although studies in animals have shown the crucial role of the microbiota in key aspects of neurodevelopment, there is currently no consensus on how the alteration of microbial composition affects the pathogenesis of ASD. Moreover, disruption of the gut-brain axis (GBA) has been reported in ASD although with limited studies conducted on the Mediterranean population. In our study, we aimed to investigate gut microbiota composition in Lebanese ASD subjects, their unaffected siblings, and a control group from various regions in Lebanon using the 16 S-rRNA sequencing (NGS). Our study revealed a lower abundance of Turicibacter and a significant enrichment on Proteobacteria in the ASD and siblings' groups compared to the controls, indicating that gut microbiota is probably affected by dietary habits, living conditions together with host genetic factors. The study also showed evidence of changes in the gut microbiome of ASD children compared to their siblings and the unrelated control. Bacteroidetes revealed a lower abundance in the ASD group compared to controls and siblings, conversely, Catenibacterium and Tenericutes revealed an increased abundance in the ASD group. Notably, our study identifies alterations in the abundance of Turicibacter and Catenibacterium in ASD children suggesting a possible link between these bacterial taxa and ASD and contributing to the growing body of evidence linking the microbiome to ASD.
Keywords: Catenibacterium; Turicibacter; Autism spectrum disorders; Gastrointestinal dysregulations; Gut-brain axis; Microbiota.
© 2024. The Author(s).
Conflict of interest statement
The authors declare no competing interests.
Figures

References
-
- American Psychiatric Association, A., VA, USA. Diagnostic and Statistical Manual of Mental Disorders, 5th ed. https://dsm.psychiatryonline.org/doi/book/10.1176/appi.books.9780890425596 (2013).
-
- Sauer, A. K., Stanton, J. E., Hans, S. & Grabrucker, A. M. Autism spectrum disorders: Etiology and pathology. In Autism Spectrum Disorders (ed. Grabrucker, A. M.) (Exon Publications, 2021). - PubMed
MeSH terms
Substances
Grants and funding
LinkOut - more resources
Full Text Sources
Medical
