. 2024 Oct 5;7(1):1267.
doi: 10.1038/s42003-024-06955-3.

Metabolic regulation of mitochondrial morphologies in pancreatic beta cells: coupling of bioenergetics and mitochondrial dynamics

Affiliations

Metabolic regulation of mitochondrial morphologies in pancreatic beta cells: coupling of bioenergetics and mitochondrial dynamics

Wen-Wei Tseng et al. Commun Biol. .

Abstract

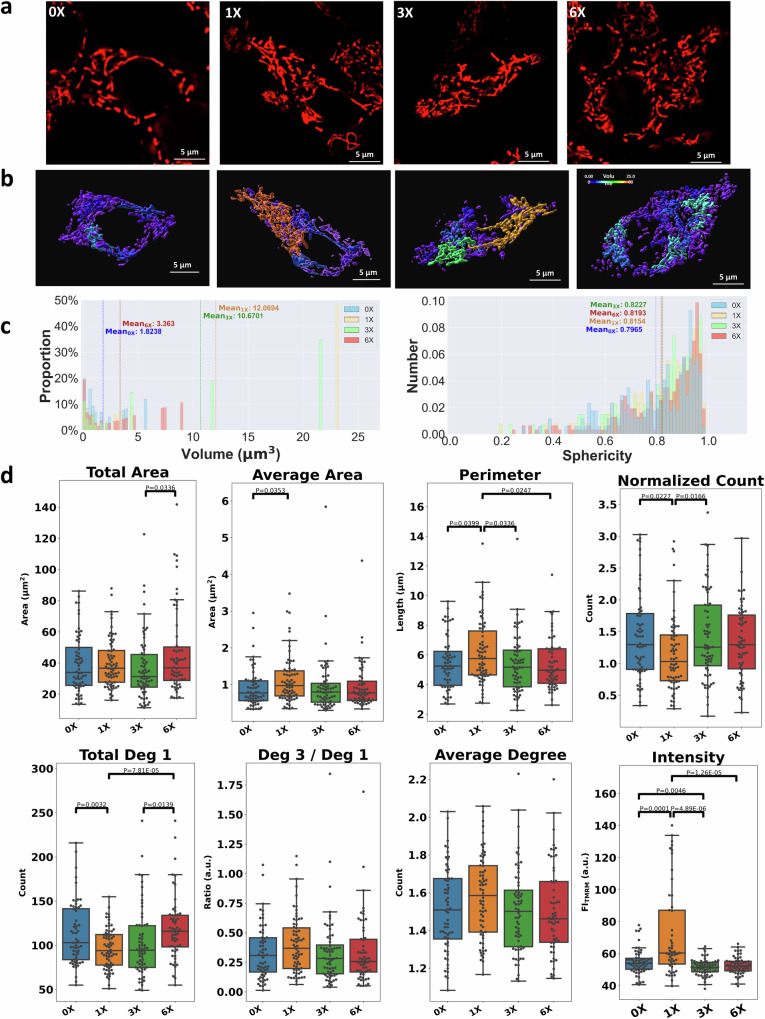
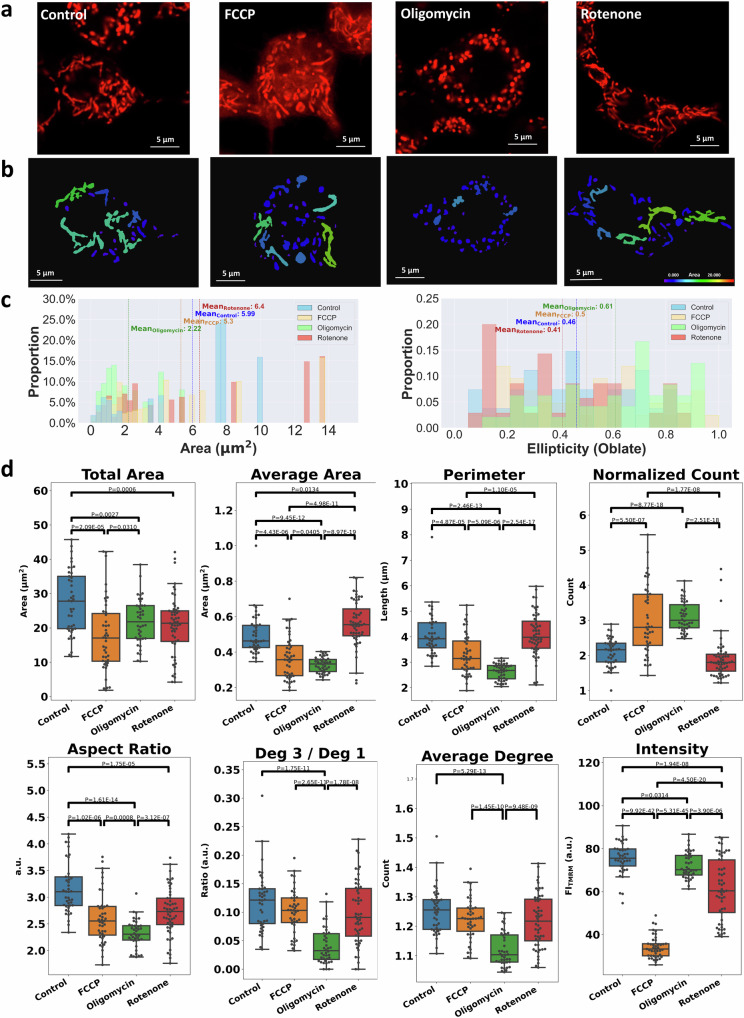
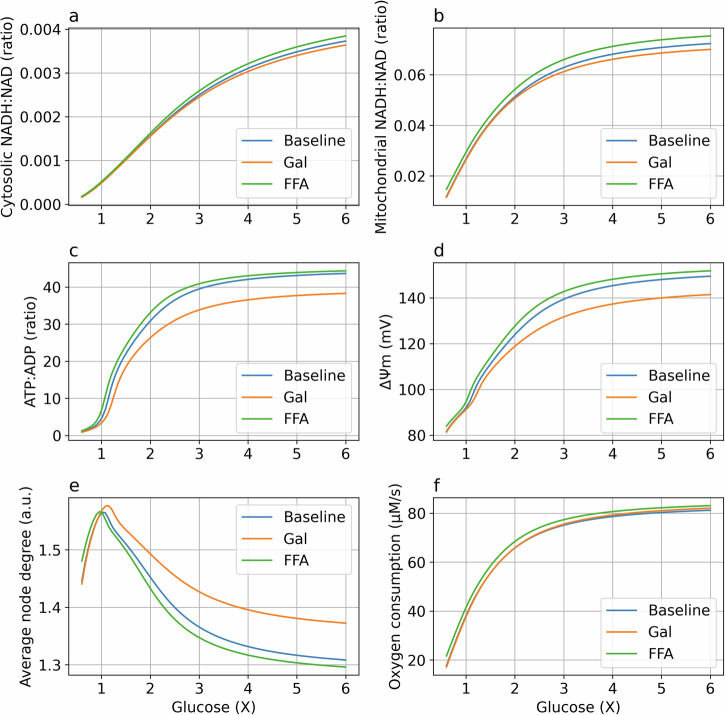
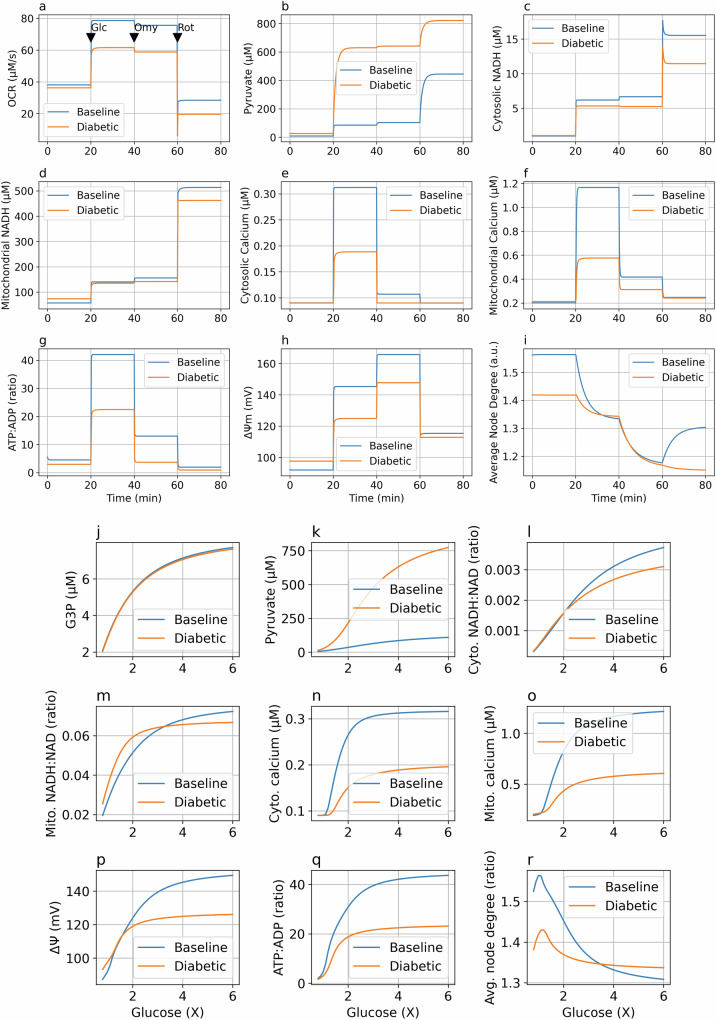
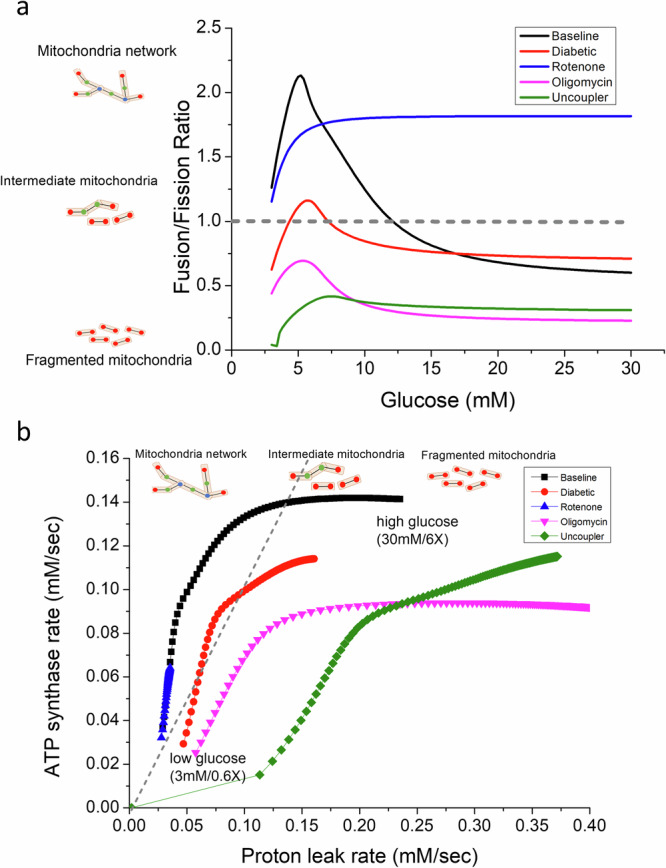
Cellular bioenergetics and mitochondrial dynamics are crucial for the secretion of insulin by pancreatic beta cells in response to elevated levels of blood glucose. To elucidate the interactions between energy production and mitochondrial fission/fusion dynamics, we combine live-cell mitochondria imaging with biophysical-based modeling and graph-based network analysis. The aim is to determine the mechanism that regulates mitochondrial morphology and balances metabolic demands in pancreatic beta cells. A minimalistic differential equation-based model for beta cells is constructed that includes glycolysis, oxidative phosphorylation, calcium dynamics, and fission/fusion dynamics, with ATP synthase flux and proton leak flux as main regulators of mitochondrial dynamics. The model shows that mitochondrial fission occurs in response to hyperglycemia, starvation, ATP synthase inhibition, uncoupling, and diabetic conditions, in which the rate of proton leakage exceeds the rate of mitochondrial ATP synthesis. Under these metabolic challenges, the propensities of tip-to-tip fusion events simulated from the microscopy images of the mitochondrial networks are lower than those in the control group and prevent the formation of mitochondrial networks. The study provides a quantitative framework that couples bioenergetic regulation with mitochondrial dynamics, offering insights into how mitochondria adapt to metabolic challenges.


Conflict of interest statement

The authors declare no competing interests.

Figures

Fig. 1
Fig. 1. Study of mitochondrial bioenergetics and dynamics coupling.
Glucose and inhibitors of the mitochondrial respiratory chain induced different mitochondrial responses and morphological changes in INS-1 cells. Image analyses were used to quantify the changes in fluorescence microscopy images of mitochondria under metabolic challenges. Computational models that coupled mitochondrial bioenergetics and mitochondrial dynamics were used to simulate and explain the experimental observations.
Fig. 2
Fig. 2. Steady-state values for a range of glucose concentrations and mitochondrial bioenergetics.
The steady-state values of the average node degree (a, d, and g; denoted as <k > ), mitochondrial membrane potential (b, e, and h; denoted as ΔΨ) and ATP-to-ADP ratio (c, f, and i; denoted as T:D) are represented by the colors in the 2D contour plots. The relative glucose concentrations are shown on the X-axis, and 5 mM is denoted as 1X in the simulation. The relative activities of ATP synthase (a, b, and c), the ETC (d, e, and f), and proton leakage activity (g, h, and i) on the Y-axis are presented by comparison to the baseline model values. The translucent arrows indicate how the mitochondrial parameters change in response to the addition of oligomycin, rotenone, or FCCP.
Fig. 3
Fig. 3. Simulated steady states under a range of glucose concentrations.
Steady-state values of (a) glyceraldehyde 3-phosphate (in µM), (b) pyruvate (in µM), (c) calcium (in µM), (d) cytosolic and mitochondrial NADH-to-NAD ratios, (e) ATP, ADP, and AMP (in µM), (f) the ATP-to-ADP ratio, (g) the mitochondrial membrane potential (in millivolts, mV), (h) the mitochondrial population in node degrees 1, 2, and 3, and (i) the average degree of nodes were compared under different glucose concentrations. The x-axis represents relative glucose concentrations, with 5 mM being 1X in the model simulation.
Fig. 4
Fig. 4. Mitochondria in INS-1 cells exhibited distinct morphologies under different glucose concentrations.
a Representative fluorescence images of mitochondria in INS-1 cells labeled with TMRM under our different glucose concentrations (with a baseline glucose concentration of 2 g/L, which is referred to as 1X in INS-1 cell culture medium). b Three-dimensional rendered surface images of the mitochondria in (a). The images were created using Imaris software (Oxford Instruments). The separated mitochondria are labeled with different colors corresponding to their volumes. c Histograms showing the distribution of volume and sphericity for separated mitochondrial components in an individual cell under a range of glucose concentrations. The data were acquired from cells in the images presented in (a). d Box plots of the 2D image analysis of mitochondria in INS-1 cells under different glucose concentrations. N = 60, 68, 64, and 58 cells for glucose concentrations of 0X, 1X, 3X, and 6X, respectively. The lower and upper bounds of the box are the first and third quartiles of the data, and the median is the line inside the box. The lower and upper whiskers represent the smallest and largest data points within 1.5 times the interquartile range from the first quartile and third quartile, respectively. All morphological indicator data were obtained using the image analysis pipeline in “Materials and Methods” section. Statistical significance was determined using Welch’s t test.
Fig. 5
Fig. 5. Mitochondria in INS-1 cells exhibited distinct morphologies under different chemical perturbations.
a Representative fluorescence images of mitochondria in INS-1 cells labeled with TMRM in the presence of oligomycin, FCCP, and rotenone at a concentration of 10 μM. b Masked images of mitochondria in images (a). Binary images were first obtained using FIJI software and then mapped with different colors corresponding to their areas. c Histograms showing the distribution of area and ellipticity for separated mitochondrial components in an individual cell under different glucose concentrations. The data were acquired from cells in the images shown in (b). d Box plots of the 2D image analysis of mitochondria in INS-1 cells under different chemical conditions. N = 41, 43, 40, and 53 for the control, FCCP, oligomycin and rotenone groups, respectively. The lower and upper bounds of the box are the first and third quartiles of the data, and the median is the line inside the box. The lower and upper whiskers represent the smallest and largest data points within 1.5 times the interquartile range from the first quartile and third quartile, respectively. All morphological indicator data were obtained using the image analysis pipeline in “Materials and Methods” section. Statistical significance was determined using Welch’s t test.
Fig. 6
Fig. 6. Comparison of baseline, galactose, and fatty acid addition models under a range of glucose/galactose levels.
The steady-state values of (a) the cytosolic NADH-to-NAD ratio, (b) the mitochondrial NADH-to-NAD ratio, (c) the ATP-to-ADP ratio, (d) the mitochondrial membrane potential, (e) the average degree of the mitochondrial network, and (f) the oxygen consumption rate for the glucose parameters (blue, denoted Baseline), galactose model (orange, denoted Gal), and fatty acid addition (green, denoted FFA) across a range of glucose/galactose levels (with 1X equal to 5 mM).
Fig. 7
Fig. 7. Response to cytosolic calcium oscillations.
Cellular concentrations (in μM) of (a) cytosolic and mitochondrial calcium, (b) ATP-to-ADP ratio, (c) mitochondrial membrane potential (in mV), (d) the average degree of nodes in the mitochondrial network, and (e) the ATP export rate by the ANT and the proton leak rate. The results of the last 8 min of the simulation are shown.
Fig. 8
Fig. 8. In silico ODE model response to glucose stimulation in the baseline and diabetic models.
Panels (a)–(i): the (a) oxygen consumption rate (in μM/s), (b) pyruvate (in μM), (c) cytosolic NADH (in μM), (d) mitochondrial NADH (in μM), (e) cytosolic calcium (in μM), (f) mitochondrial calcium (in μM), (g) ATP-to-ADP ratio, (h) mitochondrial membrane potential (in mV), and (i) average degree of mitochondrial nodes are compared following the sequential addition of glucose and chemical reagents in the baseline and diabetic models. Initially, the glucose concentration is at a baseline of 5 mM. At t = 20 min, the glucose concentration is increased to 20 mM. At t = 40 min, ATP synthase activity is decreased by 90% to simulate the blockade of ATP synthase by oligomycin. At t = 60 min, the ETC capacity was decreased by 90% to simulate rotenone/antimycin A blocking respiratory complexes. The actions are indicated by arrows in the first panel (a) only. Panels (j)–(r): Steady-state values of (j) glyceraldehyde 3-phosphate, G3P (in μM), (k) pyruvate (in μM), (l) cytosolic NADH:NAD ratio, (m) mitochondrial NADH:NAD ratio, (n) cytosolic calcium (in μM), (o) mitochondrial calcium (in μM), (p) mitochondrial membrane potential (in mV), (q) ATP-to-ADP ratio, and (r) average degree of mitochondrial nodes are compared between baseline and diabetic models under different glucose concentrations. The relative glucose concentration of 5 mM is presented as 1X.
Fig. 9
Fig. 9. Effects of glucose stimulation under various conditions.
a Ratios of the fusion to fission rates under the following conditions: default parameters (baseline, blue), diabetic parameters (diabetic, red), 90% ETC inhibition (rotenone, green), 90% ATP synthase inhibition (oligomycin, cyan), and five times the proton leakage rate (uncoupler, black). b Steady-state proton leakage rate (fission force) and ATP synthesis rate (fusion force) under various conditions (color codes are identical to a). Each dot represents the glucose concentration starting from 3 millimolar (the lower left dots) to 30 millimolar (the upper right dots) with an increment of 1 millimolar.
Fig. 10
Fig. 10. Workflow of mitochondrial network analysis and simulation.
a Workflow of the mitochondrial network model simulation and fitting of fission/fusion rates. An agent-based mitochondrial network model simulating two types of fission and fusion behaviors using nodes, edges, and degrees is used to represent and describe the mitochondrial network. Edges are considered the basic units that represent small segments of mitochondria, and nodes with different degrees are regarded as characteristic measurements of the mitochondrial network structure. b Fitting fission/fusion rates of mitochondria under different glucose concentrations and chemical treatments. The network parameters <k> (average degree of mitochondrial nodes), Ng1/N (number of nodes or edges of the largest cluster/total nodes or edges), and Ng2/N (number of nodes or edges of the second largest cluster/total nodes or edges) were extracted from fluorescence images of INS-1 and used as features for genetic algorithm (GA) fittings. By minimizing the distance between the distribution of network parameters (D(<k > , Ng1/N, Ng2/N)) extracted from fluorescence image analysis and the network model, the optimized C1 (ratio of the rate constants of tip-to-tip fusion to tip-to-tip fission) and C2 (ratio of the rate constants of tip-to-side fusion to tip-to-side fission) were obtained by a random search of the GA. Kernel density estimation was used to estimate the probability density function of the network parameters from confocal microscopy images of mitochondria, and Kullback-Leibler divergence was used to minimize the difference between two distributions calculated from KDE. c Agent-based model for visualization of simulated mitochondrial networks with C1/C2 ratios obtained from GA. d Ten and fifteen repeats of fitting for glucose and toxicity 2D data, respectively. e Tracking indicator “average degree” of the simulated networks during the iterations. f Images of the mitochondrial network in the agent-based model.

Similar articles

References

    1. Tilokani, L., Nagashima, S., Paupe, V. & Prudent, J. Mitochondrial dynamics: Overview of molecular mechanisms. Essays Biochem62, 341–360 (2018). - PMC - PubMed
    1. Stiles, L. & Shirihai, O. S. Mitochondrial dynamics and morphology in beta-cells. Best. Pract. Res. Clin. Endocrinol. Metab.26, 725–738 (2012). - PMC - PubMed
    1. Fu, W., Liu, Y. & Yin, H. Mitochondrial dynamics: biogenesis, fission, fusion, and mitophagy in the regulation of stem cell behaviors. Stem Cells Int2019, 9757201 (2019). - PMC - PubMed
    1. Chan, D. C. Mitochondrial dynamics and its involvement in disease. Annu. Rev. Pathol.15, 235–259 (2020). - PubMed
    1. Bereiter-Hahn, J., Vöth, M., Mai, S. & Jendrach, M. Structural implications of mitochondrial dynamics. Biotechnol. J.3, 765–780 (2008). - PubMed

Substances

LinkOut - more resources