. 2024 Oct 5;14(1):23191.
doi: 10.1038/s41598-024-74152-7.

Docosahexaenoic acid (DHA) is a driving force regulating gene expression in bluefin tuna (Thunnus thynnus) larvae development

Affiliations

Docosahexaenoic acid (DHA) is a driving force regulating gene expression in bluefin tuna (Thunnus thynnus) larvae development

William Koven et al. Sci Rep. .

Erratum in

Abstract

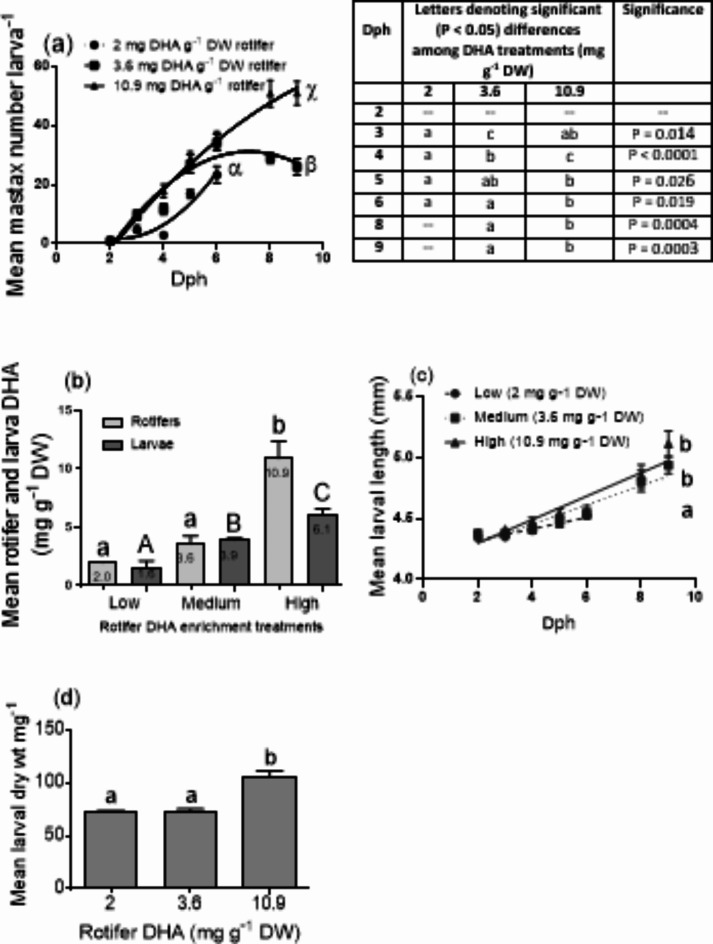
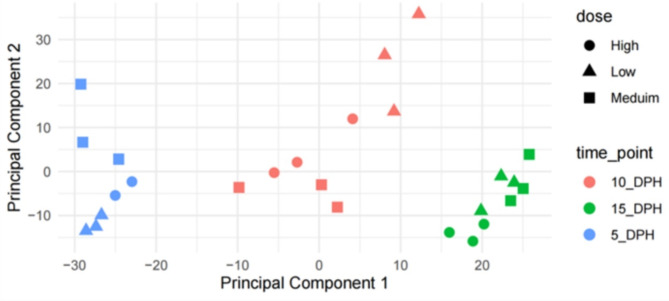
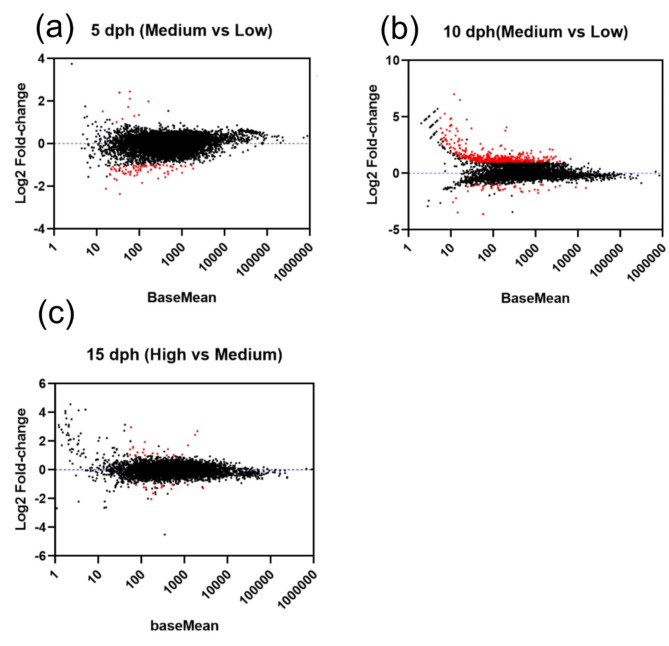
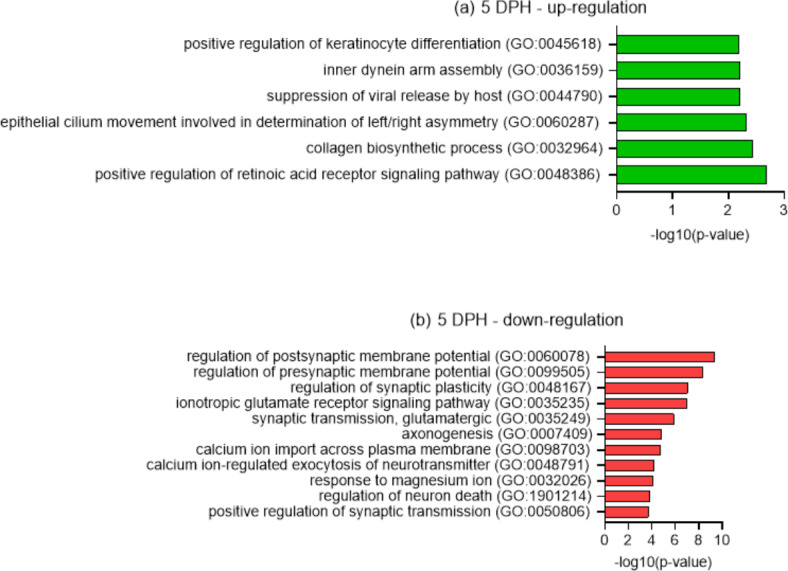
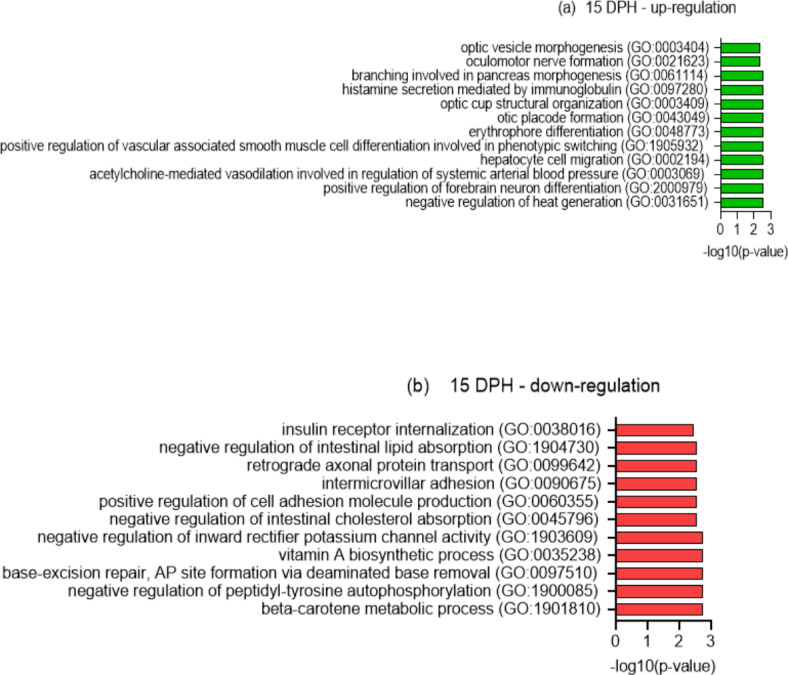
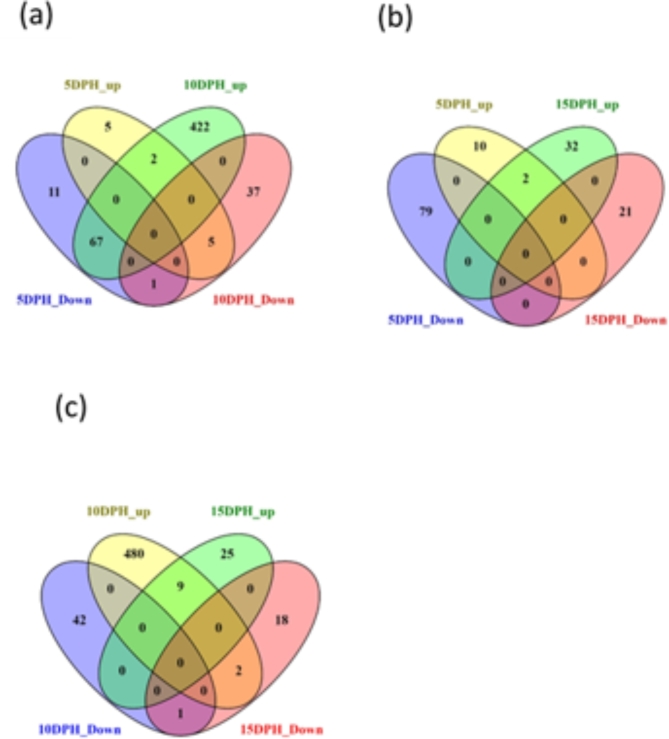
This study elucidated the role of DHA-modulated genes in the development and growth of Atlantic bluefin tuna (Thunnus thynnus) larvae ingesting increasing levels of DHA in their rotifer prey. The effect of feeding low, medium, and high rotifer (Brachionus rotundiformis) DHA levels (2.0, 3.6 and 10.9 mg DHA g-1 DW, respectively) was tested on 2-15 days post hatching (dph) bluefin tuna larvae. Larval DHA content markedly (P < 0.05) increased in a DHA dose-dependent manner (1.5, 3.9, 6.1 mg DHA g-1 DW larva, respectively), that was positively correlated with larval prey consumption and growth (P < 0.05). Gene ontology enrichment analyses of differentially expressed genes (DEGs) demonstrated dietary DHA significantly (P < 0.05) affected different genes and biological processes at different developmental ages. The number of DHA up-regulated DEGs was highest in 10 dph larvae (491), compared to 5 (12) and 15 dph fish (34), and were mainly involved in neural and synaptic development in the brain and spinal cord. In contrast, DHA in older 15 dph larvae elicited fewer DEGs but played critical roles over a wider range of developing organs. The emerging picture underscores the importance of DHA-modulated gene expression as a driving force in bluefin tuna larval development and growth.

Keywords: Bluefin tuna; Docosahexaenoic acid; Gene regulation; Larvae; Neurons; Synaptic function.


Conflict of interest statement

The authors declare no competing interests.

Figures

Fig. 1
Fig. 1
(a) Shows the effect of rotifer DHA on mean mastax number (rotifers consumed) larva−1 as a function of age (dph). Regression analysis compared the three curves (quadratic rotifer consumption was the preferred model according to Akaike’s information criteria). Curves having different Greek letters were significantly (P < 0.05) different. In the accompanying table different letters among treatments of a specific dph denoted significant (P < 0.05) differences in mastax number. (b) Displays the mean DHA levels in rotifers enriched on different DHA containing preparations (low, medium, high) and the levels of DHA in 15 dph BFT larvae feeding on these DHA enriched rotifers at 25 ⁰C. Mean DHA values with different letters in rotifers (small case) or larvae (large case) were significantly (P < 0.05) different. (c) Demonstrates the effect of the rotifer DHA treatments (low, medium, high) on mean larval length, as a function of age. Regression analysis compared the three curves (exponential growth was the preferred model according to Akaike’s information criteria). Curves having different letters were significantly (P < 0.05) different from each other. (d) Exhibits the effect of the rotifer DHA (mg g−1 DW) treatments on mean 15 dph larval dry (DW) weight. Dry wt values having different letters were significantly (P < 0.05) different.
Fig. 2
Fig. 2
Principal Component Analysis (PCA) plot illustrating the variability of gene expression profiles of BFT larvae fed three rotifer treatments (triplicate tanks treatment−1) that varied in their DHA content (Low, Medium, High) at three developmental ages (5, 10, 15 dph). Larval samples were distinctly different at different ages. Variability in 5 and 10 dph larvae was highest between the low and medium DHA treatments while the largest variability was between the medium and high DHA treatments in 15 dph fish.
Fig. 3
Fig. 3
The MA plots of the expression level (base mean of normalized counts) and ratio (Log2 Fold Change) for each DEG in (a) 5 dph, and (b) 10 dph larvae fed rotifers with medium DHA levels (3.6 mg g−1 rotifer) over larvae fed rotifers with low DHA levels (2.0 mg g−1 rotifer) are shown. In (c) DEGs in 15 dph larvae fed rotifers with high DHA levels (10.9 mg DHA g−1 DW) over larvae fed the medium DHA levels (3.6 mg g−1 rotifer) are presented. Significant (P < 0.05) DEGs are shown in red while non-significant DEGs are in black. BFT larval genes above the blue log2 fold change of 0 were up-regulated while those genes below the 0 blue line were down-regulated.
Fig. 4
Fig. 4
Gene ontology enrichment analysis of 5 dph larval DEGs, from comparing the medium to low DHA treatments, that are divided into their up regulated (a) and down regulated (b) genes. The graph displays significantly enriched biological processes (y-axis) and their selected probabilities (-log10 (P value) (x axis).
Fig. 5
Fig. 5
Gene ontology enrichment analysis of 10 dph BFT larval DEGs, from comparing the medium to low DHA treatments, that are divided into their up regulated (a) and down regulated (b) genes. The graph displays significantly enriched biological processes (y axis) and their selected probabilities (-log10 (P value) (x axis).
Fig. 6
Fig. 6
Gene ontology enrichment analysis of 15 dph BFT larval DEGs, from comparing the high to medium DHA treatments, that are divided into their up regulated (a) and down regulated (b) genes. The graph displays significantly enriched biological processes (y axis) and their selected probabilities (-log10 (P value) (x axis).
Fig. 7
Fig. 7
Venn diagrams of the numbers of significant (P < 0.05) DEGs that were up-regulated and down-regulated as well as the number of DEGs in common when comparing the medium to low DHA treatments in (a) 5 and 10 dph larvae, (b) 5 and 15 dph larvae and (c) 10 and 15 dph larvae.

References

    1. Izquierdo, M. & Koven, W. Lipids. In Larval fish nutrition 47–81 (Wiley, 2011). 10.1002/9780470959862.ch2.
    1. Gaon, A. et al. The combined DHA and taurine effect on vision, prey capture and growth in different age larvae of gilthead sea bream (Sparus aurata). Aquaculture545, 737181 (2021).
    1. Bell, M. V. et al. Dietary deficiency of docosahexaenoic acid impairs vision at low light intensities in juvenile herring (Clupea harengus L.). Lipids30, (1995). - PubMed
    1. Benítez-Santana, T. et al. Dietary n-3 HUFA deficiency induces a reduced visual response in gilthead seabream Sparus aurata larvae. Aquaculture264, 408–417 (2007).
    1. Mourente, G. et al. Lipids in female northern bluefin tuna (Thunnus thynnus thynnus L.) during sexual maturation. Fish Physiol. Biochem.2, 351–363 (2002).

Substances

LinkOut - more resources